
- SAP Community
- Products and Technology
- Technology
- Technology Blogs by SAP
- SAP HANA Graph, Interpol red notices and some Mach...
Technology Blogs by SAP
Learn how to extend and personalize SAP applications. Follow the SAP technology blog for insights into SAP BTP, ABAP, SAP Analytics Cloud, SAP HANA, and more.
Turn on suggestions
Auto-suggest helps you quickly narrow down your search results by suggesting possible matches as you type.
Showing results for
Advisor
Options
- Subscribe to RSS Feed
- Mark as New
- Mark as Read
- Bookmark
- Subscribe
- Printer Friendly Page
- Report Inappropriate Content
02-10-2020
10:27 AM
Hello,
If you're reading this, I bet the title caught your attention, what follows may not live up to your expectations.
The goal of this blog post is to present an example implementation of a graph based technique to compare entities. Example of entities could be products with their characteristics, or fugitive and their attributes. We'll use fugitives simply because data is easily available, and work often takes me to customers in public security using SAP HANA.
To reproduce those step, you'll need a HANA database (or a free trial account in SAP CP), python3 to push the data, and a WebIDE to explore the graphs.
Here's one taken from Interpol's public website:
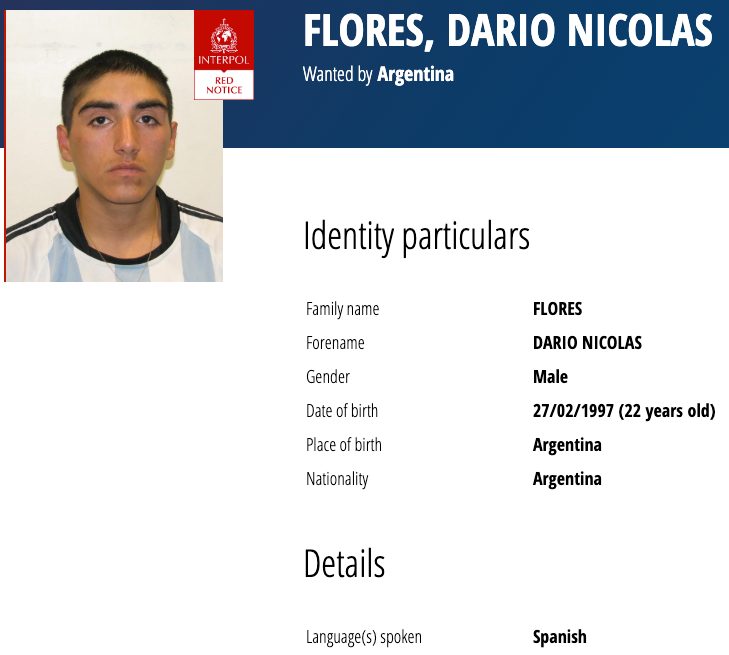
It shows standard attributes, name, gender, place of birth, nationality. The first reflex is to create a table, make a record for each person with each attribute in a dedicated column... Except people can speak multiple languages and hold multiple citizenship. Take for example the famous former CEO of the Renault Nissan Mitsubishi alliance, Carlos Ghosn. He speaks 5 languages and has triple citizenship! Another disadvantage of the tabular approach is that queries must be updated after adding a new attribute as a column. Queries for 50 attributes or more will be too large to write manually, and their performance will not scale when dealing with tens of millions of entities.
A different modelling approach is using a property graph: it's a graph where nodes are either entities or entity attributes. Edges represent an association between a person and an attribute. For Carlos Ghosn, this graph is:

Certain nodes have a number inside, it tells the number of connected nodes not currently displayed. Using the WedIDE of SAP HANA, we can double click on such a node to expand it. For instance, on "language spoken: English", we see there are 3 more individuals that speak English.

In public security, a common data modelling approach is called POLE for People Object Location Event. In some aspects, it is a property graph with 4 types of entities, and each has its own attributes. With SAP HANA, it is common to build views on top of physical tables, making it possible to maintain a traditional database schema, but define on top a logical representation with views and graph workspaces that make it easier for data exploration and advanced analytics.
For this blog post, the DDL commands to create the data model in SAP HANA are here.
Interpol publishes red notices on their website in json format:
This python program will query Interpol's website, convert data from json into a POLE property graph in a SAP HANA instance. If you don't use network encryption, you can remove the last parameter --haas
python3 get_red_notices.py --host myhots.com --port 2xxxx --user *** --password *** --haas
Data should then be stored in tables in the POLER schema:
The provided SQL script will also create graph workspaces:
You will then be able to explore the data and locate Carlos Ghosn.
A stored procedure called POST_LOAD is doing some data quality improvements and automatic categorisations: numerical attributes such as weight and height are dynamically grouped by intervals into 4 bins. Those bins become new attributes and are associated with persons.
To see the new categories, you could open the graph, and set a filter to select nodes with LABEL = FUGITIVE/height-approx
A benefit of using a property graph is the ability to enrich the graph with derived attributes. Another example could be to process the text of the red notice which is unstructured and in multiple languages. We could simply attach more generic attributes such as "drug related", "violence first degree", etc...
The same concept of enriching and normalizing attribute values can be applied to eye colors, and birth place could be geo coded.
Now that all the characteristics are in a property graph, similar entities are easy to find, we simply look for common neighbours. In the Predictive Algorithm Library of SAP HANA, there is an algorithm called "Linked Prediction" does exactly this! It looks at common neighbours and computes based on several methods the closeness of two nodes. If common neighbours have many connections, they have a small weight in computing the closeness of two nodes. In fact some methods use the rarity of a common neighbour to give a higher score.
This script is an example of applying this algorithm on the dataset.
In the outcome, you'll notice many obvious facts have been inferred:
But the results also present false inference that emerge from an imbalanced dataset:
Some links connecting persons also appear, let's explore those !
We see 7 common neighbours, also they share the same birthplace in Pakistan which is unique to them.
In conclusion, if you attempt to put different things into a single graph, you could look into a data model that is inspired of a property graph. I recommend to try first to define your graph on top of views, and use physical tables only to work around the Webide graph UI bug or experiment solutions to performance problems.
If you're reading this, I bet the title caught your attention, what follows may not live up to your expectations.
The goal of this blog post is to present an example implementation of a graph based technique to compare entities. Example of entities could be products with their characteristics, or fugitive and their attributes. We'll use fugitives simply because data is easily available, and work often takes me to customers in public security using SAP HANA.
To reproduce those step, you'll need a HANA database (or a free trial account in SAP CP), python3 to push the data, and a WebIDE to explore the graphs.
An Interpol red notice is a request to law enforcement worldwide to locate and provisionally arrest a person pending extradition, surrender, or similar legal action.
Here's one taken from Interpol's public website:
It shows standard attributes, name, gender, place of birth, nationality. The first reflex is to create a table, make a record for each person with each attribute in a dedicated column... Except people can speak multiple languages and hold multiple citizenship. Take for example the famous former CEO of the Renault Nissan Mitsubishi alliance, Carlos Ghosn. He speaks 5 languages and has triple citizenship! Another disadvantage of the tabular approach is that queries must be updated after adding a new attribute as a column. Queries for 50 attributes or more will be too large to write manually, and their performance will not scale when dealing with tens of millions of entities.
A different modelling approach is using a property graph: it's a graph where nodes are either entities or entity attributes. Edges represent an association between a person and an attribute. For Carlos Ghosn, this graph is:
Certain nodes have a number inside, it tells the number of connected nodes not currently displayed. Using the WedIDE of SAP HANA, we can double click on such a node to expand it. For instance, on "language spoken: English", we see there are 3 more individuals that speak English.
In public security, a common data modelling approach is called POLE for People Object Location Event. In some aspects, it is a property graph with 4 types of entities, and each has its own attributes. With SAP HANA, it is common to build views on top of physical tables, making it possible to maintain a traditional database schema, but define on top a logical representation with views and graph workspaces that make it easier for data exploration and advanced analytics.
For this blog post, the DDL commands to create the data model in SAP HANA are here.
Interpol publishes red notices on their website in json format:
{"arrest_warrants":[

  {"issuing_country_id":"JP","charge":"Violation of Companies Act\r\nArticle 960(1) and (iii)","charge_translation":null},

  {"issuing_country_id":"JP","charge":"Violation of Financial Instruments and Exchange Act\r\nArticle 24(1)and(i)\r\nArticle 197(1)","charge_translation":null},

  {"issuing_country_id":"JP","charge":"Violation of Companies Act\r\nArticle 960(1) and(iii)","charge_translation":null}],

"weight":null,

"forename":"CARLOS",

"date_of_birth":"1954/03/09",

"entity_id":"2020/104",

"languages_spoken_ids":["SPA","ENG","FRE","ARA","POR"],

"nationalities":["BR","LB","FR"],

"height":null,

"gender":"M",

"country_of_birth_id":null,"name":"GHOSN BICHARA",

"distinguishing_marks":null,

"eyes_colors_id":null,"hairs_id":null,

"place_of_birth":null,

"_embedded":{"links":[]},

"_links":{"self":{"href":"https://ws-public.interpol.int/notices/v1/red/2020-104"},"images":{"href":"https://ws-public.interpol.int/notices/v1/red/2020-104/images"}}}
This python program will query Interpol's website, convert data from json into a POLE property graph in a SAP HANA instance. If you don't use network encryption, you can remove the last parameter --haas
python3 get_red_notices.py --host myhots.com --port 2xxxx --user *** --password *** --haas
Data should then be stored in tables in the POLER schema:
- RELATIONSHIP (future edges for the graph)
- PERSON and PERSON_ATTR
- OBJECT and OBJECT_ATTR
The provided SQL script will also create graph workspaces:
- INTERPOL is built on the view V_NODES
- INTERPOL2 has the same data in the same format the first graph except the nodes are materialised in a separate table. It is to workaround a bug in the graph viewer of the webide.
- INTERPOL_BIDIRECTIONAL makes the graph fully bidirectional.
You will then be able to explore the data and locate Carlos Ghosn.
A stored procedure called POST_LOAD is doing some data quality improvements and automatic categorisations: numerical attributes such as weight and height are dynamically grouped by intervals into 4 bins. Those bins become new attributes and are associated with persons.
To see the new categories, you could open the graph, and set a filter to select nodes with LABEL = FUGITIVE/height-approx
A benefit of using a property graph is the ability to enrich the graph with derived attributes. Another example could be to process the text of the red notice which is unstructured and in multiple languages. We could simply attach more generic attributes such as "drug related", "violence first degree", etc...
- Spanish: HOMICIDIO AGRAVADO
- English: possession of drug in large quantity
- French: Récidive d'importation en contrebande de marchandise prohibée
The same concept of enriching and normalizing attribute values can be applied to eye colors, and birth place could be geo coded.
Finding similar entities
Now that all the characteristics are in a property graph, similar entities are easy to find, we simply look for common neighbours. In the Predictive Algorithm Library of SAP HANA, there is an algorithm called "Linked Prediction" does exactly this! It looks at common neighbours and computes based on several methods the closeness of two nodes. If common neighbours have many connections, they have a small weight in computing the closeness of two nodes. In fact some methods use the rarity of a common neighbour to give a higher score.
This script is an example of applying this algorithm on the dataset.
In the outcome, you'll notice many obvious facts have been inferred:
- Born in Russia ⇒ Speaks Russian
- Russian Nationality ⇒ Born in Russia
But the results also present false inference that emerge from an imbalanced dataset:
- Speak Spanish⇒Salvadorian nationality (or Argentine with a much lower score)
- Speak Spanish⇒Black hair
Some links connecting persons also appear, let's explore those !
We see 7 common neighbours, also they share the same birthplace in Pakistan which is unique to them.
Conclusion
In conclusion, if you attempt to put different things into a single graph, you could look into a data model that is inspired of a property graph. I recommend to try first to define your graph on top of views, and use physical tables only to work around the Webide graph UI bug or experiment solutions to performance problems.
- SAP Managed Tags:
- SAP HANA,
- SAP HANA, platform edition
Labels:
You must be a registered user to add a comment. If you've already registered, sign in. Otherwise, register and sign in.
Labels in this area
-
ABAP CDS Views - CDC (Change Data Capture)
2 -
AI
1 -
Analyze Workload Data
1 -
BTP
1 -
Business and IT Integration
2 -
Business application stu
1 -
Business Technology Platform
1 -
Business Trends
1,661 -
Business Trends
87 -
CAP
1 -
cf
1 -
Cloud Foundry
1 -
Confluent
1 -
Customer COE Basics and Fundamentals
1 -
Customer COE Latest and Greatest
3 -
Customer Data Browser app
1 -
Data Analysis Tool
1 -
data migration
1 -
data transfer
1 -
Datasphere
2 -
Event Information
1,400 -
Event Information
64 -
Expert
1 -
Expert Insights
178 -
Expert Insights
273 -
General
1 -
Google cloud
1 -
Google Next'24
1 -
Kafka
1 -
Life at SAP
784 -
Life at SAP
11 -
Migrate your Data App
1 -
MTA
1 -
Network Performance Analysis
1 -
NodeJS
1 -
PDF
1 -
POC
1 -
Product Updates
4,577 -
Product Updates
324 -
Replication Flow
1 -
RisewithSAP
1 -
SAP BTP
1 -
SAP BTP Cloud Foundry
1 -
SAP Cloud ALM
1 -
SAP Cloud Application Programming Model
1 -
SAP Datasphere
2 -
SAP S4HANA Cloud
1 -
SAP S4HANA Migration Cockpit
1 -
Technology Updates
6,886 -
Technology Updates
402 -
Workload Fluctuations
1
Related Content
- 10+ ways to reshape your SAP landscape with SAP Business Technology Platform - Blog 7 in Technology Blogs by SAP
- 10+ ways to reshape your SAP landscape with SAP Business Technology Platform – Blog 4 in Technology Blogs by SAP
- Experiencing Embeddings with the First Baby Step in Technology Blogs by Members
- Understanding AI, Machine Learning and Deep Learning in Technology Blogs by Members
- Harnessing the Power of SAP HANA Cloud Vector Engine for Context-Aware LLM Architecture in Technology Blogs by SAP
Top kudoed authors
| User | Count |
|---|---|
| 12 | |
| 9 | |
| 8 | |
| 7 | |
| 7 | |
| 6 | |
| 6 | |
| 6 | |
| 6 | |
| 4 |