


- SAP Community
- Products and Technology
- Technology
- Technology Blogs by SAP
- Debugging SAC Analytic Designer Applications
Technology Blogs by SAP
Learn how to extend and personalize SAP applications. Follow the SAP technology blog for insights into SAP BTP, ABAP, SAP Analytics Cloud, SAP HANA, and more.
Turn on suggestions
Auto-suggest helps you quickly narrow down your search results by suggesting possible matches as you type.
Showing results for
Advisor
Options
- Subscribe to RSS Feed
- Mark as New
- Mark as Read
- Bookmark
- Subscribe
- Printer Friendly Page
- Report Inappropriate Content
02-10-2020
11:58 PM
Google developer tools offers several ways to debug code, but in this blog we are going to discuss how to identify design errors and how to use console.log to output to the Google console.
When we are coding there are two types of errors - Design Time and Run Time.
Design time errors in most coding environments will prevent the code from running. However, in HTML and javascript the errors will not stop the code from running until the piece of code with the error is reached during execution. This means that coders have to be more diligent with observing their code as they write it.
Run time errors may or may not crash the application. If the error does something illegal, like divide by zero, then the code will stop with an error. However, if the code does something like divide by x, when it should of divided y, then error will not be caught at run time.
Environment
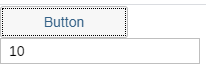
For this discussion, we are going to create a simple application with a button and an input field.
With this simple application, we will place code in the OnClick event for the button, and output to the Input Field. We will call the button: BtnAction and the input field IpOutput.
To place code in the OnClick for BtnAction, simply click on the fx to the right of the control in the Outline, as shown below:
Design time errors
Suppose that we had the following code in our OnClick event, where we set the x equal to 10, and then display it in our Input field (IpOutput)?
If we run the Analytic Application by clicking the Run Analytic Application link in the upper-right of our environment, then the application will run. However, when we click the BtnAction button, we will receive and error:
This error will appear in the lower-middle of the application. Any code after the error in the event will cease to run, so the error for the event is terminal.
If we run the application after every 5 or so lines of code, and test the events that contain the code, then we will find these errors early enough to find and repair them easily. However, if running the code that often is not convenient, then we could simply make the observation that the x argument in the setValue method has a little red squiggly line under it. This line means that there is an error. If we place our cursor on the red line, the the environment may give us a clue as to why there is an error, as shown in the screenshot below.
The environment is telling us that the setValue method cannot accept an integer as an argument. At first this may be a little frustrating, because an integer is what we have. However, to rectify the error, we can simply access the integer variable's builtin conversion function, by placing a period after the variable, and then by pressing [ctrl] + space.
In the above screenshot, we will notice that there are four builtin conversion functions for an integer variable. In this example, we will use the toString conversion function. After selecting the toString function, the little red line disappears and the error is resolved, as shown below.
Probably the most common design time error is simply forgetting to put the semi-colon at the end of each statement.
Every statement in our javascript code is terminated with a semicolon.
Mismanaging parentheses is another common error, as shown below:
In this example, we are missing the closing parenthesis for the if statement. It could be for the for loop, but if we assume that the indenting is proper, then we must assume that the missing parenthesis should be for the if statement.
In this case, we get no red squiggly line to show us where the error is. We do get a red highlighted line number, which is on line number 9. If we place our cursor over the red highlight, then the environment will tell us what is wrong, but not where the error is located.
If we indented our code properly, then this missing parenthesis location may be easy to locate. Also, if we are paying attention to the number line area, then we may notice the red highlight early enough to simply place the parenthesis.
The parenthesis has been placed and error resolved.
Run Time Errors
With run time errors, we do not get the red squiggly lines, because they are not errors until the code is executed. For example z = y/x is not an error, unless x=0. In addition, some errors do not throw errors messages and stop execution. For example, suppose that you wanted z = x/y, but you accidentally code d z = x/x.
These types of errors are the hardest to find, because they do not throw errors, and they simply manifest themselves by showing erroneous results when the application runs. In many debugging environments, we could set breakpoints to pause program execution and examine variable values while the code is paused. We can do this with Google development tools, but with Analytic Designer applications the code is difficult to debug in this way.
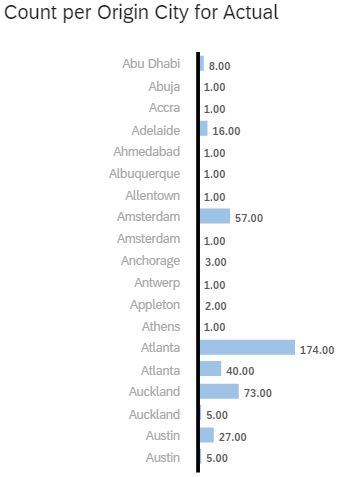
Therefore, many developers will use the console to examine the variables that they are working with at different code points in the application while it executes. To demonstrate how this works, we will add a chart widget to our canvas. It does not matter which data source that you use to do this. Simply place a chart with one dimension and one measure on your canvas.
I have added a chart with Origin City and Count to my canvas. I believe that I got this data from the OpenSAP course on SAC. I want to click on an element and determine which dimension has been selected. I am assuming that I know nothing about how to do this, so I will use the console to help me create this code.
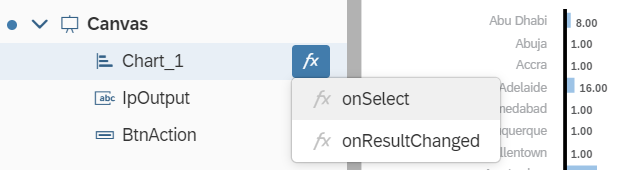
To start, I want to add code to the onSelect event of the chart. To do this, I will click on the fx to the right of the element in the application outline, as shown below.
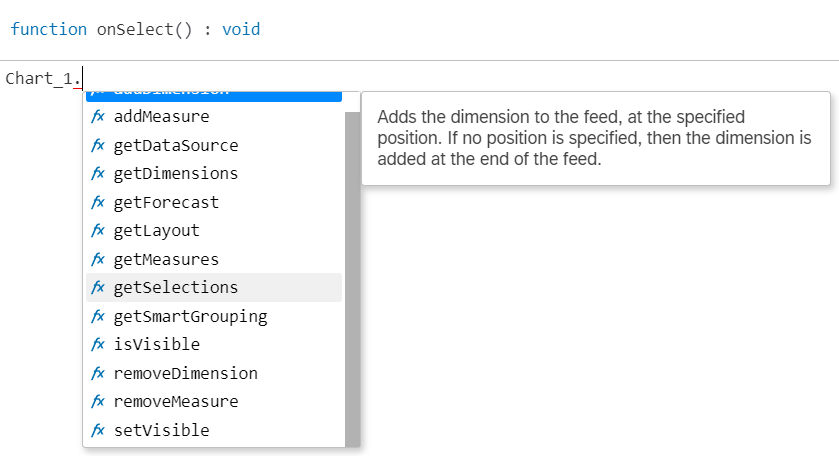
Next, I am going to look at the methods that are available to the chart widget, by typing the name of the widget, followed by a period, and then I will press [ctrl] + space to display a pop-up menu of options.
the method getSelections seems promising, but I do not know exactly what this method returns. Therefore, I am going to assign the return value to a variable, and then examine the variable in the console.
The above code assigns the return value from Chart_1's getSelections method to a variable called x. Then the contents of x is outputted to Google's console using the console.log function.
When I run the application and click on an element in the chart, in this case Atlanta, I get the following output.
I guess the questions are, "How did you see that?" and "What does that mean?" Good questions.
To see the console, first run the Analytics Application, and then press F12 or [ctrl]+[shift] + j. A section in the page will open and there will be menu items. Click on the Console menu item.
Most of the contents in the console, we will not care about. However, if you click on one of the chart elements, then you will see a new line added with >[{…}]. The little triangle preceding the new line means that it can be expanded to show more content. The [] brackets mean that the output is an array, and the {...} means that there is one element in the array. Let's click on the triangle and see what is exposed.
In this section, which is exposed when we click on the triangle, we see that the measure in the selection is Count and the value of the dimension is Atlanta. To isolate Atlanta, we use the following code:
If you are not sure why this code works, then please see my blog entry called Retrieving Selections from a Chart (Analytics Designer). So, if you were writing code, and you were unsure if this code would return the value, then you could use the console.log() function to examine the contents at run time. You could do this before writing anymore code that will utilize the variable that stores the value.
When writing code a person could put many console.logs throughout the code:
Using console.log() in this manner will allow the coder to know exactly how the values of variables within the code are behaving, and also allow the coders to better understand their code fragments. When coding it is important to run the code often, because knowing when code starts to stray from what the coder thinks it is doing will eliminate frustrating time trying to debug a massive amount of code. It also helps coders to write more elegant code and to steer it to a graceful completion.
When we are coding there are two types of errors - Design Time and Run Time.
Design time errors in most coding environments will prevent the code from running. However, in HTML and javascript the errors will not stop the code from running until the piece of code with the error is reached during execution. This means that coders have to be more diligent with observing their code as they write it.
Run time errors may or may not crash the application. If the error does something illegal, like divide by zero, then the code will stop with an error. However, if the code does something like divide by x, when it should of divided y, then error will not be caught at run time.
Environment
For this discussion, we are going to create a simple application with a button and an input field.
With this simple application, we will place code in the OnClick event for the button, and output to the Input Field. We will call the button: BtnAction and the input field IpOutput.
To place code in the OnClick for BtnAction, simply click on the fx to the right of the control in the Outline, as shown below:
Design time errors
Suppose that we had the following code in our OnClick event, where we set the x equal to 10, and then display it in our Input field (IpOutput)?
If we run the Analytic Application by clicking the Run Analytic Application link in the upper-right of our environment, then the application will run. However, when we click the BtnAction button, we will receive and error:
This error will appear in the lower-middle of the application. Any code after the error in the event will cease to run, so the error for the event is terminal.
If we run the application after every 5 or so lines of code, and test the events that contain the code, then we will find these errors early enough to find and repair them easily. However, if running the code that often is not convenient, then we could simply make the observation that the x argument in the setValue method has a little red squiggly line under it. This line means that there is an error. If we place our cursor on the red line, the the environment may give us a clue as to why there is an error, as shown in the screenshot below.
The environment is telling us that the setValue method cannot accept an integer as an argument. At first this may be a little frustrating, because an integer is what we have. However, to rectify the error, we can simply access the integer variable's builtin conversion function, by placing a period after the variable, and then by pressing [ctrl] + space.
Note:
Notice that the environment will display help for the selected function. These help texts can be very helpful.
In the above screenshot, we will notice that there are four builtin conversion functions for an integer variable. In this example, we will use the toString conversion function. After selecting the toString function, the little red line disappears and the error is resolved, as shown below.
No red line.
Code runs and sets value.
Probably the most common design time error is simply forgetting to put the semi-colon at the end of each statement.
Every statement in our javascript code is terminated with a semicolon.
Mismanaging parentheses is another common error, as shown below:
In this example, we are missing the closing parenthesis for the if statement. It could be for the for loop, but if we assume that the indenting is proper, then we must assume that the missing parenthesis should be for the if statement.
In this case, we get no red squiggly line to show us where the error is. We do get a red highlighted line number, which is on line number 9. If we place our cursor over the red highlight, then the environment will tell us what is wrong, but not where the error is located.
If we indented our code properly, then this missing parenthesis location may be easy to locate. Also, if we are paying attention to the number line area, then we may notice the red highlight early enough to simply place the parenthesis.
The parenthesis has been placed and error resolved.
Run Time Errors
With run time errors, we do not get the red squiggly lines, because they are not errors until the code is executed. For example z = y/x is not an error, unless x=0. In addition, some errors do not throw errors messages and stop execution. For example, suppose that you wanted z = x/y, but you accidentally code d z = x/x.
These types of errors are the hardest to find, because they do not throw errors, and they simply manifest themselves by showing erroneous results when the application runs. In many debugging environments, we could set breakpoints to pause program execution and examine variable values while the code is paused. We can do this with Google development tools, but with Analytic Designer applications the code is difficult to debug in this way.
Therefore, many developers will use the console to examine the variables that they are working with at different code points in the application while it executes. To demonstrate how this works, we will add a chart widget to our canvas. It does not matter which data source that you use to do this. Simply place a chart with one dimension and one measure on your canvas.
I have added a chart with Origin City and Count to my canvas. I believe that I got this data from the OpenSAP course on SAC. I want to click on an element and determine which dimension has been selected. I am assuming that I know nothing about how to do this, so I will use the console to help me create this code.
To start, I want to add code to the onSelect event of the chart. To do this, I will click on the fx to the right of the element in the application outline, as shown below.
Next, I am going to look at the methods that are available to the chart widget, by typing the name of the widget, followed by a period, and then I will press [ctrl] + space to display a pop-up menu of options.
the method getSelections seems promising, but I do not know exactly what this method returns. Therefore, I am going to assign the return value to a variable, and then examine the variable in the console.
Code: var x = Chart_1.getSelections();
console.log(x);
The above code assigns the return value from Chart_1's getSelections method to a variable called x. Then the contents of x is outputted to Google's console using the console.log function.
When I run the application and click on an element in the chart, in this case Atlanta, I get the following output.
Output: [{…}]
I guess the questions are, "How did you see that?" and "What does that mean?" Good questions.
To see the console, first run the Analytics Application, and then press F12 or [ctrl]+[shift] + j. A section in the page will open and there will be menu items. Click on the Console menu item.
Most of the contents in the console, we will not care about. However, if you click on one of the chart elements, then you will see a new line added with >[{…}]. The little triangle preceding the new line means that it can be expanded to show more content. The [] brackets mean that the output is an array, and the {...} means that there is one element in the array. Let's click on the triangle and see what is exposed.
In this section, which is exposed when we click on the triangle, we see that the measure in the selection is Count and the value of the dimension is Atlanta. To isolate Atlanta, we use the following code:
Code: var x = Chart_1.getSelections();
console.log(x[0]["City_Pair_Names"]);
Output: Atlanta
If you are not sure why this code works, then please see my blog entry called Retrieving Selections from a Chart (Analytics Designer). So, if you were writing code, and you were unsure if this code would return the value, then you could use the console.log() function to examine the contents at run time. You could do this before writing anymore code that will utilize the variable that stores the value.
When writing code a person could put many console.logs throughout the code:
console.log("value of x before clicking button: " + x.toString);
console.log("value of x after clicking button: " + x.toString);
Using console.log() in this manner will allow the coder to know exactly how the values of variables within the code are behaving, and also allow the coders to better understand their code fragments. When coding it is important to run the code often, because knowing when code starts to stray from what the coder thinks it is doing will eliminate frustrating time trying to debug a massive amount of code. It also helps coders to write more elegant code and to steer it to a graceful completion.
- SAP Managed Tags:
- SAP Analytics Cloud, analytics designer
Labels:
6 Comments
You must be a registered user to add a comment. If you've already registered, sign in. Otherwise, register and sign in.
Labels in this area
-
ABAP CDS Views - CDC (Change Data Capture)
2 -
AI
1 -
Analyze Workload Data
1 -
BTP
1 -
Business and IT Integration
2 -
Business application stu
1 -
Business Technology Platform
1 -
Business Trends
1,658 -
Business Trends
91 -
CAP
1 -
cf
1 -
Cloud Foundry
1 -
Confluent
1 -
Customer COE Basics and Fundamentals
1 -
Customer COE Latest and Greatest
3 -
Customer Data Browser app
1 -
Data Analysis Tool
1 -
data migration
1 -
data transfer
1 -
Datasphere
2 -
Event Information
1,400 -
Event Information
66 -
Expert
1 -
Expert Insights
177 -
Expert Insights
293 -
General
1 -
Google cloud
1 -
Google Next'24
1 -
Kafka
1 -
Life at SAP
780 -
Life at SAP
13 -
Migrate your Data App
1 -
MTA
1 -
Network Performance Analysis
1 -
NodeJS
1 -
PDF
1 -
POC
1 -
Product Updates
4,577 -
Product Updates
340 -
Replication Flow
1 -
RisewithSAP
1 -
SAP BTP
1 -
SAP BTP Cloud Foundry
1 -
SAP Cloud ALM
1 -
SAP Cloud Application Programming Model
1 -
SAP Datasphere
2 -
SAP S4HANA Cloud
1 -
SAP S4HANA Migration Cockpit
1 -
Technology Updates
6,873 -
Technology Updates
418 -
Workload Fluctuations
1
Related Content
- Embracing TypeScript in SAPUI5 Development in Technology Blogs by Members
- Kyma Integration with SAP Cloud Logging. Part 2: Let's ship some traces in Technology Blogs by SAP
- Consuming SAP with SAP Build Apps - Connectivity options for low-code development - part 2 in Technology Blogs by SAP
- Gamifying SAP C4C with BTP, the Flutter or Build Apps way. in Technology Blogs by SAP
- Horizon Theme and Templates for Stories in SAP Analytics Cloud in Technology Blogs by SAP
Top kudoed authors
| User | Count |
|---|---|
| 35 | |
| 25 | |
| 13 | |
| 7 | |
| 7 | |
| 6 | |
| 6 | |
| 6 | |
| 5 | |
| 4 |