
- SAP Community
- Products and Technology
- Human Capital Management
- HCM Blogs by Members
- Advance Reporting Query -ORD
Human Capital Management Blogs by Members
Gain valuable knowledge and tips on SAP SuccessFactors and human capital management from member blog posts. Share your HCM insights with a post of your own.
Turn on suggestions
Auto-suggest helps you quickly narrow down your search results by suggesting possible matches as you type.
Showing results for
former_member54
Explorer
Options
- Subscribe to RSS Feed
- Mark as New
- Mark as Read
- Bookmark
- Subscribe
- Printer Friendly Page
- Report Inappropriate Content
01-28-2020
7:44 AM
Trying to understand the Query creation in ORD (Advanced Reporting ) ? then here you go with detailed information on it which will give you perfect understanding to reports in ORD.As of now this contains Creating query in Advanced reporting (Part-1) ….soon Creating query in Deatiled reporting (Part-2 ) will be published .
Report Center :
Report Center simplifies the usage of SuccessFactors Reporting Tools by providing access to reports from one place.The Online Report Designer (ORD) is an embedded reporting tool in SAP SuccessFactors. It’s part of the SuccessFactors Foundation package and is available for every customer no matter which modules you have purchased.
Embedded Analytics = formerly Reporting (Ad-Hoc, BIRT, Tiles/Dashboard and ORD)
Extended Analytics = formerly Analytics and Planning (WFA and WFP)
Let us start with Canvas report enabling .
Import Report definition :
To import a Report – Canvas, enable the Report Canvas Designer or Report Canvas Designer Admin permission.
Go to Reporting from the main navigation menu ---->The Report Center page opens.
Click Import--->Import report definition dialog opens.
1.Enter the report name.
2.Enter the description.
Click Browse and locate the file.
Click Import in the Import report definition dialog and then click Close.
The imported report definition is available in the Report Center list.
Canvas Report
Canvas report can be presented in table, and chart styles, and pivot dataReports can be exported as power point, pdf, word, or excel spreadsheets.

Canvas Reports can be used to easily drag & drop components onto a report page, these components can include Tables, Charts, Images or Text.
Two types of Reporting in Canvas reports
a)Advanced Reporting : A query design tool that allows you to create queries from Employee Central Advanced Reporting data
b)Detailed Reporting : A query design tool that allows you to create queries from Report - Table data
Creating queries -Advanced Reporting :
After selecting Canvas report then name the report .Then try to click on menu to get the options on choosing what kind of report you are expecting as output (Charts,Tables,Texts,Inages).

Now try to drag the component you choose on the page and then Edit the component's Query.If required query is not created before ,select "New Query".

Choose "Advanced Reporting ".

Initial Screen of query :
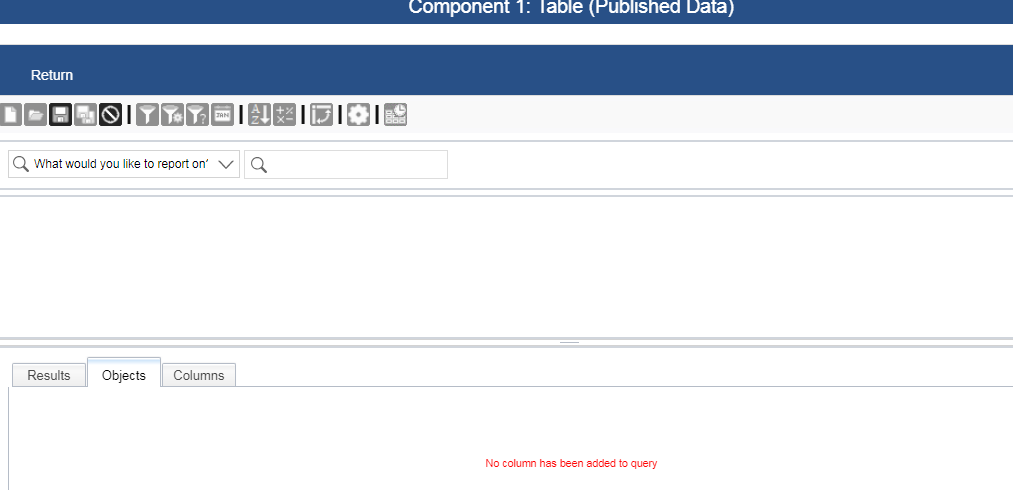
As an example now Let us pull "Dependents Information " for advanced reporting .
So we need to select "Person" in the drop of "What would you like to report on ".From that select the values and its relation for Dependents .Selecting "Person" gives the personal information details and their relationships .

Drag the fields which are needed for the reporting of dependents information.

On the right Corner there will be an option to edit the table which will give possibility to add other fields needed for the employee information on table as shown below.

Here we need to get the information related dependents from the employee personal information .Choose the right " >" then scroll down to dependents information .Same as we choose fields from Personal information now choose the fields from dependents .

Then the below one the visual view of the objects .
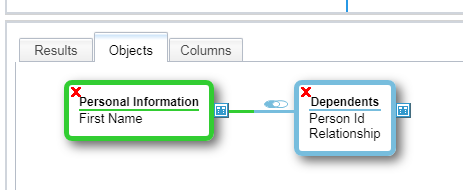
For dependents personal information now again choose ">" form the dependents right side. Here the choose the fields such as Dependents First name ,Dependents Last Name ,Dependents Date of Birth .Now this gives a clear view of the tables forming the query to get the related information from employee's Dependents.

Now just click on "Results " which will show the results for the prepared query from the tables.

A Excel file can be downloaded when we choose the Excel icon on the results page or the query can be saved and results will be showed on the page that components are dragged into .
Now we are done with creating an Advanced Reports .
Part 2: Creating queries in Detailed Reporting(Coming Soon)
Summary:
Online Report Designer is a great tool and It closes the gap of cross-domain reporting when compared with the Ad hoc Reporting and it also offers a wide range of visual options.Hope the future enhancements will be more to adopt the cross domain reporting along with Employee Central Successfactors.
Report Center :
Report Center simplifies the usage of SuccessFactors Reporting Tools by providing access to reports from one place.The Online Report Designer (ORD) is an embedded reporting tool in SAP SuccessFactors. It’s part of the SuccessFactors Foundation package and is available for every customer no matter which modules you have purchased.
Embedded Analytics = formerly Reporting (Ad-Hoc, BIRT, Tiles/Dashboard and ORD)
Extended Analytics = formerly Analytics and Planning (WFA and WFP)
Let us start with Canvas report enabling .
Import Report definition :
To import a Report – Canvas, enable the Report Canvas Designer or Report Canvas Designer Admin permission.
Go to Reporting from the main navigation menu ---->The Report Center page opens.
Click Import--->Import report definition dialog opens.
1.Enter the report name.
2.Enter the description.
Click Browse and locate the file.
Click Import in the Import report definition dialog and then click Close.
The imported report definition is available in the Report Center list.
Canvas Report
Canvas report can be presented in table, and chart styles, and pivot dataReports can be exported as power point, pdf, word, or excel spreadsheets.
Canvas Reports can be used to easily drag & drop components onto a report page, these components can include Tables, Charts, Images or Text.
Two types of Reporting in Canvas reports
a)Advanced Reporting : A query design tool that allows you to create queries from Employee Central Advanced Reporting data
b)Detailed Reporting : A query design tool that allows you to create queries from Report - Table data
Creating queries -Advanced Reporting :
After selecting Canvas report then name the report .Then try to click on menu to get the options on choosing what kind of report you are expecting as output (Charts,Tables,Texts,Inages).
Now try to drag the component you choose on the page and then Edit the component's Query.If required query is not created before ,select "New Query".
Choose "Advanced Reporting ".
Initial Screen of query :
As an example now Let us pull "Dependents Information " for advanced reporting .
So we need to select "Person" in the drop of "What would you like to report on ".From that select the values and its relation for Dependents .Selecting "Person" gives the personal information details and their relationships .
Drag the fields which are needed for the reporting of dependents information.
On the right Corner there will be an option to edit the table which will give possibility to add other fields needed for the employee information on table as shown below.
Here we need to get the information related dependents from the employee personal information .Choose the right " >" then scroll down to dependents information .Same as we choose fields from Personal information now choose the fields from dependents .
Then the below one the visual view of the objects .
For dependents personal information now again choose ">" form the dependents right side. Here the choose the fields such as Dependents First name ,Dependents Last Name ,Dependents Date of Birth .Now this gives a clear view of the tables forming the query to get the related information from employee's Dependents.
Now just click on "Results " which will show the results for the prepared query from the tables.
A Excel file can be downloaded when we choose the Excel icon on the results page or the query can be saved and results will be showed on the page that components are dragged into .
Now we are done with creating an Advanced Reports .
Part 2: Creating queries in Detailed Reporting(Coming Soon)
Summary:
Online Report Designer is a great tool and It closes the gap of cross-domain reporting when compared with the Ad hoc Reporting and it also offers a wide range of visual options.Hope the future enhancements will be more to adopt the cross domain reporting along with Employee Central Successfactors.
You must be a registered user to add a comment. If you've already registered, sign in. Otherwise, register and sign in.
Labels in this area
-
1H 2024 Product Release
5 -
2H 2023 Product Release
1 -
ACCRUAL TRANSFER
1 -
Advanced Workflow
1 -
Anonymization
1 -
BTP
1 -
Business Rules
1 -
Canvas Report
1 -
Career Development
1 -
Certificate-Based Authentication
1 -
Cloud Platform Integration
1 -
Compensation
1 -
Compensation Information Management
1 -
Compensation Management
1 -
Compliance
2 -
Content
1 -
Conversational AI
2 -
Custom Data Collection
1 -
custom portlet
1 -
Data & Analytics
1 -
Data Integration
1 -
Dayforce
1 -
deep link
1 -
deeplink
1 -
Delimiting Pay Components
1 -
Deprecation
1 -
Employee Central
1 -
Employee Central Global Benefits
1 -
Employee Central Payroll
1 -
employee profile
1 -
Employee Rehires
1 -
external terminal
1 -
external time events
1 -
Generative AI
2 -
Getting Started
1 -
Global Benefits
1 -
Guidelines
1 -
H2 2023
1 -
HR
2 -
HR Data Management
1 -
HR Transformation
1 -
ilx
1 -
Incentive Management Setup (Configuration)
1 -
Integration Center
2 -
Integration Suite
1 -
internal mobility
1 -
Introduction
1 -
learning
3 -
LMS
2 -
LXP
1 -
Massively MDF attachments download
1 -
Mentoring
1 -
Metadata Framework
1 -
Middleware Solutions
1 -
OCN
1 -
OData APIs
1 -
ONB USA Compliance
1 -
Onboarding
2 -
Opportunity Marketplace
1 -
Pay Component Management
1 -
Platform
1 -
portlet
1 -
POSTMAN
1 -
Predictive AI
2 -
Recruiting
1 -
recurring payments
1 -
Role Based Permissions (RBP)
2 -
SAP CPI (Cloud Platform Integration)
1 -
SAP HCM (Human Capital Management)
2 -
SAP HR Solutions
2 -
SAP Integrations
1 -
SAP release
1 -
SAP successfactors
5 -
SAP SuccessFactors Customer Community
1 -
SAP SuccessFactors OData API
1 -
SAP Workzone
1 -
SAP-PAYROLL
1 -
skills
1 -
Skills Management
1 -
sso deeplink
1 -
Stories in People Analytics
3 -
Story Report
1 -
SuccessFactors
2 -
SuccessFactors Employee central home page customization.
1 -
SuccessFactors Onboarding
1 -
successfactors onboarding i9
1 -
Table Report
1 -
talent
1 -
Talent Intelligence Hub
2 -
talents
1 -
Tax
1 -
Tax Integration
1 -
Time Accounts
1 -
Workflows
1 -
XML Rules
1
Related Content
- New 1H 2024 SAP Successfactors Time (Tracking) Features in Human Capital Management Blogs by SAP
- Reducing Active User Counts by Terminating Producer Details in APM in Human Capital Management Blogs by SAP
- How to Enable Stories in People Analytics for SF systems provisioned before 2022 in Human Capital Management Blogs by Members
- Extracting Proxy Information Via the XDL and API in SAP SuccessFactors Incentive Management in Human Capital Management Blogs by Members
- PRD/Custom Report - Only Single User do not appear if set "Date Filter" while pulling out the Report in Human Capital Management Q&A
Top kudoed authors
| User | Count |
|---|---|
| 12 | |
| 8 | |
| 4 | |
| 4 | |
| 2 | |
| 2 | |
| 1 | |
| 1 | |
| 1 | |
| 1 |