
- SAP Community
- Products and Technology
- Technology
- Technology Blogs by SAP
- Machine Learning: Smart Insights vs. Smart Discove...
Technology Blogs by SAP
Learn how to extend and personalize SAP applications. Follow the SAP technology blog for insights into SAP BTP, ABAP, SAP Analytics Cloud, SAP HANA, and more.
Turn on suggestions
Auto-suggest helps you quickly narrow down your search results by suggesting possible matches as you type.
Showing results for
former_member75
Participant
Options
- Subscribe to RSS Feed
- Mark as New
- Mark as Read
- Bookmark
- Subscribe
- Printer Friendly Page
- Report Inappropriate Content
01-01-2020
2:55 PM
Smart Insights vs. Smart Discovery: what's the difference? Both are powerful machine learning features in SAP Analytics Cloud that help users to take advantage of advanced contribution, classification, and regression techniques. They also help anyone to find out hidden patterns and complex relationships within their information, even without any data science knowledge or experience.
But in SAP Analytics Cloud, how are these two machine learning features different?
In this post, we'll explore the differences between the features and show how you can use them to drive your business forward.
First things first: What is Smart Insights and what is Smart Discovery?
Smart Insights pick ups a data point, variance in data and examine what is behind that data. It helps to find quickly what is behind a particular item. It can add contexts to your visualization which helps in understanding what is going on. Smart Insights uncovers top contributors of a selected value or variance point.
To run Smart Insights, click a data point on a chart, use the right click context menu and select the light bulb symbol.
Smart Discovery is a very powerful feature of SAP Analytics Cloud that uses machine learning to analyze and explore your data and uncover valuable insights. SAP Analytics Cloud’s smart data discovery feature helps in saving time by running automated machine learning algorithms in the back end to find out correlations between your dataset elements against the target metric. Smart Discovery identifies the key influencers of a selected measure or dimension.
To run a Smart Discovery, enter data-view, select a data model and choose the dimension or measure you’re interested in exploring.
Together, these two powerful machine learning capabilities help businesses to make quick decisions with SAP Analytics Cloud.
But what’s the difference between Top Contributors and Key Influencers?
While “contributors” and “influencers” sound very similar, how they're calculated and the value they provide to the business is very different.
Top Contributors refer to the dimension members that provide the highest contribution to the data point being analyzed. The Smart Insights feature answers the question “what are the top contributors to the data point or variance selected in this chart?”
To answer the question, machine learning calculations run on information that is of the same nature as the selected data point. For example, if the selected data point is volume, the top contributors are based on volume.
Without Smart Insights, a business user would have to manually pivot the data to identify the members from each dimension that contribute most to the data point. This makes Smart Insights a major time saver for business users looking for quick answers to a particular value.
Smart Insights use-case example
In this case, we want to use Smart Insights to explain the top contributor to the net revenue of sales in Q3, 2018 for a sports clothing company.
By running Smart Insights, we quickly see that our sales were higher for United States region as that is been identified as top most contributor. There are other top contributors as well, with these details now we can investigate further and find what has been driving the sales successfully in the past. In this case, we can drill down and run Smart Insights against country United States from within the existing Smart Insights panel. We get different Top Contributors this time for the specific combination of Net Revenue in Q3’2018 for country United States.
Note that in the recent releases of SAP Analytics Cloud, Smart Insights is been enhanced to show different types of Insights; one out of which is ‘Top Contributor’ analysis.
Key influencers are measures and dimensions that influence results; they are identified from the information in your selected model using classification and regression Machine Learning techniques. Classification techniques are used to identify dimensions that segregate results into different groups of outcomes. Regression techniques identify relationships between data points in order to predict future outcomes.
In this case, we’ll use our sales data to run a Smart Discovery on a sales dataset.
Right away, Smart Discovery helps a user to understand the significance of key influences on the selected measure or dimension. Further, you can explore key influencers in greater detail, so for example by selecting the light bulb, you can analyze impact of relationship between 2 key influencers on to the selected outcome.
Next, Smart Discovery identifies unexpected values using a predictive algorithm that calculates the difference between expected and actual results.
With Smart Discovery, users can simulate how the predicted value may change in different scenarios. This helps the user understand sensitivities around the influencers and predict a future outcome.
Smart Discovery and Smart Insights help users to take advantage of advanced contribution, classification, and regression techniques with the power of machine learning. The features empower anyone to surface hidden patterns and complex relationships within their information, even without any data science knowledge or experience.
Together, they are powerful machine learning capabilities that help businesses make faster, better decisions with SAP Analytics Cloud.
But in SAP Analytics Cloud, how are these two machine learning features different?
In this post, we'll explore the differences between the features and show how you can use them to drive your business forward.
Using Machine Learning in SAP Analytics Cloud
First things first: What is Smart Insights and what is Smart Discovery?
Smart Insights pick ups a data point, variance in data and examine what is behind that data. It helps to find quickly what is behind a particular item. It can add contexts to your visualization which helps in understanding what is going on. Smart Insights uncovers top contributors of a selected value or variance point.
To run Smart Insights, click a data point on a chart, use the right click context menu and select the light bulb symbol.
Smart Discovery is a very powerful feature of SAP Analytics Cloud that uses machine learning to analyze and explore your data and uncover valuable insights. SAP Analytics Cloud’s smart data discovery feature helps in saving time by running automated machine learning algorithms in the back end to find out correlations between your dataset elements against the target metric. Smart Discovery identifies the key influencers of a selected measure or dimension.
To run a Smart Discovery, enter data-view, select a data model and choose the dimension or measure you’re interested in exploring.
Together, these two powerful machine learning capabilities help businesses to make quick decisions with SAP Analytics Cloud.
But what’s the difference between Top Contributors and Key Influencers?
While “contributors” and “influencers” sound very similar, how they're calculated and the value they provide to the business is very different.
Smart Insights and Top Contributors
Top Contributors refer to the dimension members that provide the highest contribution to the data point being analyzed. The Smart Insights feature answers the question “what are the top contributors to the data point or variance selected in this chart?”
To answer the question, machine learning calculations run on information that is of the same nature as the selected data point. For example, if the selected data point is volume, the top contributors are based on volume.
Without Smart Insights, a business user would have to manually pivot the data to identify the members from each dimension that contribute most to the data point. This makes Smart Insights a major time saver for business users looking for quick answers to a particular value.
Smart Insights use-case example
In this case, we want to use Smart Insights to explain the top contributor to the net revenue of sales in Q3, 2018 for a sports clothing company.

By running Smart Insights, we quickly see that our sales were higher for United States region as that is been identified as top most contributor. There are other top contributors as well, with these details now we can investigate further and find what has been driving the sales successfully in the past. In this case, we can drill down and run Smart Insights against country United States from within the existing Smart Insights panel. We get different Top Contributors this time for the specific combination of Net Revenue in Q3’2018 for country United States.

Note that in the recent releases of SAP Analytics Cloud, Smart Insights is been enhanced to show different types of Insights; one out of which is ‘Top Contributor’ analysis.
Smart Discovery and Key Influencers
Key influencers are measures and dimensions that influence results; they are identified from the information in your selected model using classification and regression Machine Learning techniques. Classification techniques are used to identify dimensions that segregate results into different groups of outcomes. Regression techniques identify relationships between data points in order to predict future outcomes.
Smart Discovery use-case example
In this case, we’ll use our sales data to run a Smart Discovery on a sales dataset.
Right away, Smart Discovery helps a user to understand the significance of key influences on the selected measure or dimension. Further, you can explore key influencers in greater detail, so for example by selecting the light bulb, you can analyze impact of relationship between 2 key influencers on to the selected outcome.
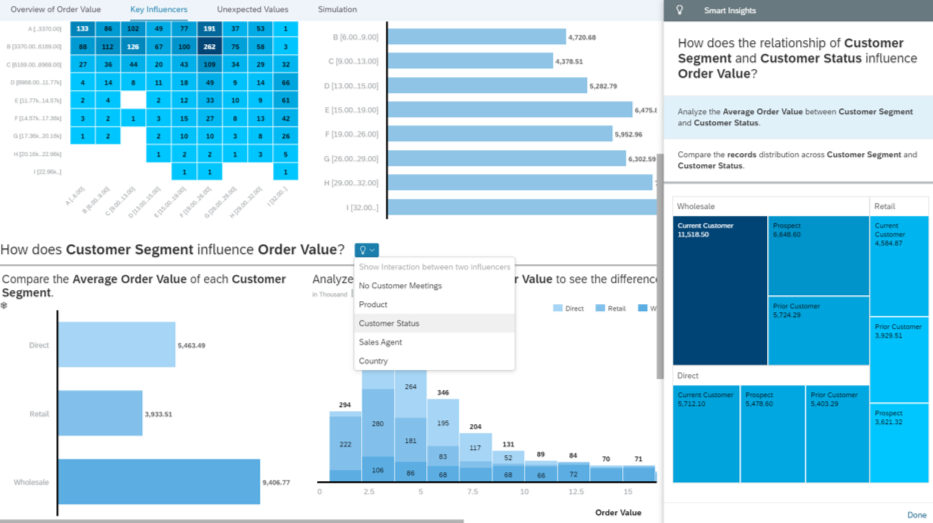
Next, Smart Discovery identifies unexpected values using a predictive algorithm that calculates the difference between expected and actual results.

With Smart Discovery, users can simulate how the predicted value may change in different scenarios. This helps the user understand sensitivities around the influencers and predict a future outcome.

Comparison Table and Summary

Smart Discovery and Smart Insights help users to take advantage of advanced contribution, classification, and regression techniques with the power of machine learning. The features empower anyone to surface hidden patterns and complex relationships within their information, even without any data science knowledge or experience.
Together, they are powerful machine learning capabilities that help businesses make faster, better decisions with SAP Analytics Cloud.
- SAP Managed Tags:
- SAP Analytics Cloud,
- SAP Analytics Cloud for planning,
- Data and Analytics
Labels:
You must be a registered user to add a comment. If you've already registered, sign in. Otherwise, register and sign in.
Labels in this area
-
ABAP CDS Views - CDC (Change Data Capture)
2 -
AI
1 -
Analyze Workload Data
1 -
BTP
1 -
Business and IT Integration
2 -
Business application stu
1 -
Business Technology Platform
1 -
Business Trends
1,658 -
Business Trends
91 -
CAP
1 -
cf
1 -
Cloud Foundry
1 -
Confluent
1 -
Customer COE Basics and Fundamentals
1 -
Customer COE Latest and Greatest
3 -
Customer Data Browser app
1 -
Data Analysis Tool
1 -
data migration
1 -
data transfer
1 -
Datasphere
2 -
Event Information
1,400 -
Event Information
66 -
Expert
1 -
Expert Insights
177 -
Expert Insights
297 -
General
1 -
Google cloud
1 -
Google Next'24
1 -
Kafka
1 -
Life at SAP
780 -
Life at SAP
13 -
Migrate your Data App
1 -
MTA
1 -
Network Performance Analysis
1 -
NodeJS
1 -
PDF
1 -
POC
1 -
Product Updates
4,577 -
Product Updates
343 -
Replication Flow
1 -
RisewithSAP
1 -
SAP BTP
1 -
SAP BTP Cloud Foundry
1 -
SAP Cloud ALM
1 -
SAP Cloud Application Programming Model
1 -
SAP Datasphere
2 -
SAP S4HANA Cloud
1 -
SAP S4HANA Migration Cockpit
1 -
Technology Updates
6,873 -
Technology Updates
420 -
Workload Fluctuations
1
Related Content
- Start page of SAP Signavio Process Insights, discovery edition, the 4 pillars and documentation in Technology Blogs by SAP
- Embracing TypeScript in SAPUI5 Development in Technology Blogs by Members
- Introducing Blog Series of SAP Signavio Process Insights, discovery edition – An in-depth exploratio in Technology Blogs by SAP
- Unify your process and task mining insights: How SAP UEM by Knoa integrates with SAP Signavio in Technology Blogs by SAP
- SAP HANA Cloud Vector Engine: Quick FAQ Reference in Technology Blogs by SAP
Top kudoed authors
| User | Count |
|---|---|
| 37 | |
| 25 | |
| 17 | |
| 13 | |
| 7 | |
| 7 | |
| 7 | |
| 6 | |
| 6 | |
| 6 |