
- SAP Community
- Products and Technology
- Technology
- Technology Blogs by Members
- HANA – analyzing runtime dumps
Technology Blogs by Members
Explore a vibrant mix of technical expertise, industry insights, and tech buzz in member blogs covering SAP products, technology, and events. Get in the mix!
Turn on suggestions
Auto-suggest helps you quickly narrow down your search results by suggesting possible matches as you type.
Showing results for
jgleichmann
Active Contributor
Options
- Subscribe to RSS Feed
- Mark as New
- Mark as Read
- Bookmark
- Subscribe
- Printer Friendly Page
- Report Inappropriate Content
12-30-2019
10:49 PM
The description runtime dump means not only when you trigger it manually or when a system crashes. There are multiple flavors which can be viewed in note 2400007.
In this blog I will explain with 2 examples (OOM dump and indexserver crash) which tools you can use to analyze them and what you have to watch out for.
– for details check How to generate a runtime dump -
There are different kinds of runtime dumps:
They are all created inside the trace directory of the systemdb (alias cdtrace) or tenant (cdtrace; cd DB_<tenant_SID>).
I think the most famous are the first two once. Every time a service is crashing or running out-of-memory (oom) such a runtime dump is written for further analysis. But if the system is in a tricky situation and you are finding the root cause or a solution not point in time, you will save the status of the threads and the system views for further analysis or another expert. Therefor you can trigger a dump manually:
With SPS4 and upwards:
If you have trouble with long running savepoints (check my blog for details):
If you want to display the values of the bind variables use:
Official sources:
2400007 - FAQ: SAP HANA Runtime Dumps
2498739 - How-To: Analyzing Runtime Dumps with SAP HANA Dump Analyzer
2491748 - How-To: Analyzing Runtime Dumps with SAP HANADumpViewer
Blog: Analyzing SAP HANA Runtime Dumps with SAP HANA dump analyzer
Blog: Changes for SAP HANA dump analyzer
There are currently 2 official tools you can use:
At first, we will throw some light on the difference of SAP HANA Dump Analyzer and SAP HANA Dump Viewer.
The HANA Dump Viewer is a python tool which is designed to be on the HANA server itself. Python is part of every HANA installation - nothing to install here besides the script.
The Dump Analyzer is a java tool which should be placed on your client. It is java so it is working on windows, MAC or Linux.
The HANA Dump Analyzer is the newer tool and has all features of the Viewer as GUI.
If you like the quick and dirty way and you may not have rights to run java then you should use the HANA Dump Viewer. In all other cases just use the Dump Analyzer because there are features like flame graphs, memory leak detection, auto analyzer etc. which will make your life easier if you are not familiar with runtime dumps.
Usage:

Example as sidadm
Such a *.dot file can be visualized with webgraphviz. Just paste the content of the *.dot file on the website.


In every dump there are also the extraction of the system views. You can copy them via editor and copy them to excel or you can do it the easy way with the HANADump viewer option “-mv”. This is valuable when the retention time of the systems views are over and the data were deleted.

In this mode the graph separates the normal and the exception threads:
Normal threads are shown in cyan colored boxes and have a thread id + thread type.
Exception threads are shown in orange colored boxes, their id is simply their order number in the .trc file and they have a reason for failure:
Normally there should be an exception thread and the identification is easy. But in our case there is no orange colored box:

So, one way is to go the old school (expert with experience) manual way:
Look into the dump via an editor 😉
Table of contents of an oom dump:
[BUILD] Build information
[STACK_SHORT] Short call stacks and pending exceptions of all threads
[PROCESS_INFO] Process Info
[THREADS] Running threads
[OS_MEMORY] Operating system information about memory
[MEMORY_OOM] Information about current out of memory situation
hdbcons “runtimedump l” for an overview of all sections

Have a look into the following areas (search for the terms) to get a quick overview:
[OS_MEMORY]
[MEMORY_OOM]
For details about the meminfo and the linux memory management check out my latest blog.
For details we can check the system for IPMM short info and search for the allocators, or we are using the dump analyzer for visualization.
Result of the analyses => have a look at the dump analyzer
HANA Dump analyzer (java)
You can find a current version of the SAP HANA dump analyzer here.
Usage:


Term clarification:
Heap Allocators (details) with the OOM Flame Graph (Expert Mode):
The following Memory FlameGraph shows the memory consumption distribution from HANA allocators. The wider box consumes more memory. Move the cursor onto the box to display the memory consumed by the allocator. Check for SAP Note 1999997 for allocator-specific recommendations
If you don’t know FlameGraph check out the usage at the website of Brendan Gregg.
You can search for terms in the right upper corner and you can zoom in with a left click and reset zoom with a right click.


Here we can see the mixed Flame Graph (expert mode: concurrency) for a detailed thread analyses which is not needed in this case.
Auto Crash Analysis with HANA Dump Analyzer


Have a look at the following areas to get a quick overview:
CRASH_SHORTINFO
CRASH_EXTINFO
CRASH_CONTEXT
CRASH_STACK
At the end every runtime dump looks different and have to analyzed on its own way, but the starting point is every time the same with every tool. The dump analyzer is a great tool for visualization and the first indicator for a root cause analyses.
What you should have learned:
Thanks to nina.li3 for this great tool. Check out her blogs for details about the features and further development.
In this blog I will explain with 2 examples (OOM dump and indexserver crash) which tools you can use to analyze them and what you have to watch out for.
- High level: creation of a runtime dump
- manual trigger
- Other configurable triggers
- Tools for an analysis (OOM example)
- HANA Dump Viewer
- HANA Dump Analyzer
- Old school way
- Indexserver Crash example
High level: creation of a runtime dump
– for details check How to generate a runtime dump -
There are different kinds of runtime dumps:
| Classic | *.rtedump.<timestamp>.trc |
| Memory | *.rtedump.<timestamp>.oom.trc |
| Index handle waits | *.indexhandle_blocked.trc |
| Slave indexserver start / stop: | * longrunning_start_stop.trc |
| Long running transaction commit / rollback / cancellation | *.longrunning_transaction.trc |
| Page corruption | *.rtedump.<timestamp>.page.trc |
| Savepoint | *.savepoint_blocked.trc |
| Log shipping timeout | *.secondaryReplayTimeout.trc |
| Table replication turned off | *.table_replication_turn_off.trc |
They are all created inside the trace directory of the systemdb (alias cdtrace) or tenant (cdtrace; cd DB_<tenant_SID>).
I think the most famous are the first two once. Every time a service is crashing or running out-of-memory (oom) such a runtime dump is written for further analysis. But if the system is in a tricky situation and you are finding the root cause or a solution not point in time, you will save the status of the threads and the system views for further analysis or another expert. Therefor you can trigger a dump manually:
- via command line: Python script
- via command line: hdbcons
- via SQL command
- hana cockpit: Collect and Download Diagnosis Information
Manual trigger
- Python script
- a FSD (FullSystemDump) only includes already existing RTE dumps => resulting in zip file
- Q13. How can runtime dumps be created as part of full system info dumps? - explains how you can trigger them together with a FSD
#As sidadm:

cdpy

python fullSystemInfoDump.py

python fullSystemInfoDump.py --rtedump --services=indexserver --sets=3 --interval=5
- hdbcons
#For Indexserver

hdbcons [-p <pid>] “runtimedump dump”


#for Nameserver:

hdbcons [-p <pid>] -e 'hdbnameserver' “runtimedump dump”- SQL
With SPS4 and upwards:
ALTER SYSTEM CREATE RUNTIMEDUMP [AT '<host>:<port>'] [SECTIONS <sections> | PROFILE <profile>] [INTO FILE <file>]Other configurable triggers
If you have trouble with long running savepoints (check my blog for details):
indexserver.ini -> [persistence] -> runtimedump_for_blocked_savepoint_timeout = <x> (unit seconds) If you want to display the values of the bind variables use:
indexserver.ini -> [sql] -> display_sql_statement_parameters_in_dump = trueOfficial sources:
2400007 - FAQ: SAP HANA Runtime Dumps
2498739 - How-To: Analyzing Runtime Dumps with SAP HANA Dump Analyzer
2491748 - How-To: Analyzing Runtime Dumps with SAP HANADumpViewer
Blog: Analyzing SAP HANA Runtime Dumps with SAP HANA dump analyzer
Blog: Changes for SAP HANA dump analyzer
Tools for an analysis (OOM example)
There are currently 2 official tools you can use:
- SAP HANA Dump Viewer
- SAP HANA Dump Analyzer
At first, we will throw some light on the difference of SAP HANA Dump Analyzer and SAP HANA Dump Viewer.
The HANA Dump Viewer is a python tool which is designed to be on the HANA server itself. Python is part of every HANA installation - nothing to install here besides the script.
The Dump Analyzer is a java tool which should be placed on your client. It is java so it is working on windows, MAC or Linux.
The HANA Dump Analyzer is the newer tool and has all features of the Viewer as GUI.
If you like the quick and dirty way and you may not have rights to run java then you should use the HANA Dump Viewer. In all other cases just use the Dump Analyzer because there are features like flame graphs, memory leak detection, auto analyzer etc. which will make your life easier if you are not familiar with runtime dumps.
SAP HANA Dump Viewer (python)
#change to the trace directory (systemDB / nameserver) as sidadm:

cdtrace

ls -lrt *rte*
sidadm@hostname:/usr/sap/SID/HDB00/vhostname/trace> ls -lrt *rte*
-rw-r--r-- 1 sidadm sapsys 1940488 Dec 20 02:40 nameserver_vhostname.30001.rtedump.20191220-024019.028599.oom.trc
-rw-r--r-- 1 sidadm sapsys 1931891 Dec 21 14:19 nameserver_vhostname.30001.rtedump.20191221-141934.028599.oom.trc
-rw-r--r-- 1 sidadm sapsys 1907141 Dec 22 14:26 nameserver_vhostname.30001.rtedump.20191222-142630.028599.oom.trc#change the directory to the tenant
cd DB_*
ls -lrt *rte*sidadm@hostname:/usr/sap/SID/HDB00/vhostname/trace/DB_TenaneSID> ls -lrt *rte*
-rw-r--r-- 1 sidadm sapsys 2431267 Dec 19 02:40 indexserver_vhostname.30040.rtedump.20191219-024019.065384.oom.trc
-rw-r--r-- 1 sidadm sapsys 2020932 Dec 20 02:40 indexserver_vhostname.30040.rtedump.20191220-024019.065384.oom.trc
-rw-r--r-- 1 sidadm sapsys 2134609 Dec 21 14:19 indexserver_vhostname.30040.rtedump.20191221-141934.065384.oom.trc
-rw-r--r-- 1 sidadm sapsys 2099624 Dec 22 14:26 indexserver_vhostname.30040.rtedump.20191222-142604.065384.oom.trc
-rw-r--r-- 1 sidadm sapsys 1883623 Dec 25 21:57 indexserver_vhostname.30040.rtedump.20191225-215711.065384.oom.trc
Usage:
- Download the script from github and read the pdf
- Create a file in a /tmp directory or for resident usage into the python path of the HANA DB (cdpy – check the correct rights for this)
- Run the script: python <scriptname.py> <options>
Example as sidadm
cdtrace; cd DB_*

python /usr/sap/SID/HDB00/exe/python_support/hanadumpviewer.py -df indexserver_hostname.30040.rtedump.20191225-215711.065384.oom.trc

File /tmp/hanadumpviewer_output/indexserver_hostname.30040.rtedump.20191225-215711.065384.oom.trc.dot was created
Such a *.dot file can be visualized with webgraphviz. Just paste the content of the *.dot file on the website.
In every dump there are also the extraction of the system views. You can copy them via editor and copy them to excel or you can do it the easy way with the HANADump viewer option “-mv”. This is valuable when the retention time of the systems views are over and the data were deleted.
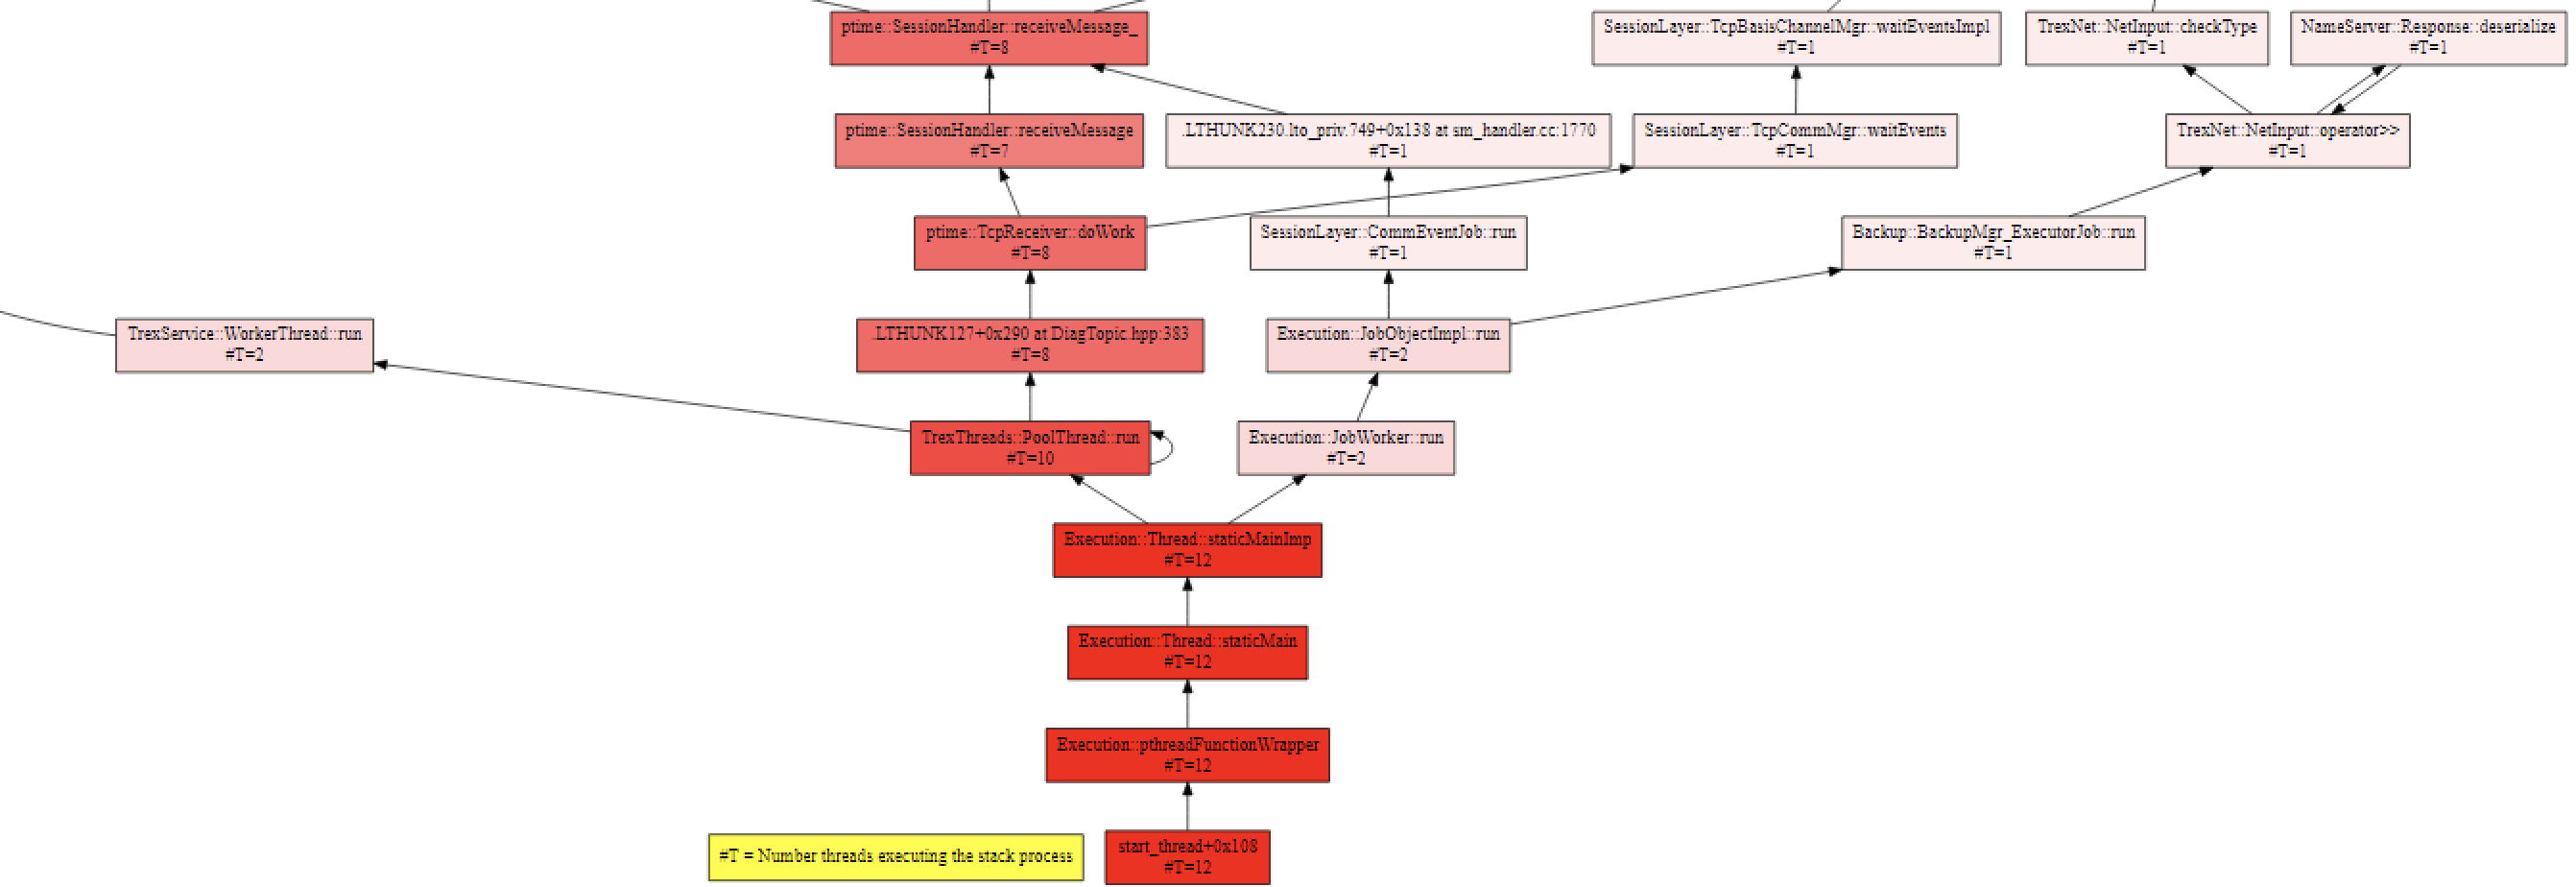
In this mode the graph separates the normal and the exception threads:
Normal threads are shown in cyan colored boxes and have a thread id + thread type.
python /usr/sap/SID/HDB00/exe/python_support/hanadumpviewer.py -df indexserver_hostname.30040.rtedump.20191225-215711.065384.oom.trc -pt true

File /tmp/hanadumpviewer_output/indexserver_hostname.30040.rtedump.20191225-215711.065384.oom.trc.dot was created
Exception threads are shown in orange colored boxes, their id is simply their order number in the .trc file and they have a reason for failure:
Normally there should be an exception thread and the identification is easy. But in our case there is no orange colored box:
So, one way is to go the old school (expert with experience) manual way:
Look into the dump via an editor 😉
Table of contents of an oom dump:
[BUILD] Build information
[STACK_SHORT] Short call stacks and pending exceptions of all threads
[PROCESS_INFO] Process Info
[THREADS] Running threads
[OS_MEMORY] Operating system information about memory
[MEMORY_OOM] Information about current out of memory situation
hdbcons “runtimedump l” for an overview of all sections
Have a look into the following areas (search for the terms) to get a quick overview:
[OS_MEMORY]
[MEMORY_OOM]
For details about the meminfo and the linux memory management check out my latest blog.
[OS_MEMORY]  Operating system information about memory: (2019-12-25 21:57:11 927 Local)

Maximum size of the process's virtual memory: soft limit=18446744073709551615, hard limit=18446744073709551615


/proc/meminfo:

MemTotal:       209519808 kB

MemFree:        44673280 kB

MemAvailable:   48709312 kB

Buffers:           19584 kB

Cached:         21846592 kB

SwapCached:        36992 kB

Active:         141622400 kB

Inactive:       17604096 kB

Active(anon):   137681920 kB

Inactive(anon): 16901312 kB

Active(file):    3940480 kB

Inactive(file):   702784 kB

Unevictable:      185216 kB

Mlocked:          185216 kB

SwapTotal:      12578688 kB

SwapFree:       11258048 kB

Dirty:              3904 kB

Writeback:             0 kB

AnonPages:      137531008 kB

Mapped:         17483392 kB

Shmem:          17191808 kB

Slab:            1387456 kB

SReclaimable:     698752 kB

SUnreclaim:       688704 kB

KernelStack:       26432 kB

PageTables:      1580224 kB
[MEMORY_OOM]  Information about current out of memory situation: (2019-12-25 21:57:11 929 Local)

OUT OF MEMORY occurred.

Host: hostname

Executable: hdbindexserver

PID: 65384

Failed to allocate 3gb (3221225472b).


Allocation failure type: PROCESS_ALLOCATION_LIMIT


Current callstack:

1: 0x00007fff75ef1fcc in MemoryManager::PoolAllocator::notifyOOM(unsigned long, bool) const+0xdc at PoolAllocator.cpp:2911 (libhdbbasis.so)

2: 0x00007fff75fefd20 in MemoryManager::PoolAllocator::oomHandling(unsigned long, unsigned long, unsigned long, bool)+0xf0 at PoolAllocator.cpp:1280 (libhdbbasis.so)

3: 0x00007fff75ef36e8 in MemoryManager::PoolAllocator::allocateNoThrowImpl(unsigned long, void const*)+0x248 at PoolAllocator.cpp:2507 (libhdbbasis.so)

4: 0x00007fff776f743c in ltt::allocator::allocate(unsigned long)+0x5c at memory.cpp:146 (libhdbdataaccess.so)

5: 0x00007fff7728faa8 in DataAccess::BackupChannel::BackupChannel(ltt::allocator&, ResourceManager::ResourceContainer&, DAEncryption::EncryptionManager const*, DataAccess::PersistenceManager&, ltt::smartptr_handle<Stream::ChannelCallback> const&, unsigned long, PageAccess::PageIO*, PageAccess::PhysPageNo const&, DAEncryption::InitializationVector const&, DataAccess::PersistentSpaceRestartData const&, PageAccess::Converter*, PageAccess::Converter*, PageAccess::Converter*, PageAccess::Converter*, unsigned long const&, unsigned long const&, bool, bool, unsigned long&)+0x15b8 at releasable_handle.hpp:449 (libhdbdataaccess.so)

6: 0x00007fff7736a918 in DataAccess::PersistentSpaceImpl::openBackupChannel(ltt::allocator&, PageAccess::PhysPageNo const&, DAEncryption::InitializationVector const&, DataAccess::PersistentSpaceRestartData const&, ltt::smartptr_handle<Stream::ChannelCallback>, unsigned long, unsigned long const&, unsigned long const&, bool, bool, unsigned long&)+0x108 at PersistentSpaceImpl.cpp:2653 (libhdbdataaccess.so)

7: 0x00007fff772d39f4 in DataAccess::PersistenceManagerImpl::BackupHandlerImpl::triggerBackup(ltt::smartptr_handle<Stream::ChannelCallback> const&, unsigned long, unsigned long&)+0x184 at releasable_handle.hpp:463 (libhdbdataaccess.so)

8: 0x00007fff772d3e90 in DataAccess::DataBackupHandler::triggerBackup(ltt::smartptr_handle<Stream::ChannelCallback> const&, unsigned long, unsigned long&)+0x20 at BackupInfoRestartData.hpp:43 (libhdbdataaccess.so)

9: 0x00007fff8adfcd58 in Backup::BackupSrc_CommonSnapshot::prepareBackupOperation()+0x1f8 at TraceEntryExit.hpp:103 (libhdbbackup.so)

10: 0x00007fff8ad79a34 in Backup::BackupExe_SimpleExecutor::globalSavepoint(ltt::list<ltt::smartptr_handle<Backup::BackupSrc_Source> >&, unsigned long&, unsigned long&, ltt::guid&, unsigned long&)+0x154 at BackupExe_SimpleExecutor.cpp:261 (libhdbbackup.so)

11: 0x00007fff8ad2c9f4 in Backup::BackupExe_RequestHandler::globalSavePoint(Backup::BackupExe_Request&, Backup::BackupExe_Response&)+0x254 at BackupExe_RequestHandler.cpp:534 (libhdbbackup.so)

12: 0x00007fff8ad2d58c in Backup::BackupExe_RequestHandler::handleRequest(Backup::BackupExe_Request&, Backup::BackupExe_Response&, Backup::BackupCbc_Federation*, Backup::RecoverCbc_Federation*)+0x1ec at BackupExe_RequestHandler.cpp:420 (libhdbbackup.so)

13: 0x00007fff8adb3b40 in Backup::Backup_ExecutorHandler::handleRequest(TrexNet::Request&, Backup::BackupCbc_Federation*)+0xe0 at Backup_RecoverHandler.cpp:191 (libhdbbackup.so)
- This means the first 4 Callstacks coming from the allocation, means from the oom, itself
- The following once are showing us that a backup was executed
- Global savepoint was executed and a snapshot (yes, a HANA backup based on a kind of snapshot) was created
- This crashed the server because no more memory was available at this point in time
- Next step: we have to check all other allocators and the complete sizing of the server
For details we can check the system for IPMM short info and search for the allocators, or we are using the dump analyzer for visualization.
IPMM short info:


GLOBAL_ALLOCATION_LIMIT (GAL) = 189.39gb (203360829440b), SHARED_MEMORY = 15.79gb (16958947328b), CODE_SIZE = 1.99gb (2140995584b), OOM_RESERVATION_ALLOCATOR_SIZE = 96.18mb (100859904b)


PID=57454 (hdbcompileserver), PAL=119.47gb (128290521088b), AB=1.27gb (1367474176b), UA=0, U=192.34mb (201686714b), FSL=0b, FMC=0b, Blocked=979.75mb (1027342336b)

PID=57456 (hdbpreprocessor), PAL=119.47gb (128290521088b), AB=1.25gb (1346764800b), UA=0, U=171.11mb (179424071b), FSL=0b, FMC=0b

PID=65384 (hdbindexserver), PAL=119.47gb (128290521088b), AB=119.47gb (128290521088b), UA=0, U=99.17gb (106492272674b), FSL=0b, FMC=0b

PID=57820 (hdbwebdispatcher), PAL=119.47gb (128290521088b), AB=1.47gb (1581187072b), UA=0, U=392.86mb (411946659b), FSL=0b, FMC=0b

PID=28599 (hdbnameserver), PAL=119.47gb (128290521088b), AB=11.15gb (11974541312b), UA=0, U=3.51gb (3774016214b), FSL=160mb (167772160b), FMC=4gb (4306436096b)


Total allocated memory= 152.41gb (163660431360b)

Total used memory     = 121.21gb (130159289244b)

Sum AB                = 144560488448

Sum Used              = 111059346332

Heap memory fragmentation: 20% (this value may be high if defragmentation does not help solving the current memory request)
Top "M_HEAP_MEMORY" allocators (component, name, size). Ordered descending by inclusive_size_in_use.
1: System: / 99.17gb (106492272674b)
2: System: Pool 94.36gb (101319674758b)
3: Monitoring & Statistical Data: Pool/Statistics 25.22gb (27083137056b)
4: System: Pool/RowEngine 24.74gb (26567735344b)
5: System: Pool/PersistenceManager 20.33gb (21839976360b)
6: System: Pool/RowEngine/QueryExecution 11.04gb (11858086600b)
7: System: Pool/RowEngine/QueryExecution/SearchAlloc 10.97gb (11788559016b)
8: System: Pool/ResourceContainer 8.75gb (9406436776b)
9: System: Pool/PersistenceManager/ContainerFileIDMapping 8.02gb (8614085728b)
10: System: Pool/PersistenceManager/VirtualFile entry TID map 6.76gb (7268271488b)
11: Row Store Tables: Pool/RowStoreTables 6.17gb (6628813168b)
12: Row Store Tables: Pool/RowStoreTables/CpbTree 6.07gb (6525295232b)
13: System: Pool/RowEngine/Session 4.92gb (5291610176b)
14: System: AllocateOnlyAllocator-unlimited 4.36gb (4689452952b)
15: Caches: Pool/RowEngine/SQLPlan 4.13gb (4445782520b)
16: System: AllocateOnlyAllocator-unlimited/FLA-UL<24592,1>/MemoryMapLevel3Nodes 3.99gb (4288820208b)
17: System: AllocateOnlyAllocator-unlimited/FLA-UL<24592,1> 3.99gb (4288820208b)
18: System: Pool/PersistenceManager/PersistentSpace 3.63gb (3905547760b)
19: System: Pool/ResourceContainer/ResourceHeader 3.47gb (3734215968b)
20: Statement Execution & Intermediate Results: Pool/Contexts 3.22gb (3463665264b)Result of the analyses => have a look at the dump analyzer
HANA Dump analyzer (java)
You can find a current version of the SAP HANA dump analyzer here.
Usage:
- Update your JDK (at least JDK 8.0 is required)
- Download HANADumpAnalyzer
- Double click on HANADumpAnalyzer.jar
- Read the PDF
- Self-explainable GUI
Source: SCN_Doc_Automatically_Analyze_HANA_Issues_with_SAP_HANA_dump_analyzer.pdf
- You can see that the hdbindexserver PAL (=Process Allocation Limit) is at 119,47GB
- The AB (Allocated Bytes) is also at 119,47GB
- So there is a bottleneck at the PAL or one of its heap allocators
Term clarification:
| SId | Process secondary identifier |
| AB | Allocated bytes by allocators for heap and stacks (inclusive allocator cache) |
| UA | Unaccounted memory (by unlimited allocators for exceptions etc.), maybe overcommit |
| U | Used bytes for heap and stacks (without allocator cache) |
| FSL | Free segment list size |
| FMC | Free precharge memory cache size |
| SMAS/SMDS | System memory traffic information (accumulation of allocations/deallocations) |
| PAL | Process allocation limit |
| TPAL | Temp process allocation limit |
| Blocked | Memory (TPAL!) blocked/reserved for this process |
| W | Weight of process |
Heap Allocators (details) with the OOM Flame Graph (Expert Mode):
Memory Allocator FlameGraph
The following Memory FlameGraph shows the memory consumption distribution from HANA allocators. The wider box consumes more memory. Move the cursor onto the box to display the memory consumed by the allocator. Check for SAP Note 1999997 for allocator-specific recommendations
If you don’t know FlameGraph check out the usage at the website of Brendan Gregg.
You can search for terms in the right upper corner and you can zoom in with a left click and reset zoom with a right click.
- You may have noticed that the pool allocator with nearly 100% has only 96GB
- Our PAL is at 119GB
- There is heap fragmentation which is explained at the IPMM report on the last line:
- "Heap memory fragmentation: 20% (this value may be high if defragmentation does not help solving the current memory request)"
- Our Backup request reached the limit with only 1,6GB more memory allocation
- This the reason for the oom as result of to less memory left but not the root cause
- Also all other allocators are not as big as we could identify a bottleneck
- Solution: extend the PAL because we have some memory left till we hit the GAL
Here we can see the mixed Flame Graph (expert mode: concurrency) for a detailed thread analyses which is not needed in this case.
Index Server Crash example
Auto Crash Analysis with HANA Dump Analyzer
- Check the first stack call (0) for known issues in SMP
- If your issue is not under the search results use call stack 1 or 2 to expand the search
Mixed Flame Graph
- Use the search in the upper right corner and search for the term which we have seen in our stacktrace (see above): AttributeEngine::BTreeAttribute<TrexTypes::RawAttributeValue>::jeUpdateValidMapping
- 7 threads are using this call stack
- There is a very inaccurate note for this issue
- “Due to a programming error in SAP HANA, indexserver may crash caused by a rare race condition between reading and writing the dictionary of a column store table.”
The manual way
Have a look at the following areas to get a quick overview:
CRASH_SHORTINFO
CRASH_EXTINFO
CRASH_CONTEXT
CRASH_STACK
[CRASH_STACK]  Stacktrace of crash: (2019-11-12 22:26:57 779 Local)

----> Symbolic stack backtrace <----

  0: AttributeEngine::BTreeAttribute<TrexTypes::RawAttributeValue>::jeUpdateValidMapping(ltt_adp::vector<AttributeEngine::AttributeValueContainer*, ltt::integral_constant<bool, true> >&, int) + 0x528

         Symbol: _ZN15AttributeEngine14BTreeAttributeIN9TrexTypes17RawAttributeValueEE20jeUpdateValidMappingERN7ltt_adp6vectorIPNS_23AttributeValueContainerEN3ltt17integral_constantIbLb1EEEEEi

         SFrame: IP: 0x00007fff9df357e8 (0x00007fff9df352c0+0x528) FP: 0x00007ffeec2316b0 SP: 0x00007ffeec2214f0 RP: 0x00007fff9c532bf4

         Params: 0x1ffb2df200000, 0x2f30a, 0x0, 0x7fff9995386c, 0x2b0000002b, 0x0, 0x1ec2a5313e160021, 0x1ec2a5313e1600

         Regs: gpr00=0x7fff9df35734, gpr02/toc=0x7fffa031bc00, gpr03/arg1/ret=0x1ffb2df200000, gpr04/arg2=0x2f30a, gpr05/arg3=0x0, gpr06/arg4=0x7fff9995386c, gpr07/arg5=0x2b0000002b, gpr08/arg6=0x0, gpr09/arg7=0x1ec2a5313e160021, gpr10/arg9=0x1ec2a5313e1600

         Source: AttributeStatistics.hpp:32

         Module: /usr/sap/SID/HDB00/exe/libhdbcs.so

     -----------------------------------------

  1: AttributeEngine::AttributeApi::jeOpenAttributeUpdateValidMapping(AttributeEngine::AttributeStoreHandle*, AttributeEngine::AttributeValueContainerHandle*, AttributeEngine::LazyMode, int) + 0x444

         Symbol: _ZN15AttributeEngine12AttributeApi33jeOpenAttributeUpdateValidMappingEPNS_20AttributeStoreHandleEPNS_29AttributeValueContainerHandleENS_8LazyModeEi

         SFrame: IP: 0x00007fff9c532bf4 (0x00007fff9c5327b0+0x444) FP: 0x00007ffeec2319c0 SP: 0x00007ffeec2316b0 RP: 0x00007fff9c533144

         Source: AttributeApi.h:151

         Module: /usr/sap/SID/HDB00/exe/libhdbcs.so

     -----------------------------------------

  2: AttributeEngine::AttributeApi::jeReadIndex(TRexUtils::IndexVectorAligned const&, TRexUtils::BitVector const*, ltt::vector<int> const*, bool, long, TRexUtils::IndexVectorAligned&, TRexUtils::IndexVectorAligned&, AttributeEngine::QueryStats&) + 0xb4

         Symbol: _ZN15AttributeEngine12AttributeApi11jeReadIndexERKN9TRexUtils18IndexVectorAlignedEPKNS1_9BitVectorEPKN3ltt6vectorIiEEblRS2_SD_RNS_10QueryStatsE

         SFrame: IP: 0x00007fff9c533144 (0x00007fff9c533090+0xb4) FP: 0x00007ffeec231af0 SP: 0x00007ffeec2319c0 RP: 0x00007fff8b82aec8

         Source: AttributeApi.h:187

         Module: /usr/sap/SID/HDB00/exe/libhdbcs.so
Summary
At the end every runtime dump looks different and have to analyzed on its own way, but the starting point is every time the same with every tool. The dump analyzer is a great tool for visualization and the first indicator for a root cause analyses.
What you should have learned:
- the difference between HANA Dump Viewer and Analyzer
- how to create a runtime dump manually and via trigger
- how to create and analyze a mixed flame graph
Thanks to nina.li3 for this great tool. Check out her blogs for details about the features and further development.
- SAP Managed Tags:
- Red Hat Enterprise Linux,
- SUSE Linux Enterprise Server,
- SAP HANA,
- SAP HANA, platform edition
3 Comments
You must be a registered user to add a comment. If you've already registered, sign in. Otherwise, register and sign in.
Labels in this area
-
"automatische backups"
1 -
"regelmäßige sicherung"
1 -
505 Technology Updates 53
1 -
ABAP
14 -
ABAP API
1 -
ABAP CDS Views
2 -
ABAP CDS Views - BW Extraction
1 -
ABAP CDS Views - CDC (Change Data Capture)
1 -
ABAP class
2 -
ABAP Cloud
2 -
ABAP Development
5 -
ABAP in Eclipse
1 -
ABAP Platform Trial
1 -
ABAP Programming
2 -
abap technical
1 -
absl
1 -
access data from SAP Datasphere directly from Snowflake
1 -
Access data from SAP datasphere to Qliksense
1 -
Accrual
1 -
action
1 -
adapter modules
1 -
Addon
1 -
Adobe Document Services
1 -
ADS
1 -
ADS Config
1 -
ADS with ABAP
1 -
ADS with Java
1 -
ADT
2 -
Advance Shipping and Receiving
1 -
Advanced Event Mesh
3 -
AEM
1 -
AI
7 -
AI Launchpad
1 -
AI Projects
1 -
AIML
9 -
Alert in Sap analytical cloud
1 -
Amazon S3
1 -
Analytical Dataset
1 -
Analytical Model
1 -
Analytics
1 -
Analyze Workload Data
1 -
annotations
1 -
API
1 -
API and Integration
3 -
API Call
2 -
Application Architecture
1 -
Application Development
5 -
Application Development for SAP HANA Cloud
3 -
Applications and Business Processes (AP)
1 -
Artificial Intelligence
1 -
Artificial Intelligence (AI)
4 -
Artificial Intelligence (AI) 1 Business Trends 363 Business Trends 8 Digital Transformation with Cloud ERP (DT) 1 Event Information 462 Event Information 15 Expert Insights 114 Expert Insights 76 Life at SAP 418 Life at SAP 1 Product Updates 4
1 -
Artificial Intelligence (AI) blockchain Data & Analytics
1 -
Artificial Intelligence (AI) blockchain Data & Analytics Intelligent Enterprise
1 -
Artificial Intelligence (AI) blockchain Data & Analytics Intelligent Enterprise Oil Gas IoT Exploration Production
1 -
Artificial Intelligence (AI) blockchain Data & Analytics Intelligent Enterprise sustainability responsibility esg social compliance cybersecurity risk
1 -
ASE
1 -
ASR
2 -
ASUG
1 -
Attachments
1 -
Authorisations
1 -
Automating Processes
1 -
Automation
1 -
aws
2 -
Azure
1 -
Azure AI Studio
1 -
B2B Integration
1 -
Backorder Processing
1 -
Backup
1 -
Backup and Recovery
1 -
Backup schedule
1 -
BADI_MATERIAL_CHECK error message
1 -
Bank
1 -
BAS
1 -
basis
2 -
Basis Monitoring & Tcodes with Key notes
2 -
Batch Management
1 -
BDC
1 -
Best Practice
1 -
bitcoin
1 -
Blockchain
3 -
BOP in aATP
1 -
BOP Segments
1 -
BOP Strategies
1 -
BOP Variant
1 -
BPC
1 -
BPC LIVE
1 -
BTP
11 -
BTP Destination
2 -
Business AI
1 -
Business and IT Integration
1 -
Business application stu
1 -
Business Architecture
1 -
Business Communication Services
1 -
Business Continuity
1 -
Business Data Fabric
3 -
Business Partner
12 -
Business Partner Master Data
10 -
Business Technology Platform
2 -
Business Trends
1 -
CA
1 -
calculation view
1 -
CAP
3 -
Capgemini
1 -
CAPM
1 -
Catalyst for Efficiency: Revolutionizing SAP Integration Suite with Artificial Intelligence (AI) and
1 -
CCMS
2 -
CDQ
12 -
CDS
2 -
Cental Finance
1 -
Certificates
1 -
CFL
1 -
Change Management
1 -
chatbot
1 -
chatgpt
3 -
CL_SALV_TABLE
2 -
Class Runner
1 -
Classrunner
1 -
Cloud ALM Monitoring
1 -
Cloud ALM Operations
1 -
cloud connector
1 -
Cloud Extensibility
1 -
Cloud Foundry
3 -
Cloud Integration
6 -
Cloud Platform Integration
2 -
cloudalm
1 -
communication
1 -
Compensation Information Management
1 -
Compensation Management
1 -
Compliance
1 -
Compound Employee API
1 -
Configuration
1 -
Connectors
1 -
Consolidation Extension for SAP Analytics Cloud
1 -
Controller-Service-Repository pattern
1 -
Conversion
1 -
Cosine similarity
1 -
cryptocurrency
1 -
CSI
1 -
ctms
1 -
Custom chatbot
3 -
Custom Destination Service
1 -
custom fields
1 -
Customer Experience
1 -
Customer Journey
1 -
Customizing
1 -
Cyber Security
2 -
Data
1 -
Data & Analytics
1 -
Data Aging
1 -
Data Analytics
2 -
Data and Analytics (DA)
1 -
Data Archiving
1 -
Data Back-up
1 -
Data Governance
5 -
Data Integration
2 -
Data Quality
12 -
Data Quality Management
12 -
Data Synchronization
1 -
data transfer
1 -
Data Unleashed
1 -
Data Value
8 -
database tables
1 -
Datasphere
2 -
datenbanksicherung
1 -
dba cockpit
1 -
dbacockpit
1 -
Debugging
2 -
Delimiting Pay Components
1 -
Delta Integrations
1 -
Destination
3 -
Destination Service
1 -
Developer extensibility
1 -
Developing with SAP Integration Suite
1 -
Devops
1 -
digital transformation
1 -
Documentation
1 -
Dot Product
1 -
DQM
1 -
dump database
1 -
dump transaction
1 -
e-Invoice
1 -
E4H Conversion
1 -
Eclipse ADT ABAP Development Tools
2 -
edoc
1 -
edocument
1 -
ELA
1 -
Embedded Consolidation
1 -
Embedding
1 -
Embeddings
1 -
Employee Central
1 -
Employee Central Payroll
1 -
Employee Central Time Off
1 -
Employee Information
1 -
Employee Rehires
1 -
Enable Now
1 -
Enable now manager
1 -
endpoint
1 -
Enhancement Request
1 -
Enterprise Architecture
1 -
ETL Business Analytics with SAP Signavio
1 -
Euclidean distance
1 -
Event Dates
1 -
Event Driven Architecture
1 -
Event Mesh
2 -
Event Reason
1 -
EventBasedIntegration
1 -
EWM
1 -
EWM Outbound configuration
1 -
EWM-TM-Integration
1 -
Existing Event Changes
1 -
Expand
1 -
Expert
2 -
Expert Insights
1 -
Fiori
14 -
Fiori Elements
2 -
Fiori SAPUI5
12 -
Flask
1 -
Full Stack
8 -
Funds Management
1 -
General
1 -
Generative AI
1 -
Getting Started
1 -
GitHub
8 -
Grants Management
1 -
groovy
1 -
GTP
1 -
HANA
5 -
HANA Cloud
2 -
Hana Cloud Database Integration
2 -
HANA DB
1 -
HANA XS Advanced
1 -
Historical Events
1 -
home labs
1 -
HowTo
1 -
HR Data Management
1 -
html5
8 -
Identity cards validation
1 -
idm
1 -
Implementation
1 -
input parameter
1 -
instant payments
1 -
Integration
3 -
Integration Advisor
1 -
Integration Architecture
1 -
Integration Center
1 -
Integration Suite
1 -
intelligent enterprise
1 -
Java
1 -
job
1 -
Job Information Changes
1 -
Job-Related Events
1 -
Job_Event_Information
1 -
joule
4 -
Journal Entries
1 -
Just Ask
1 -
Kerberos for ABAP
8 -
Kerberos for JAVA
8 -
Launch Wizard
1 -
Learning Content
2 -
Life at SAP
1 -
lightning
1 -
Linear Regression SAP HANA Cloud
1 -
local tax regulations
1 -
LP
1 -
Machine Learning
2 -
Marketing
1 -
Master Data
3 -
Master Data Management
14 -
Maxdb
2 -
MDG
1 -
MDGM
1 -
MDM
1 -
Message box.
1 -
Messages on RF Device
1 -
Microservices Architecture
1 -
Microsoft Universal Print
1 -
Middleware Solutions
1 -
Migration
5 -
ML Model Development
1 -
Modeling in SAP HANA Cloud
8 -
Monitoring
3 -
MTA
1 -
Multi-Record Scenarios
1 -
Multiple Event Triggers
1 -
Neo
1 -
New Event Creation
1 -
New Feature
1 -
Newcomer
1 -
NodeJS
2 -
ODATA
2 -
OData APIs
1 -
odatav2
1 -
ODATAV4
1 -
ODBC
1 -
ODBC Connection
1 -
Onpremise
1 -
open source
2 -
OpenAI API
1 -
Oracle
1 -
PaPM
1 -
PaPM Dynamic Data Copy through Writer function
1 -
PaPM Remote Call
1 -
PAS-C01
1 -
Pay Component Management
1 -
PGP
1 -
Pickle
1 -
PLANNING ARCHITECTURE
1 -
Popup in Sap analytical cloud
1 -
PostgrSQL
1 -
POSTMAN
1 -
Process Automation
2 -
Product Updates
4 -
PSM
1 -
Public Cloud
1 -
Python
4 -
Qlik
1 -
Qualtrics
1 -
RAP
3 -
RAP BO
2 -
Record Deletion
1 -
Recovery
1 -
recurring payments
1 -
redeply
1 -
Release
1 -
Remote Consumption Model
1 -
Replication Flows
1 -
Research
1 -
Resilience
1 -
REST
1 -
REST API
1 -
Retagging Required
1 -
Risk
1 -
Rolling Kernel Switch
1 -
route
1 -
rules
1 -
S4 HANA
1 -
S4 HANA Cloud
1 -
S4 HANA On-Premise
1 -
S4HANA
3 -
S4HANA_OP_2023
2 -
SAC
10 -
SAC PLANNING
9 -
SAP
4 -
SAP ABAP
1 -
SAP Advanced Event Mesh
1 -
SAP AI Core
8 -
SAP AI Launchpad
8 -
SAP Analytic Cloud Compass
1 -
Sap Analytical Cloud
1 -
SAP Analytics Cloud
4 -
SAP Analytics Cloud for Consolidation
2 -
SAP Analytics Cloud Story
1 -
SAP analytics clouds
1 -
SAP BAS
1 -
SAP Basis
6 -
SAP BODS
1 -
SAP BODS certification.
1 -
SAP BTP
20 -
SAP BTP Build Work Zone
2 -
SAP BTP Cloud Foundry
5 -
SAP BTP Costing
1 -
SAP BTP CTMS
1 -
SAP BTP Innovation
1 -
SAP BTP Migration Tool
1 -
SAP BTP SDK IOS
1 -
SAP Build
11 -
SAP Build App
1 -
SAP Build apps
1 -
SAP Build CodeJam
1 -
SAP Build Process Automation
3 -
SAP Build work zone
10 -
SAP Business Objects Platform
1 -
SAP Business Technology
2 -
SAP Business Technology Platform (XP)
1 -
sap bw
1 -
SAP CAP
2 -
SAP CDC
1 -
SAP CDP
1 -
SAP Certification
1 -
SAP Cloud ALM
4 -
SAP Cloud Application Programming Model
1 -
SAP Cloud Integration for Data Services
1 -
SAP cloud platform
8 -
SAP Companion
1 -
SAP CPI
3 -
SAP CPI (Cloud Platform Integration)
2 -
SAP CPI Discover tab
1 -
sap credential store
1 -
SAP Customer Data Cloud
1 -
SAP Customer Data Platform
1 -
SAP Data Intelligence
1 -
SAP Data Migration in Retail Industry
1 -
SAP Data Services
1 -
SAP DATABASE
1 -
SAP Dataspher to Non SAP BI tools
1 -
SAP Datasphere
9 -
SAP DRC
1 -
SAP EWM
1 -
SAP Fiori
2 -
SAP Fiori App Embedding
1 -
Sap Fiori Extension Project Using BAS
1 -
SAP GRC
1 -
SAP HANA
1 -
SAP HCM (Human Capital Management)
1 -
SAP HR Solutions
1 -
SAP IDM
1 -
SAP Integration Suite
9 -
SAP Integrations
4 -
SAP iRPA
2 -
SAP Learning Class
1 -
SAP Learning Hub
1 -
SAP Odata
2 -
SAP on Azure
1 -
SAP PartnerEdge
1 -
sap partners
1 -
SAP Password Reset
1 -
SAP PO Migration
1 -
SAP Prepackaged Content
1 -
SAP Process Automation
2 -
SAP Process Integration
2 -
SAP Process Orchestration
1 -
SAP S4HANA
2 -
SAP S4HANA Cloud
1 -
SAP S4HANA Cloud for Finance
1 -
SAP S4HANA Cloud private edition
1 -
SAP Sandbox
1 -
SAP STMS
1 -
SAP SuccessFactors
2 -
SAP SuccessFactors HXM Core
1 -
SAP Time
1 -
SAP TM
2 -
SAP Trading Partner Management
1 -
SAP UI5
1 -
SAP Upgrade
1 -
SAP-GUI
8 -
SAP_COM_0276
1 -
SAPBTP
1 -
SAPCPI
1 -
SAPEWM
1 -
sapmentors
1 -
saponaws
2 -
SAPUI5
4 -
schedule
1 -
Secure Login Client Setup
8 -
security
9 -
Selenium Testing
1 -
SEN
1 -
SEN Manager
1 -
service
1 -
SET_CELL_TYPE
1 -
SET_CELL_TYPE_COLUMN
1 -
SFTP scenario
2 -
Simplex
1 -
Single Sign On
8 -
Singlesource
1 -
SKLearn
1 -
soap
1 -
Software Development
1 -
SOLMAN
1 -
solman 7.2
2 -
Solution Manager
3 -
sp_dumpdb
1 -
sp_dumptrans
1 -
SQL
1 -
sql script
1 -
SSL
8 -
SSO
8 -
Substring function
1 -
SuccessFactors
1 -
SuccessFactors Time Tracking
1 -
Sybase
1 -
system copy method
1 -
System owner
1 -
Table splitting
1 -
Tax Integration
1 -
Technical article
1 -
Technical articles
1 -
Technology Updates
1 -
Technology Updates
1 -
Technology_Updates
1 -
Threats
1 -
Time Collectors
1 -
Time Off
2 -
Tips and tricks
2 -
Tools
1 -
Trainings & Certifications
1 -
Transport in SAP BODS
1 -
Transport Management
1 -
TypeScript
2 -
unbind
1 -
Unified Customer Profile
1 -
UPB
1 -
Use of Parameters for Data Copy in PaPM
1 -
User Unlock
1 -
VA02
1 -
Validations
1 -
Vector Database
1 -
Vector Engine
1 -
Visual Studio Code
1 -
VSCode
1 -
Web SDK
1 -
work zone
1 -
workload
1 -
xsa
1 -
XSA Refresh
1
- « Previous
- Next »
Related Content
- AutoGen with SAP AI Core in Technology Blogs by SAP
- Workload Analysis for HANA Platform Series - 3. Identify the Memory Consumption in Technology Blogs by SAP
- Taking huge heap memory by SAP JCO library in Technology Q&A
- Augmenting SAP BTP Use Cases with AI Foundation: A Deep Dive into the Generative AI Hub in Technology Blogs by SAP
- Automatic Service Order creation with SAP Build Process Automation and Generative AI in Technology Blogs by SAP
Top kudoed authors
| User | Count |
|---|---|
| 11 | |
| 9 | |
| 7 | |
| 6 | |
| 4 | |
| 4 | |
| 3 | |
| 3 | |
| 3 | |
| 3 |