Introduction
SAP HANA Cockpit Workload Analysis APP is a very useful tool to analyze SAP HANA DB workload. By default, it utilizes the thread samples automatically collected with 10 seconds interval. On the other hand, Workload Analysis APP could also analyze workload collected by Capture APP. This post introduces an example to analyze the captured workload using Workload Analysis APP.
Capture Workload
Launch Capture App

Start Capture with Analysis Mode
To use the capture file for workload analysis, we should select "Analysis" in Usages section.
Monitoring the Ongoing Capture
Monitoring in the System Overview page
Monitoring in the Capture Management page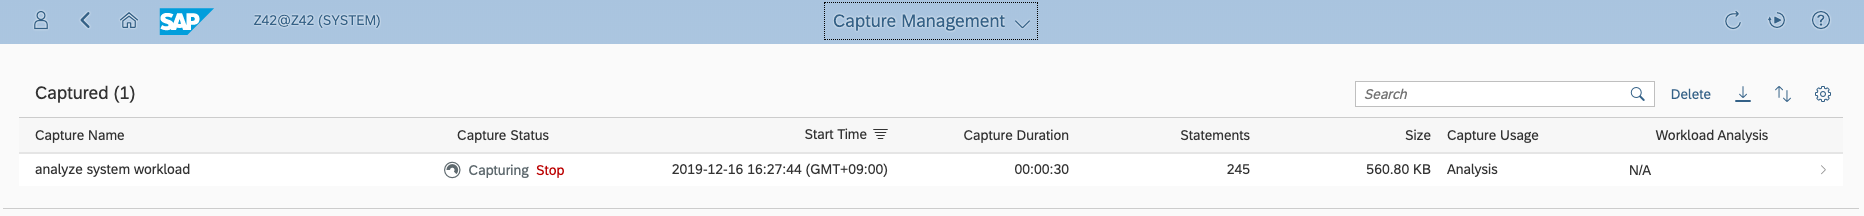
Monitoring in the Capture Monitor page
Finish Capture
Load Captured Workload
To start the captured workload analysis, first step is loading capture file to Workload Analysis APP.

After loading, captured workload could be visualized in the Workload Analysis APP.
Analyze Captured Workload
On the chart, KPIs and time range could be selected.
Below the chart, Capture Information tab, Top SQL Statements tab and Timeline tab are available to analyze the captured workload.
Capture Information tab
Summary of Selected Area
This section provides selected duration, collected statements during the time period, failed statements count and executed transactions information.
Capture Overview
This section provides the statistics of the captured workload.
General Information
This section provides captured workload general information, such as captured time period, capture file name, database name.
Filter Options
This section provides filter options set during the capture. Possible filters are application name, database user name, client name and application user name.
Capture Configuration
Three options are available when start the capture. Collect explain plan, collect workload details(selected by default when capture in analysis mode) and collect parameter values.
System Information
This section provides database information, operating system information and hardware information.
Top SQL Statements tab
This tab provides top SQL statements with selected dimension. It's very helpful to find out the heavy query during the selected capture time range. The dimension could be set as SQL Elapsed Time, SQL CPU Time, SQL Memory Used and so on.
Long running query
SQL Elapsed Time dimension could be used to find out long running query
High CPU usage query
SQL CPU Time dimension could be used to find out high CPU usage query
High memory usage query
SQL Memory Used dimension could be used to find out high memory usage query
Timeline tab
This tab is mapping top 100 queries(order by elapsed time) with a timeline chart. The top 100 queries related KPIs(Statement String, Elapsed Time, CPU Time, Memory Used) are also visualized as a table format.
Timeline chart
Timeline chart is grouping by application name. Each query statement hash under the application name represents one line in the chart. We could find out when the query is starts and when it finishes. When click on the chart, it's mapping to the query in the statements table.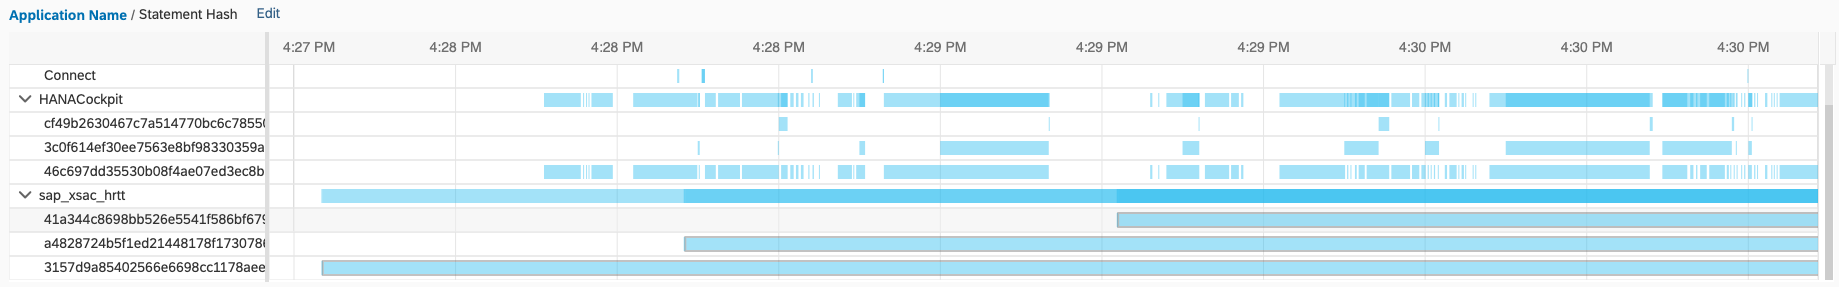
Statements table
Elapsed time, CPU time, memory used, application name, application user name, statement hash, statement string, accessed tables could be checked in the table.
Conclusion
If certain workload needs to be analyzed, combine the Capture APP and Workload Analysis APP is a recommended approach.
