
- SAP Community
- Products and Technology
- Enterprise Resource Planning
- ERP Blogs by Members
- Part#11.End to End Data Modeling and Reporting wit...
Enterprise Resource Planning Blogs by Members
Gain new perspectives and knowledge about enterprise resource planning in blog posts from community members. Share your own comments and ERP insights today!
Turn on suggestions
Auto-suggest helps you quickly narrow down your search results by suggesting possible matches as you type.
Showing results for
kumarsanjeev
Explorer
Options
- Subscribe to RSS Feed
- Mark as New
- Mark as Read
- Bookmark
- Subscribe
- Printer Friendly Page
- Report Inappropriate Content
11-05-2019
7:57 AM
Let’s create a very simple data model on SAP’s demo data with FLIGHT module, just to showcase how an end to end business scenarios might look like. To create any analytics data model we need DIMENSION Data which are the Master Data sets and FACT data which is a Transaction Data Set. Below are the related tables, 3 Dimension/Master tables and 1 Fact table.
Dimension Tables:
Fact Table:
NOTE: For Time Dimension we can use SAP standard Basic Interface view I_CalendarDate and for Country and Country text we can use I_Country.
CDS View:

Note these annotations;
@VDM:{viewType: #BASIC} : As already mentioned, this annotation tells that this is a Basic Interface view which delivers Master Data - Airline Information in this scenario.
@Semantics.currencyCode: true - This annotation tells system that field ‘currcode’ is treated as Currency field.
@analytics: dataCategory: #DIMENSION - shows this is Dimension data.
Output:

2. Create second view for Connection information: ZCDS_VIEW_CONN

Note: Check the keyword $Projection. Instead of source table name or alias, we can use $Projection as well which will take care of Association. The thing to note is with $Project, you can only use the fields which you have listed in the CDS view i.e. if the table has 20 fields but in your CDS view you want only 5 fields and you have listed them in the view, you can use only one of these 5 fields with $Projection. You are free to use table name or alias, this is just what SAP is using for standard views and comes under best practices.
Output: check the output and association;


3. Create a view for Customer information : ZCDS_VIEW_CUST

Output: check the Association jump to Country and Country Text via standard view I_Country.


4. Create a COMPOSITE view to combine all the Dimension views created above with Transaction or Fact data.
Look at the few annotations used above;
@VDM : {viewType: #COMPOSITE}
This annotation describes that this is a COMPOSITE view which is an association of Master data and Transaction data. This is an SAP Best Practice to configure this annotation to follow the development standards.
@analytics: dataCategory: #CUBE
In the above CDS view the dataCategory annotation is set to #CUBE which would define this CDS view as a data Cube. All other Dimension table are associated with this cube to built the final Reports. On thing to note is once a CDS view is created as #CUBE, no Dimension view can consume it. Only views which can consume a Cube view should be of type cube themselves. Only CDS view of type CUBE can be consumed in S/4HANA Analytics layer. It is mandatory to define at least one measures in the CDS view of type CUBE, else the view will not get activated and throw an error.
@DefaultAggregation: #SUM
This annotation is very important in the design of a CUBE like structure which we would see shortly. The system will be able to know these are actually Key Figures only when we use this annotation. As a result system will put them into the right bucket ‘Key Figures’ in the cube.
@EndUserText.label: 'Weight of Luggage'
This annotation can be used to give a required business labels to the fields instead of using standard table field names.
The above view is like a CUBE where combined Dimension data with Fact data. Now we need a final view which will be ready for the consumption by UI tools and finally by business users in the from of Reports/Dashboards. This view will be like a Query on top of the previous CUBE view.
Let's create the final view as below;
Note the below annotations;
@VDM: {viewType: #CONSUMPTION}
This annotation describes that this view is the final view ready to Consumed. No Joins or Associations are performed here and this is made to behave like a query via below annotation.
@analytics.query: true
This annotation actually SET this view to be consumption ready by different UI tools.It is mandatory to use this annotation if our intend is to create final analytical reports on this view via SAP front end tools - Bex, Webi, Lumira, SAC - SAP Analytics Cloud etc.
CONSUMING CDS VIEW INTO SAP UI TOOLS:
Now we will see how to consume the final View which also has a VDM ViewType CONSUMPTION means it is ready to be consumed.
RSRTS_ODP_DIS:
This tcode display the structure of the Cube we created with CDS views. If you remember, we created a CDS view of VDM type CUBE : ZCDS_VIEW_FLBOOK and the DDIC SQL view name is : ZSQL_VIEW_FLBOOK.
->Run T-code RSRTS_ODP_DIS
-Choose ODP Context as ‘ABAP Core Data Services
-For ODP Name, enter the DDIC SQL View name followed by ‘2C’
-Execute

What you will see now is a ‘Transient Provider’ system created. Note the structure, it is exactly like a BW cube. If you are a BW consultant, you can relate well. If not, just look at the nodes ‘KEY’, ‘DATA’, ‘UNIT’, and ‘KEY FIGURE’ and the fields underneath. This happens due to the different annotations we used while creating the CDS view, especially datacategory: #CUBE. If you don’t put this annotation, this will NOT work at all.


-Click on button ‘Standard Query’

-Now you can actually place data elements into rows and columns like a report.

-Since it is kind of a virtual cube now, you can also pull it into Bex Query Designer to create a Bex Query which can be configured with more advanced features and can be consumed into SAP Front end tools like Lumira, Webi, Analysis for MS Excel.
-> Open Bex Query Designer;
-Hit ‘Create’ and search for the view 2CZSQL_VIEW_FLBOOK and open

Now within Bex designer, you can create a regular report with all the advanced Bex features like Rows, Columns, Restricted/Calculated Key figures, Cell definitions, Exceptions, Conditions etc. and can be consumed into all Analytics tools like Webi, Lumira, Analysis for Office etc.

RSRT:
For simple CDS view with few Mathematical expression which we have already configured in the CDS view itself, we need not to really configure them into Bex Query designer for user consumption, rather we can directly have business users to access those via t-code RSRT. To enable the business user to access a CDS view as type of an analytical report, we need to create the final view which is ready for user consumption. This view will read the COMPOSITE view we created above. This view needs to be created of type CONSUMPTION and we need to add another annotation which will make this view as a query: @analytics.query: true
Note the annotations :
@VDM: {viewType: #CONSUMPTION}
@analytics.query: true
Now run T-code: RSRT and enter the name of the view followed by 2C and hit ‘Execute’


You can see the Key Figures already added as columns. Business users can now add Rows based on the analytics requirement they have.

In case a business user would want to have a default view with some Rows/Columns already added into the report when he/she execute it via RSRT. That can also be enabled via another annotations. Lets try that as well;
Check the annotation: @AnalyticsDetails.query.axis: #ROWS
You have different options here like Bex Designer;

Look at the whole code with ROWS and COLUMNS config.
Now check this query again in RSRT, see how awesome it is ?.. check the default rows & columns added.

Now if you are an ABAP expert, you might be thinking how to add a Selection Screen to this report and if you are a BW guy, you might be thinking how to add ‘Characteristic Restriction’ to filter the data. This is absolutely possible in a CDS view with use of one another annotation: @Consumption.filter.selectionType: There are different options to choose from, see below. Let’s add a selection parameter for Country with a ‘Single Selection’

Try running this query again with tcode: RSRT. Check the selection box shows up on the top. Enter US and execute.

Parameter as Mandatory Selection:
If you want to make the parameter as a mandatory selection; you can add another clause in the annotation :

Now if you try to run without passing any value, you can see an error message;

---All above we saw how to consume CDS view into SAP Analytics tools. Now we will see how to consume the same view into FIORI---
CONSUME CDS VIEW INTO ANALYSIS FOR OFFICE:
As I mentioned, a CDS view can be consumed into Analysis for Office to enable ad-hoc analysis by the business users. Let’s look how we can do it;

Data is ready now to do ad-hoc analysis;

CONSUME CDS VIEW INTO FIORI APPLICATION:
As we already saw in one of the previous blog that to consume a CDS view we need an OData service. So let’s first configure an OData service in the CDS view.

2. Copy the service name by hovering over mouse pointer on the yellow icon that show up after adding OData annotation;

3. Register the Service.
Goto code /n/IWFND/MAINT_SERVICE, click on ‘Add Service’ button;

4. Choose System Alias - ‘LOCAL’ and the external Service name which we just created by
OData. Hit Enter.

5. Select the service and hit ‘Add Selected Service’ button to register the service. This is only One Time Activity.

6. Choose LOCAL for Package Selection and execute;


7. Service is registered.
8. Start Web IDE to create a FIORI app on top of the CDS
9. New-Project from Template;

10. Choose ‘List Report Application’;

11. Add the required details and click ‘Next;

12. Connect to Server;

13. Choose the registered service name;

14. Select all the annotations;
15. For Data Binding, select the CDS view name and hit ‘Finish’

16. Now execute the FIORI application;


17. You can see a FIORI tile created;

18. Double click on FIORI tile and enter your credentials;

19. Enter ‘US’ in the mandatory parameter for Country Selection and hot ‘Go’. Since we did not yet selected columns to be displayed, we will see this message;

20. Click on ‘Setting’ button to add columns;

21. Look at the wonderful report generated. This is the new reporting methodology followed in S4 environment. There are many great features as well.

22. Users can enable more filters by themselves, I like this feature too much. No code required. Click on Adapt Filter->More Filters. Select the ones you need;

23. Check these filters are now available to filter out data;
In summary, we looked at the complete end to end cycle of an analytics requirements. In your projects, you would find a similar development but can be very complex based on what business users would want to see as the final reports.
That concludes the end to end CDS to UI tools and Fiori scenario and the blog post series. Hope you have enjoyed it!
Feel free to ask questions you may have and stay tuned for more advanced topics on CDS views.
Follow for upcoming blog posts: kumarsanjeev
Keep learning.....
SK.
Dimension Tables:
- SCUSTOM for Customer information.
- SCARR for Airline information
- SPFLI for Connection information.
Fact Table:
- SBOOK : Flight Bookings information
NOTE: For Time Dimension we can use SAP standard Basic Interface view I_CalendarDate and for Country and Country text we can use I_Country.
- Create the first view for Airline information : ZCDS_VIEW_AIRLN
CDS View:
Note these annotations;
@VDM:{viewType: #BASIC} : As already mentioned, this annotation tells that this is a Basic Interface view which delivers Master Data - Airline Information in this scenario.
@Semantics.currencyCode: true - This annotation tells system that field ‘currcode’ is treated as Currency field.
@analytics: dataCategory: #DIMENSION - shows this is Dimension data.
Output:
2. Create second view for Connection information: ZCDS_VIEW_CONN
Note: Check the keyword $Projection. Instead of source table name or alias, we can use $Projection as well which will take care of Association. The thing to note is with $Project, you can only use the fields which you have listed in the CDS view i.e. if the table has 20 fields but in your CDS view you want only 5 fields and you have listed them in the view, you can use only one of these 5 fields with $Projection. You are free to use table name or alias, this is just what SAP is using for standard views and comes under best practices.
Output: check the output and association;
3. Create a view for Customer information : ZCDS_VIEW_CUST
Output: check the Association jump to Country and Country Text via standard view I_Country.
4. Create a COMPOSITE view to combine all the Dimension views created above with Transaction or Fact data.
@AbapCatalog.sqlViewName: 'ZSQL_VIEW_FLBOOK'

@AbapCatalog.compiler.compareFilter: true

@AbapCatalog.preserveKey: true

@AccessControl.authorizationCheck: #CHECK

@EndUserText.label: 'Flight Booking Information'


@VDM : {viewType: #COMPOSITE}

@Analytics: {dataCategory: #CUBE, dataExtraction: {enabled: true}}

define view ZCDS_VIEW_FLBOOK as select from sbook

association [1] to I_CalendarDate    as _CalendarDate on  $projection.FlightDate       = _CalendarDate.CalendarDate

association [1] to ZCDS_VIEW_AIRLINE as _Airline      on  $projection.Airline          = _Airline.Airline

association [1] to zcds_view_conn    as _Connection   on  $projection.Airline          = _Connection.Airline

                                                      and $projection.FlightConnection = _Connection.FlConnectNumber

association [1] to ZCDS_VIEW_CUST    as _Customer     on  $projection.Customer         = _Customer.Customer


{


    /** DIMENSIONS **/


  key carrid                 as Airline,

  key connid                 as FlightConnection,

  key fldate                 as FlightDate,

  key bookid                 as BookNumber,

  key customid               as Customer,

  key agencynum              as TravelAgency,


  _CalendarDate.CalendarYear,


  _CalendarDate.CalendarMonth,


  _Customer.country      as CustomerCountry,


  _Customer.city         as CustomerCity,


  /** MEASURES **/

  @EndUserText.label: 'Booking Price'

  @DefaultAggregation: #SUM

  @Semantics.amount.currencyCode: 'Currency'

  forcuram               as BookingPrice,


  @EndUserText.label: 'Currency'

  @Semantics.currencyCode: true

  forcurkey              as Currency,


  @EndUserText.label: 'Luggage Weight'

  @DefaultAggregation: #SUM

  @Semantics.quantity.unitOfMeasure: 'WeightUOM'

  luggweight             as WeightOfLuggage,


  @EndUserText.label: 'Weight Unit'

  @Semantics.unitOfMeasure: true

  wunit                  as WeightUOM,


  // Associations

  _Airline,

  _CalendarDate,

  _CalendarDate._CalendarMonth,

  _CalendarDate._CalendarYear,

  _Connection,

  _Customer,


  _Customer._Country     as _CustomerCountry

}
Look at the few annotations used above;
@VDM : {viewType: #COMPOSITE}
This annotation describes that this is a COMPOSITE view which is an association of Master data and Transaction data. This is an SAP Best Practice to configure this annotation to follow the development standards.
@analytics: dataCategory: #CUBE
In the above CDS view the dataCategory annotation is set to #CUBE which would define this CDS view as a data Cube. All other Dimension table are associated with this cube to built the final Reports. On thing to note is once a CDS view is created as #CUBE, no Dimension view can consume it. Only views which can consume a Cube view should be of type cube themselves. Only CDS view of type CUBE can be consumed in S/4HANA Analytics layer. It is mandatory to define at least one measures in the CDS view of type CUBE, else the view will not get activated and throw an error.
@DefaultAggregation: #SUM
This annotation is very important in the design of a CUBE like structure which we would see shortly. The system will be able to know these are actually Key Figures only when we use this annotation. As a result system will put them into the right bucket ‘Key Figures’ in the cube.
@EndUserText.label: 'Weight of Luggage'
This annotation can be used to give a required business labels to the fields instead of using standard table field names.
The above view is like a CUBE where combined Dimension data with Fact data. Now we need a final view which will be ready for the consumption by UI tools and finally by business users in the from of Reports/Dashboards. This view will be like a Query on top of the previous CUBE view.
Let's create the final view as below;
@AbapCatalog.sqlViewName: 'ZSQL_VIEW_FRPRT'

@AbapCatalog.compiler.compareFilter: true

@AbapCatalog.preserveKey: true

@AccessControl.authorizationCheck: #CHECK

@EndUserText.label: 'Flight Details Report'

@OData.publish: true


@VDM: {viewType: #CONSUMPTION}

@Analytics.query: true

define view ZCDS_VIEW_FREPORT as select from ZCDS_VIEW_FLBOOK


{

    //ZCDS_VIEW_FLBOOK


    key Airline,

    key FlightConnection,

    key FlightDate,

    key BookNumber,

    key Customer,

    --key TravelAgency,


    CalendarYear,

    CalendarMonth,

    CustomerCountry,

    CustomerCity,

    WeightOfLuggage,

    WeightUOM,

    BookingPrice,

    Currency,

    /* Associations */

    //ZCDS_VIEW_FLBOOK

    _Airline,

    _CalendarDate,

    _CalendarMonth,

    _CalendarYear,

    _Connection,

    _Customer,

    _CustomerCountry

}
Note the below annotations;
@VDM: {viewType: #CONSUMPTION}
This annotation describes that this view is the final view ready to Consumed. No Joins or Associations are performed here and this is made to behave like a query via below annotation.
@analytics.query: true
This annotation actually SET this view to be consumption ready by different UI tools.It is mandatory to use this annotation if our intend is to create final analytical reports on this view via SAP front end tools - Bex, Webi, Lumira, SAC - SAP Analytics Cloud etc.
CONSUMING CDS VIEW INTO SAP UI TOOLS:
Now we will see how to consume the final View which also has a VDM ViewType CONSUMPTION means it is ready to be consumed.
- There are 2 tools in SAP S4HANA where this view can be consumed.
- RSRTS_ODP_DIS
- RSRT
RSRTS_ODP_DIS:
This tcode display the structure of the Cube we created with CDS views. If you remember, we created a CDS view of VDM type CUBE : ZCDS_VIEW_FLBOOK and the DDIC SQL view name is : ZSQL_VIEW_FLBOOK.
->Run T-code RSRTS_ODP_DIS
-Choose ODP Context as ‘ABAP Core Data Services
-For ODP Name, enter the DDIC SQL View name followed by ‘2C’
-Execute
What you will see now is a ‘Transient Provider’ system created. Note the structure, it is exactly like a BW cube. If you are a BW consultant, you can relate well. If not, just look at the nodes ‘KEY’, ‘DATA’, ‘UNIT’, and ‘KEY FIGURE’ and the fields underneath. This happens due to the different annotations we used while creating the CDS view, especially datacategory: #CUBE. If you don’t put this annotation, this will NOT work at all.
-Click on button ‘Standard Query’
-Now you can actually place data elements into rows and columns like a report.
-Since it is kind of a virtual cube now, you can also pull it into Bex Query Designer to create a Bex Query which can be configured with more advanced features and can be consumed into SAP Front end tools like Lumira, Webi, Analysis for MS Excel.
-> Open Bex Query Designer;
-Hit ‘Create’ and search for the view 2CZSQL_VIEW_FLBOOK and open
Now within Bex designer, you can create a regular report with all the advanced Bex features like Rows, Columns, Restricted/Calculated Key figures, Cell definitions, Exceptions, Conditions etc. and can be consumed into all Analytics tools like Webi, Lumira, Analysis for Office etc.
RSRT:
For simple CDS view with few Mathematical expression which we have already configured in the CDS view itself, we need not to really configure them into Bex Query designer for user consumption, rather we can directly have business users to access those via t-code RSRT. To enable the business user to access a CDS view as type of an analytical report, we need to create the final view which is ready for user consumption. This view will read the COMPOSITE view we created above. This view needs to be created of type CONSUMPTION and we need to add another annotation which will make this view as a query: @analytics.query: true
Note the annotations :
@VDM: {viewType: #CONSUMPTION}
@analytics.query: true
@AbapCatalog.sqlViewName: 'ZSQL_VIEW_FRPRT'

@AbapCatalog.compiler.compareFilter: true

@AbapCatalog.preserveKey: true

@AccessControl.authorizationCheck: #CHECK

@EndUserText.label: 'Flight Details Report'


@VDM: {viewType: #CONSUMPTION}

@Analytics.query: true

define view ZCDS_VIEW_FREPORT as select from ZCDS_VIEW_FLBOOK


{

    //ZCDS_VIEW_FLBOOK


    key Airline,

    key FlightConnection,

    key FlightDate,

    key BookNumber,

    key Customer,

    --key TravelAgency,


    CalendarYear,

    CalendarMonth,

    CustomerCountry,

    CustomerCity,

    WeightOfLuggage,

    WeightUOM,

    BookingPrice,

    Currency,

    /* Associations */

    //ZCDS_VIEW_FLBOOK

    _Airline,

    _CalendarDate,

    _CalendarMonth,

    _CalendarYear,

    _Connection,

    _Customer,

    _CustomerCountry

}
Now run T-code: RSRT and enter the name of the view followed by 2C and hit ‘Execute’
You can see the Key Figures already added as columns. Business users can now add Rows based on the analytics requirement they have.
In case a business user would want to have a default view with some Rows/Columns already added into the report when he/she execute it via RSRT. That can also be enabled via another annotations. Lets try that as well;
Check the annotation: @AnalyticsDetails.query.axis: #ROWS
You have different options here like Bex Designer;
Look at the whole code with ROWS and COLUMNS config.
@AbapCatalog.sqlViewName: 'ZSQL_VIEW_FRPRT'

@AbapCatalog.compiler.compareFilter: true

@AbapCatalog.preserveKey: true

@AccessControl.authorizationCheck: #CHECK

@EndUserText.label: 'Flight Details Report'


@VDM: {viewType: #CONSUMPTION}

@Analytics.query: true

define view ZCDS_VIEW_FREPORT as select from ZCDS_VIEW_FLBOOK


{

    //ZCDS_VIEW_FLBOOK


    key Airline,

    key FlightConnection,

    key FlightDate,

    key BookNumber,

    key Customer,

    --key TravelAgency,


    @AnalyticsDetails.query.axis: #ROWS

    CalendarYear,

    @AnalyticsDetails.query.axis: #ROWS

    CalendarMonth,

    @AnalyticsDetails.query.axis: #ROWS

    CustomerCountry,

    @AnalyticsDetails.query.axis: #ROWS

    CustomerCity,

    @AnalyticsDetails.query.axis: #COLUMNS

    WeightOfLuggage,

    WeightUOM,

    @AnalyticsDetails.query.axis: #COLUMNS

    BookingPrice,

    Currency,

    /* Associations */

    //ZCDS_VIEW_FLBOOK

    _Airline,

    _CalendarDate,

    _CalendarMonth,

    _CalendarYear,

    _Connection,

    _Customer,

    _CustomerCountry

}
Now check this query again in RSRT, see how awesome it is ?.. check the default rows & columns added.
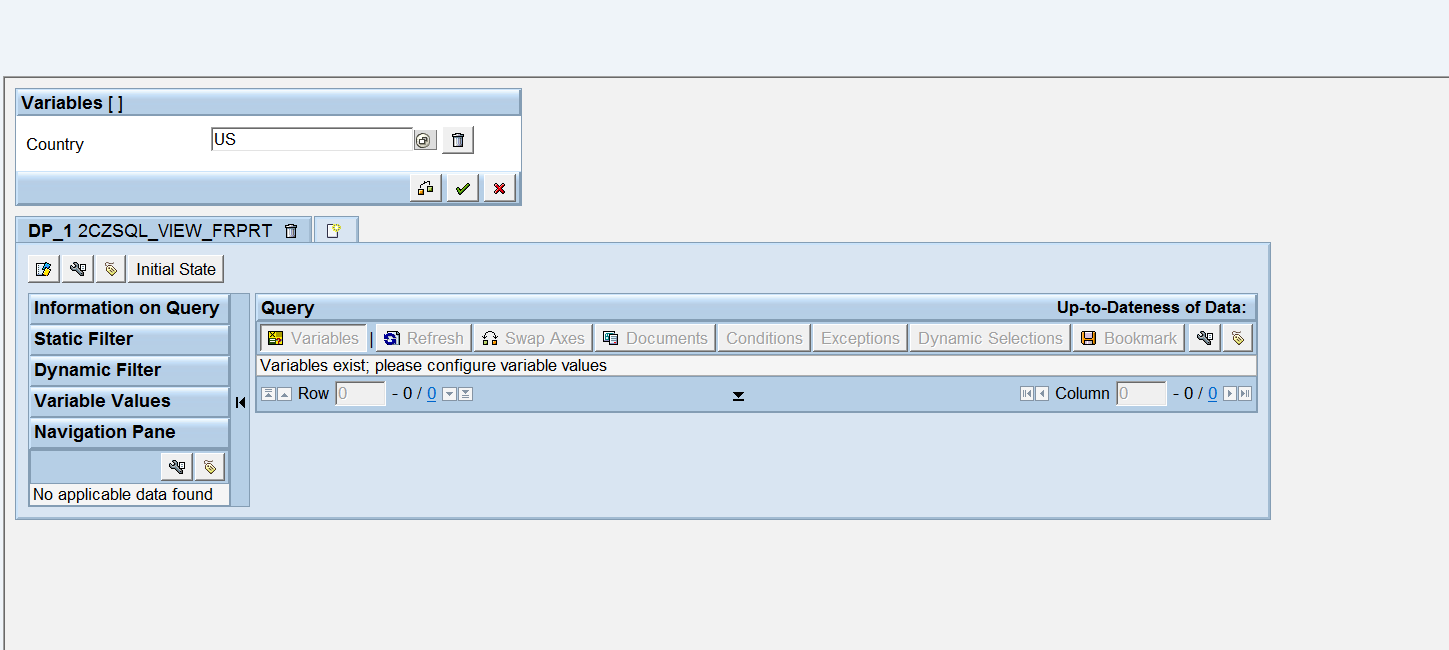
Now if you are an ABAP expert, you might be thinking how to add a Selection Screen to this report and if you are a BW guy, you might be thinking how to add ‘Characteristic Restriction’ to filter the data. This is absolutely possible in a CDS view with use of one another annotation: @Consumption.filter.selectionType: There are different options to choose from, see below. Let’s add a selection parameter for Country with a ‘Single Selection’
Try running this query again with tcode: RSRT. Check the selection box shows up on the top. Enter US and execute.
Parameter as Mandatory Selection:
If you want to make the parameter as a mandatory selection; you can add another clause in the annotation :
Now if you try to run without passing any value, you can see an error message;
---All above we saw how to consume CDS view into SAP Analytics tools. Now we will see how to consume the same view into FIORI---
CONSUME CDS VIEW INTO ANALYSIS FOR OFFICE:
As I mentioned, a CDS view can be consumed into Analysis for Office to enable ad-hoc analysis by the business users. Let’s look how we can do it;
- Open Analysis for office and connect to the S4HANA system;
- Search for the CDS view of VDM type ‘COMPOSITE’ and dataCategory ‘CUBE’ we created above;
Data is ready now to do ad-hoc analysis;
CONSUME CDS VIEW INTO FIORI APPLICATION:
As we already saw in one of the previous blog that to consume a CDS view we need an OData service. So let’s first configure an OData service in the CDS view.
- Configure OData Service – This can be done by adding an annotation. Activate the view;
2. Copy the service name by hovering over mouse pointer on the yellow icon that show up after adding OData annotation;
3. Register the Service.
Goto code /n/IWFND/MAINT_SERVICE, click on ‘Add Service’ button;
4. Choose System Alias - ‘LOCAL’ and the external Service name which we just created by
OData. Hit Enter.
5. Select the service and hit ‘Add Selected Service’ button to register the service. This is only One Time Activity.
6. Choose LOCAL for Package Selection and execute;
7. Service is registered.
8. Start Web IDE to create a FIORI app on top of the CDS
9. New-Project from Template;
10. Choose ‘List Report Application’;
11. Add the required details and click ‘Next;
12. Connect to Server;
13. Choose the registered service name;
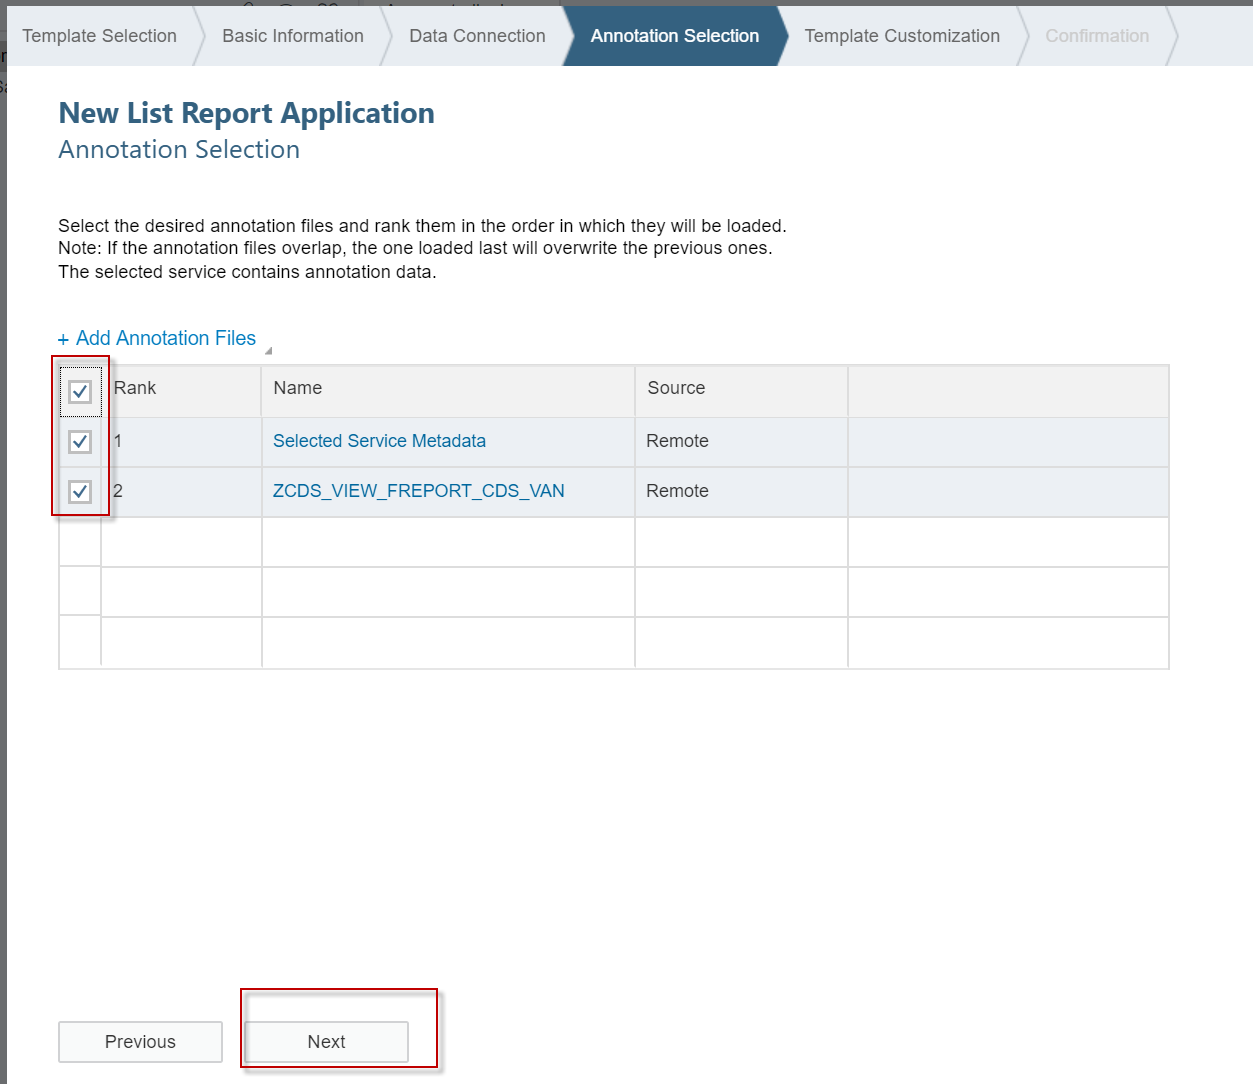
14. Select all the annotations;
15. For Data Binding, select the CDS view name and hit ‘Finish’
16. Now execute the FIORI application;
17. You can see a FIORI tile created;
18. Double click on FIORI tile and enter your credentials;
19. Enter ‘US’ in the mandatory parameter for Country Selection and hot ‘Go’. Since we did not yet selected columns to be displayed, we will see this message;
20. Click on ‘Setting’ button to add columns;
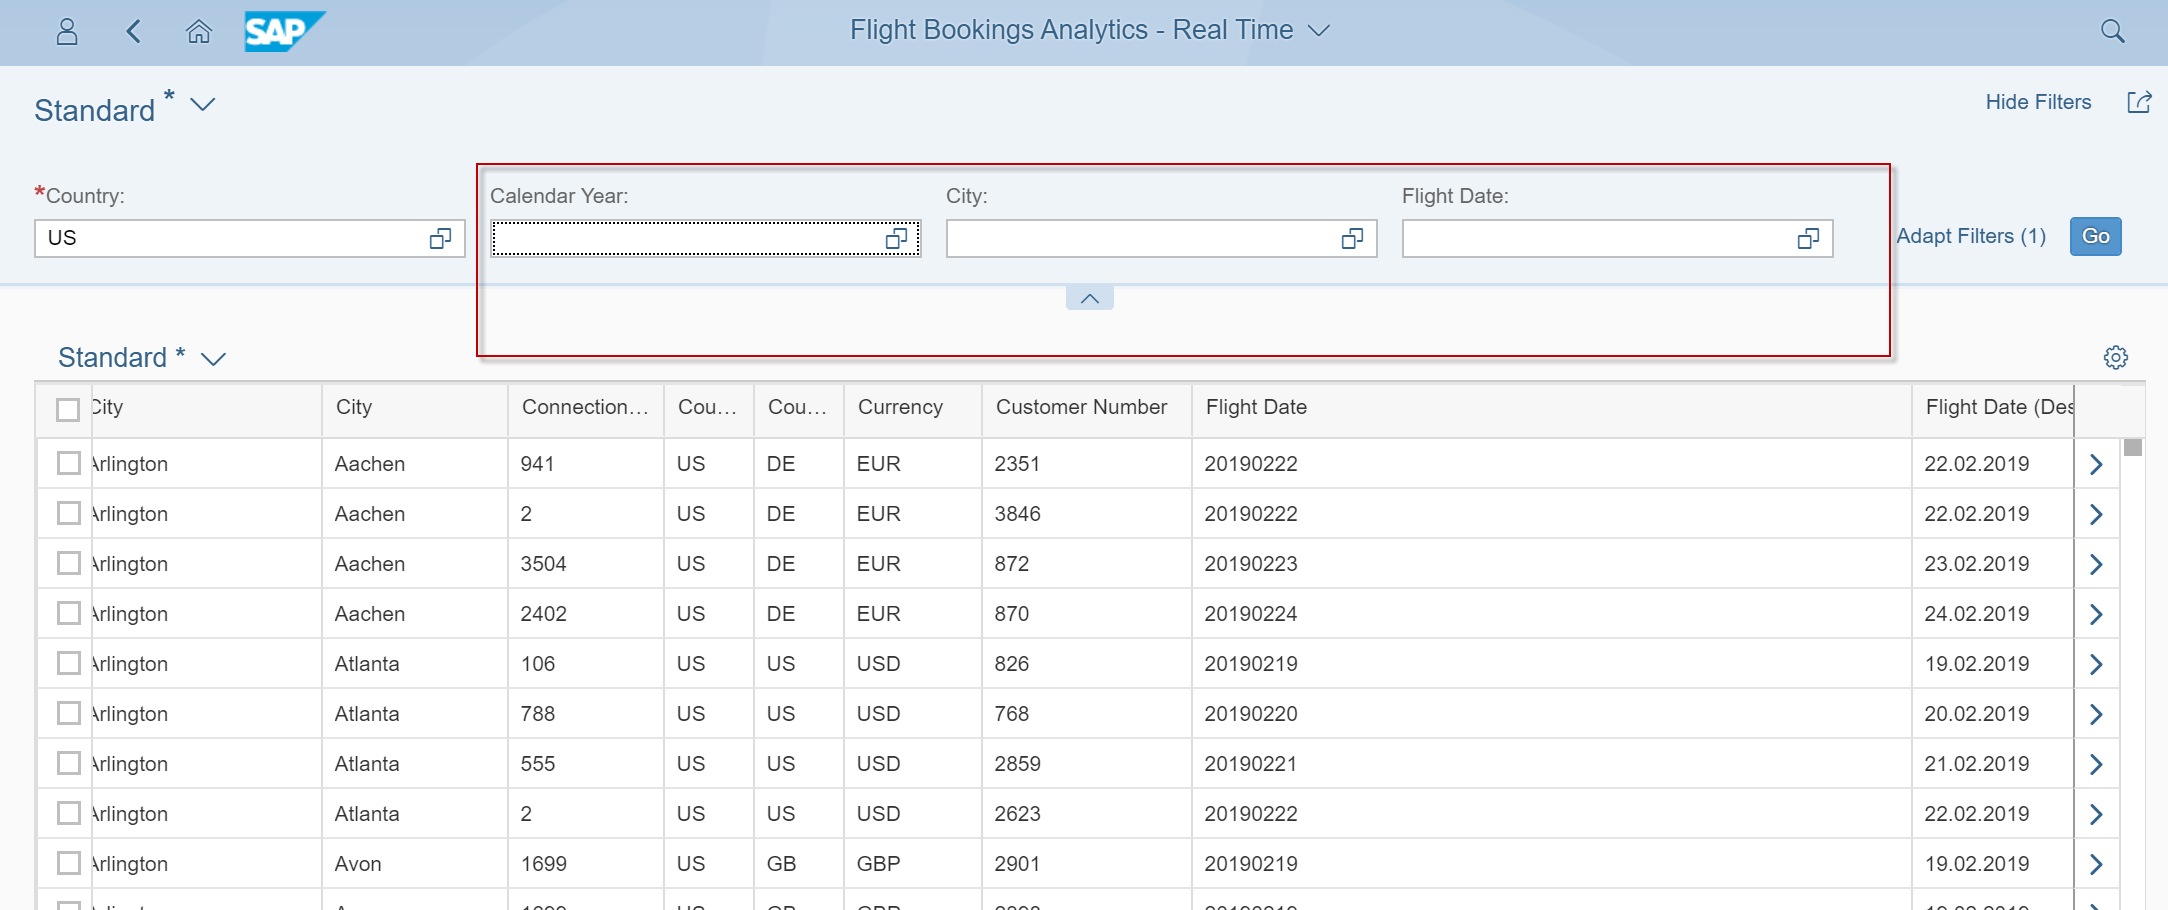
21. Look at the wonderful report generated. This is the new reporting methodology followed in S4 environment. There are many great features as well.
22. Users can enable more filters by themselves, I like this feature too much. No code required. Click on Adapt Filter->More Filters. Select the ones you need;
23. Check these filters are now available to filter out data;
In summary, we looked at the complete end to end cycle of an analytics requirements. In your projects, you would find a similar development but can be very complex based on what business users would want to see as the final reports.
That concludes the end to end CDS to UI tools and Fiori scenario and the blog post series. Hope you have enjoyed it!
Feel free to ask questions you may have and stay tuned for more advanced topics on CDS views.
Follow for upcoming blog posts: kumarsanjeev
Keep learning.....
SK.
- SAP Managed Tags:
- ABAP Development,
- OData,
- SAP S/4HANA
21 Comments
You must be a registered user to add a comment. If you've already registered, sign in. Otherwise, register and sign in.
Labels in this area
-
"mm02"
1 -
A_PurchaseOrderItem additional fields
1 -
ABAP
1 -
ABAP Extensibility
1 -
ACCOSTRATE
1 -
ACDOCP
1 -
Adding your country in SPRO - Project Administration
1 -
Advance Return Management
1 -
AI and RPA in SAP Upgrades
1 -
Approval Workflows
1 -
ARM
1 -
ASN
1 -
Asset Management
1 -
Associations in CDS Views
1 -
auditlog
1 -
Authorization
1 -
Availability date
1 -
Azure Center for SAP Solutions
1 -
AzureSentinel
2 -
Bank
1 -
BAPI_SALESORDER_CREATEFROMDAT2
1 -
BRF+
1 -
BRFPLUS
1 -
Bundled Cloud Services
1 -
business participation
1 -
Business Processes
1 -
CAPM
1 -
Carbon
1 -
Cental Finance
1 -
CFIN
1 -
CFIN Document Splitting
1 -
Cloud ALM
1 -
Cloud Integration
1 -
condition contract management
1 -
Connection - The default connection string cannot be used.
1 -
Custom Table Creation
1 -
Customer Screen in Production Order
1 -
Data Quality Management
1 -
Date required
1 -
Decisions
1 -
desafios4hana
1 -
Developing with SAP Integration Suite
1 -
Direct Outbound Delivery
1 -
DMOVE2S4
1 -
EAM
1 -
EDI
2 -
EDI 850
1 -
EDI 856
1 -
EHS Product Structure
1 -
Emergency Access Management
1 -
Energy
1 -
EPC
1 -
Find
1 -
FINSSKF
1 -
Fiori
1 -
Flexible Workflow
1 -
Gas
1 -
Gen AI enabled SAP Upgrades
1 -
General
1 -
generate_xlsx_file
1 -
Getting Started
1 -
HomogeneousDMO
1 -
IDOC
2 -
Integration
1 -
Learning Content
2 -
LogicApps
2 -
low touchproject
1 -
Maintenance
1 -
management
1 -
Material creation
1 -
Material Management
1 -
MD04
1 -
MD61
1 -
methodology
1 -
Microsoft
2 -
MicrosoftSentinel
2 -
Migration
1 -
MRP
1 -
MS Teams
2 -
MT940
1 -
Newcomer
1 -
Notifications
1 -
Oil
1 -
open connectors
1 -
Order Change Log
1 -
ORDERS
2 -
OSS Note 390635
1 -
outbound delivery
1 -
outsourcing
1 -
PCE
1 -
Permit to Work
1 -
PIR Consumption Mode
1 -
PIR's
1 -
PIRs
1 -
PIRs Consumption
1 -
PIRs Reduction
1 -
Plan Independent Requirement
1 -
Premium Plus
1 -
pricing
1 -
Primavera P6
1 -
Process Excellence
1 -
Process Management
1 -
Process Order Change Log
1 -
Process purchase requisitions
1 -
Product Information
1 -
Production Order Change Log
1 -
Purchase requisition
1 -
Purchasing Lead Time
1 -
Redwood for SAP Job execution Setup
1 -
RISE with SAP
1 -
RisewithSAP
1 -
Rizing
1 -
S4 Cost Center Planning
1 -
S4 HANA
1 -
S4HANA
3 -
Sales and Distribution
1 -
Sales Commission
1 -
sales order
1 -
SAP
2 -
SAP Best Practices
1 -
SAP Build
1 -
SAP Build apps
1 -
SAP Cloud ALM
1 -
SAP Data Quality Management
1 -
SAP Maintenance resource scheduling
2 -
SAP Note 390635
1 -
SAP S4HANA
2 -
SAP S4HANA Cloud private edition
1 -
SAP Upgrade Automation
1 -
SAP WCM
1 -
SAP Work Clearance Management
1 -
Schedule Agreement
1 -
SDM
1 -
security
2 -
Settlement Management
1 -
soar
2 -
SSIS
1 -
SU01
1 -
SUM2.0SP17
1 -
SUMDMO
1 -
Teams
2 -
User Administration
1 -
User Participation
1 -
Utilities
1 -
va01
1 -
vendor
1 -
vl01n
1 -
vl02n
1 -
WCM
1 -
X12 850
1 -
xlsx_file_abap
1 -
YTD|MTD|QTD in CDs views using Date Function
1
- « Previous
- Next »
Related Content
- Requisition Status Report in Enterprise Resource Planning Q&A
- fiscal year and standard year in the same model in SAP Analytics Cloud in Enterprise Resource Planning Q&A
- Report S_ALR_87012405 in Enterprise Resource Planning Q&A
- Portfolio Management – Enhanced Financial Planning integration in Enterprise Resource Planning Blogs by SAP
- The Role of SAP Business AI in the Chemical Industry. Overview in Enterprise Resource Planning Blogs by SAP
Top kudoed authors
| User | Count |
|---|---|
| 2 | |
| 2 | |
| 2 | |
| 2 | |
| 2 | |
| 1 | |
| 1 | |
| 1 | |
| 1 |