
- SAP Community
- Products and Technology
- Technology
- Technology Blogs by Members
- Get Started with Data Modeling in SAP Data Warehou...
Technology Blogs by Members
Explore a vibrant mix of technical expertise, industry insights, and tech buzz in member blogs covering SAP products, technology, and events. Get in the mix!
Turn on suggestions
Auto-suggest helps you quickly narrow down your search results by suggesting possible matches as you type.
Showing results for
carlos_basto2
Explorer
Options
- Subscribe to RSS Feed
- Mark as New
- Mark as Read
- Bookmark
- Subscribe
- Printer Friendly Page
- Report Inappropriate Content
10-24-2019
3:43 PM
INTRODUCTION
Before we start our tour into SAP Data Warehouse Cloud world, I'd like to mention, that all content here was written based on the Beta Version of SAP Data Warehouse Cloud. Software settings, coding and/or code snippets are examples. They are not for productive use. This blog post is only intended to better explain and visualize new functionalities in SAP Data Warehouse Cloud.
Also, consider that experimental features are not part of the officially delivered scope that SAP guarantees for future releases. This means that experimental features may be changed by SAP at any time for any reason without notice.
All set then?
As you already know, SAP Data Warehouse Cloud is an end-to-end warehouse in the cloud that combines data management processes with advanced analytics.
This blog post will be divided into 6 steps to give you a feeling of what is available there for Data Modeling:
- 1 step || Agent Settings
- 2 step || Create your Connections
- 3 step || Create your Space
- 4 step || Data Modeling
- 5 step || Business Catalog
- 6 step || Create Stories
1 STEP || AGENT SETTINGS
To get started with a more like “real” scenario in SAP Data Warehouse Cloud Beta Version, we will use a on premise SAP HANA and SAP BW/4HANA systems as sources. For this, we need to execute some steps.
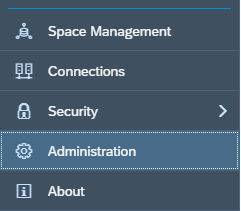
In Administration Console, we have to register one data provisioning agent. It is needed because SAP Data Warehouse Cloud connects to on-premise systems through Smart Data Integration and its agent.
You can install DPA wherever you want. I have installed mine in my own machine for example.
If you need some help on DPA installation, check it out: Configure Smart Data Integration with the SAP HANA Service.
When you click on [Create Agent Communication Credentials], you have to choose a name for your agent (this is the name you’re going to use in dpagentconfig.ini.) and take note of all settings as follows:

The complete setting for getting it done is available on Connecting to On-Premise Sources.
When DPA is set and agent is started, give some time to Agent status to change ?

When it is connected, it’s done!! You can create your connections.
2 STEP || CREATE YOUR CONNECTIONS

In Beta version, only three (3) connections are available at the moment:

For our case, let’s use ABAP and HANA connections. They are very simple to be set.

Once you choose you Data Provisioning Agent, you just have to insert your environment settings.
On the connection icon, you can check if connection is ok (take care about your browser cache and auto-filling settings, sometimes it might bother you in getting the connections work fine).

3 STEP || CREATE YOUR SPACE

Spaces will allow you to manage the artifacts you created in it. Spaces are decoupled, yet open for flexible access, so your users can collaborate without having to worry about sharing their data. To model your data and create stories, you need to start off with a space.
Let's do it then. by selecting + button on tile or on menu bar of Space Management.

In the first tab, you can set total storage to assign to the space as well as how much of that disk storage can be leveraged as in-memory storage.

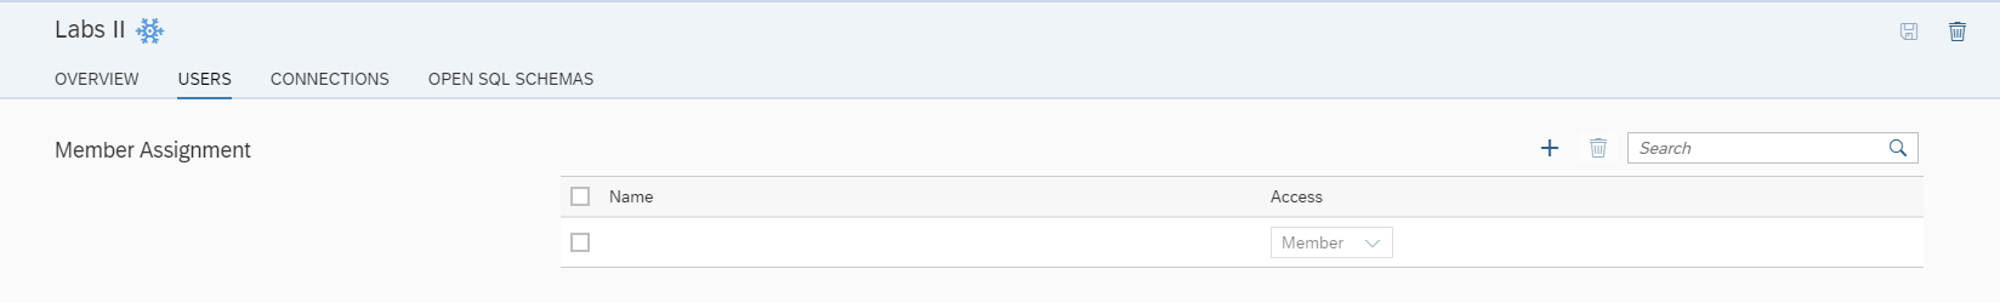
In tab Users, you have to assign all users you want to have access to the space (remember to do it, if you don't, you won't see anything in data builder to create your models).
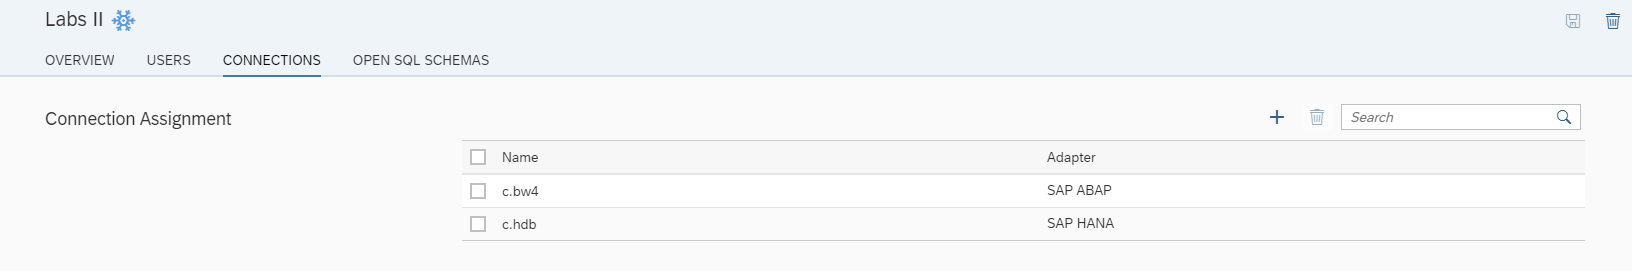
Now, you can assign the connections we've created in previous steps. Thus, the users you assigned to this space can work with the data that originate from these connections later in the Data Builder.
Remember that the first step to combining data from different systems is to connect the sources you wish to work with to your space.
Once the connections are assigned to your space, you are able to combine them using any of the modeling tools in the Data Builder such as the Graphical View, or the SQL View. The Graphical View is great for visual, intuitive data modeling, whereas the SQL View is great for IT or analyst users that have previous knowledge in SQL.
To combine tables from different sources simply select the source you want and drag the table onto the canvas. This works with any data source combination. For example, you can combine SAP HANA and Odata sources, or local CSV tables and SAP ABAP sources.
For our example, I'll assign the SAP ABAP and SAP HANA connections to the space.
The main use-case of creating an open SQL schema is to allow Data Warehouse Cloud access to third-party tools, for example via JDBC. Anyway, I've created it.

This is it. You've created your space. Let's go modeling now. 🙂
4 STEP || DATA MODELING

If you are here and can't see any spaces available, come back to space management and assign your user to it. If you already did it, you should be able to see your space.

You may be interested in reading this good article about Data Modeling: https://saphanacloudservices.com/data-warehouse-cloud/resources/model-data/

You may see these options and get confused, but let's understand better each feature for data modeling and data preparation:
E/R MODEL
This artifact is really excellent, there you can model (or even design) your entities, attributes and relationships in a Conceptual Data model. By doing this, you get your data sets associated. Association is the high-level relationships between your data elements and metadata.
As new views and tables don’t have any associations to each other, defining associations makes it easier to model new graphical views, as all previously defined associations will be suggested in the graphical view builder. For example, join recommendations feature.
You may also get your sources (by dragging and dropping them into the canvas), automatically, imported and deployed (if you click 'yes').
NEW TABLE
You can freely create tables (inside your repository by saving it and in SAP HANA by deploying it).
IMPORT CSV FILE
Importing data from files is a common task in data warehouse scenarios. Normally, flat files only serve as a bare means of storing table information, but do not hold any relations between the tables included within them. This feature can be used for data prep. tasks as well (most of cases).
GRAPHICAL VIEW
Models are used as a basis for stories. You can use tables and views, joins and unions in a graphical environment. This is a very import artifact because it is responsible for combining tables and even other views into a single output from graphical perspective.
There you have a bunch of resources to model your data, combine them from many sources and assign business semantics (Output Properties). Also, the graphical view needs to be defined as fact and has to include measures in order to be consumed in an SAC story -- Don't forget it! 🙂
SQL VIEW
If you are familiar with SQL, you can opt for SQL environment to design your views instead of graphical one. If you already have SQL statements handy from another solution, this is a great way to get a new view quickly.
Well, as you already know the options, let get our model started.
As mentioned, we can benefit a lot from E/R models in further modeling steps, then this can be our first step.

Source data here.
You can upload the CSV files by IMPORT CSV FILE option as well. But, as we wanted a more realistic scenario to study, I've imported this data in HANA and BW/4HANA systems to use on-premise connection for getting the data.
Behind the scenes when we associate a table with another it makes Data Warehouse Cloud recognize that there is a relation in between, it then recommends these relation in other artifacts. Note that tables in left hand side of the picture were generated by saving/deploying the E/R model. No further tasks were needed.
Back to 80's, designing E/R model is nothing but get your database started, right? In this case, besides not serving as conceptual model "designer" only, E/R models speed up the development by importing tables used into your repository and consequently into SAP HANA (DWC).
Of course, table relationship knowledge is required at this moment.
Now it is time to model, let's use graphical view for this.

Take a look at this figure for a moment.
Left hand side we have the [Repository] and [Sources]: they are the resources we have to model. You can reuse artifacts here from repository and/or even get them directly from your sources (remote). In case of using SAP HANA, bottom up scenarios are also possible (EDW perspective).
In the middle we have the canvas where we will model the data. As already mentioned, here you can create joins/unions, project your data, apply formulas and business semantics etc.
Each node has the following options:

The plus (+) button is the association button, here is where you can set the joins and have join recommendations from the system.

Remember we set it on E/R model:

It is great, isn't? 😄
Filter button give you the options for filtering your nodes.

If your expression contains errors, you can check the message as follows:


By pressing formula button, you may think it is a little strange because there's nothing saying "put your formula here"... 😛 Don't mind, let get through it.

When you select the column you want to do the formula, an > button get available.

Then you get the options.
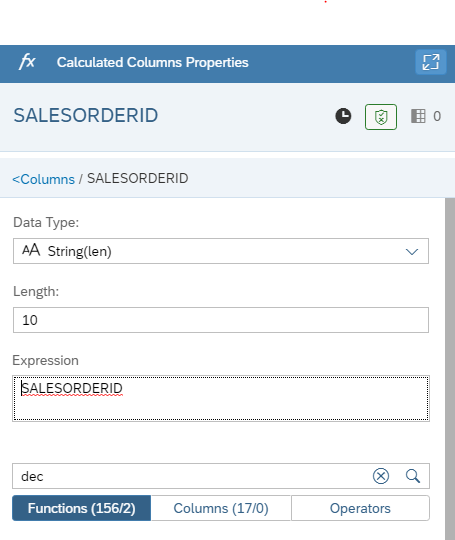
But, ... and if you want to create a new calculated column?

Click on + button and expression options will be available.
Finally we got the Data Preview option.

This is great option, because when your model is too complex, it will be very handy to have the ability of checking your data by nodes.
We can't forget about the nodes JOIN and UNION, right?

There are several options for joins here:

Wondering about "Natural" option? It just a join where the conditions are based on columns with the same name. 🙂
So let me show you how UNION node looks like:

Pretty simple, hun?
We have done our model using Graphical environment:

We could do the same by using SQL View, but for learning purposes, it makes more sense to get started by graphical view. Don't you think?
Before we deploy it, there is one more thing that I believe it is very important. As mentioned, to use our models in SAC (embedded), the view should be typed as "FACT". Let me describe the options you have.
It's important to highlight these definitions, because SAP Data Warehouse Cloud implements them a little bit different.
FACT
A fact is the part of your data that indicates a specific occurrence or transaction. They are composed of multiple measures (or details about it) -- they can be qualitative or quantitative.
DIMENSION
The qualitative measures can be then linked to specific characteristics of that measure, which are called dimensions; it represents categories that provide perspective on your data.
MEASURE
They're quantitative measure where you can apply calculations or aggregations; it represents quantities that provide meaning to your data.
More information, read: Facts, Measures and Dimensions article.
Now we can set our output as FACT then.

And assign the measures:

Save it and deploy it.

5 STEP || BUSINESS CATALOG

Before we go ahead and create our story, let's check the Business Catalog.
This is really a catalog with all your developments.
To get a little deeper understanding on it, consider Business Catalog as the entrance door to Semantic Layer of your whole SAP Data Warehouse Cloud. It helps the business user to understand better what is available in SAP Data Warehouse Cloud through the semantic layer you applied to your models from a centralized perspective.
The artifacts there will be available according to the spaces you are assigned for.

If you click on your artifact, you get a complete overview of it, containing dependencies, aggregations types, columns used, responsible etc.

And finally, a great resource to help you to understand and speed up your development/enhancements is the Lineage.
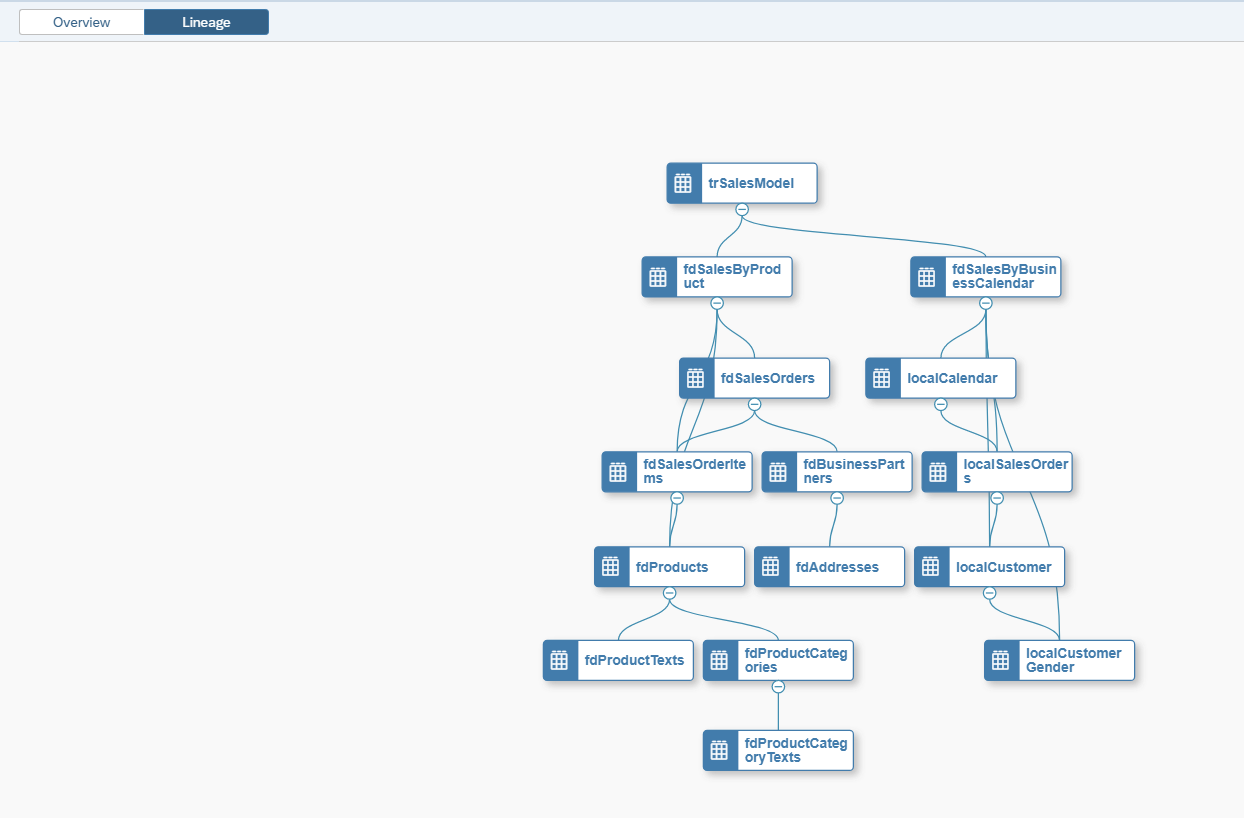
There you can find all lineage of your views and also get into them accordingly by using [Edit in Data Builder] option.
6 STEP || CREATING STORIES

Stories are an organized perspective (story) of your analyzed results of combining different data sources and models.
You can find more information here.

Basically, from now on you just have to apply your SAP Analytics Cloud skills 🙂

CONCLUSION
This blog post tried to give you a better understanding of Data Modeling data flow in SAP Data Warehouse Cloud.
It might be tough to organize the possibilities of modeling your data flows in new tools when you see it for the first time. That's the why I've done this.
Hopefully, It helps you to speed up your knowledge in SAP Data Warehouse Cloud.
Also, try the following links for more information:
SAP Data Warehouse Cloud Documentation (BETA)
SAP Data Warehouse Cloud
Thank you for reading!
- SAP Managed Tags:
- SAP Datasphere,
- Cloud
3 Comments
You must be a registered user to add a comment. If you've already registered, sign in. Otherwise, register and sign in.
Labels in this area
-
"automatische backups"
1 -
"regelmäßige sicherung"
1 -
"TypeScript" "Development" "FeedBack"
1 -
505 Technology Updates 53
1 -
ABAP
14 -
ABAP API
1 -
ABAP CDS Views
2 -
ABAP CDS Views - BW Extraction
1 -
ABAP CDS Views - CDC (Change Data Capture)
1 -
ABAP class
2 -
ABAP Cloud
2 -
ABAP Development
5 -
ABAP in Eclipse
1 -
ABAP Platform Trial
1 -
ABAP Programming
2 -
abap technical
1 -
absl
2 -
access data from SAP Datasphere directly from Snowflake
1 -
Access data from SAP datasphere to Qliksense
1 -
Accrual
1 -
action
1 -
adapter modules
1 -
Addon
1 -
Adobe Document Services
1 -
ADS
1 -
ADS Config
1 -
ADS with ABAP
1 -
ADS with Java
1 -
ADT
2 -
Advance Shipping and Receiving
1 -
Advanced Event Mesh
3 -
AEM
1 -
AI
7 -
AI Launchpad
1 -
AI Projects
1 -
AIML
9 -
Alert in Sap analytical cloud
1 -
Amazon S3
1 -
Analytical Dataset
1 -
Analytical Model
1 -
Analytics
1 -
Analyze Workload Data
1 -
annotations
1 -
API
1 -
API and Integration
3 -
API Call
2 -
Application Architecture
1 -
Application Development
5 -
Application Development for SAP HANA Cloud
3 -
Applications and Business Processes (AP)
1 -
Artificial Intelligence
1 -
Artificial Intelligence (AI)
5 -
Artificial Intelligence (AI) 1 Business Trends 363 Business Trends 8 Digital Transformation with Cloud ERP (DT) 1 Event Information 462 Event Information 15 Expert Insights 114 Expert Insights 76 Life at SAP 418 Life at SAP 1 Product Updates 4
1 -
Artificial Intelligence (AI) blockchain Data & Analytics
1 -
Artificial Intelligence (AI) blockchain Data & Analytics Intelligent Enterprise
1 -
Artificial Intelligence (AI) blockchain Data & Analytics Intelligent Enterprise Oil Gas IoT Exploration Production
1 -
Artificial Intelligence (AI) blockchain Data & Analytics Intelligent Enterprise sustainability responsibility esg social compliance cybersecurity risk
1 -
ASE
1 -
ASR
2 -
ASUG
1 -
Attachments
1 -
Authorisations
1 -
Automating Processes
1 -
Automation
2 -
aws
2 -
Azure
1 -
Azure AI Studio
1 -
B2B Integration
1 -
Backorder Processing
1 -
Backup
1 -
Backup and Recovery
1 -
Backup schedule
1 -
BADI_MATERIAL_CHECK error message
1 -
Bank
1 -
BAS
1 -
basis
2 -
Basis Monitoring & Tcodes with Key notes
2 -
Batch Management
1 -
BDC
1 -
Best Practice
1 -
bitcoin
1 -
Blockchain
3 -
bodl
1 -
BOP in aATP
1 -
BOP Segments
1 -
BOP Strategies
1 -
BOP Variant
1 -
BPC
1 -
BPC LIVE
1 -
BTP
12 -
BTP Destination
2 -
Business AI
1 -
Business and IT Integration
1 -
Business application stu
1 -
Business Application Studio
1 -
Business Architecture
1 -
Business Communication Services
1 -
Business Continuity
1 -
Business Data Fabric
3 -
Business Partner
12 -
Business Partner Master Data
10 -
Business Technology Platform
2 -
Business Trends
4 -
CA
1 -
calculation view
1 -
CAP
3 -
Capgemini
1 -
CAPM
1 -
Catalyst for Efficiency: Revolutionizing SAP Integration Suite with Artificial Intelligence (AI) and
1 -
CCMS
2 -
CDQ
12 -
CDS
2 -
Cental Finance
1 -
Certificates
1 -
CFL
1 -
Change Management
1 -
chatbot
1 -
chatgpt
3 -
CL_SALV_TABLE
2 -
Class Runner
1 -
Classrunner
1 -
Cloud ALM Monitoring
1 -
Cloud ALM Operations
1 -
cloud connector
1 -
Cloud Extensibility
1 -
Cloud Foundry
4 -
Cloud Integration
6 -
Cloud Platform Integration
2 -
cloudalm
1 -
communication
1 -
Compensation Information Management
1 -
Compensation Management
1 -
Compliance
1 -
Compound Employee API
1 -
Configuration
1 -
Connectors
1 -
Consolidation Extension for SAP Analytics Cloud
2 -
Control Indicators.
1 -
Controller-Service-Repository pattern
1 -
Conversion
1 -
Cosine similarity
1 -
cryptocurrency
1 -
CSI
1 -
ctms
1 -
Custom chatbot
3 -
Custom Destination Service
1 -
custom fields
1 -
Customer Experience
1 -
Customer Journey
1 -
Customizing
1 -
cyber security
3 -
Data
1 -
Data & Analytics
1 -
Data Aging
1 -
Data Analytics
2 -
Data and Analytics (DA)
1 -
Data Archiving
1 -
Data Back-up
1 -
Data Governance
5 -
Data Integration
2 -
Data Quality
12 -
Data Quality Management
12 -
Data Synchronization
1 -
data transfer
1 -
Data Unleashed
1 -
Data Value
8 -
database tables
1 -
Datasphere
2 -
datenbanksicherung
1 -
dba cockpit
1 -
dbacockpit
1 -
Debugging
2 -
Delimiting Pay Components
1 -
Delta Integrations
1 -
Destination
3 -
Destination Service
1 -
Developer extensibility
1 -
Developing with SAP Integration Suite
1 -
Devops
1 -
digital transformation
1 -
Documentation
1 -
Dot Product
1 -
DQM
1 -
dump database
1 -
dump transaction
1 -
e-Invoice
1 -
E4H Conversion
1 -
Eclipse ADT ABAP Development Tools
2 -
edoc
1 -
edocument
1 -
ELA
1 -
Embedded Consolidation
1 -
Embedding
1 -
Embeddings
1 -
Employee Central
1 -
Employee Central Payroll
1 -
Employee Central Time Off
1 -
Employee Information
1 -
Employee Rehires
1 -
Enable Now
1 -
Enable now manager
1 -
endpoint
1 -
Enhancement Request
1 -
Enterprise Architecture
1 -
ETL Business Analytics with SAP Signavio
1 -
Euclidean distance
1 -
Event Dates
1 -
Event Driven Architecture
1 -
Event Mesh
2 -
Event Reason
1 -
EventBasedIntegration
1 -
EWM
1 -
EWM Outbound configuration
1 -
EWM-TM-Integration
1 -
Existing Event Changes
1 -
Expand
1 -
Expert
2 -
Expert Insights
2 -
Fiori
14 -
Fiori Elements
2 -
Fiori SAPUI5
12 -
Flask
1 -
Full Stack
8 -
Funds Management
1 -
General
1 -
Generative AI
1 -
Getting Started
1 -
GitHub
8 -
Grants Management
1 -
groovy
1 -
GTP
1 -
HANA
6 -
HANA Cloud
2 -
Hana Cloud Database Integration
2 -
HANA DB
2 -
HANA XS Advanced
1 -
Historical Events
1 -
home labs
1 -
HowTo
1 -
HR Data Management
1 -
html5
8 -
HTML5 Application
1 -
Identity cards validation
1 -
idm
1 -
Implementation
1 -
input parameter
1 -
instant payments
1 -
Integration
3 -
Integration Advisor
1 -
Integration Architecture
1 -
Integration Center
1 -
Integration Suite
1 -
intelligent enterprise
1 -
iot
1 -
Java
1 -
job
1 -
Job Information Changes
1 -
Job-Related Events
1 -
Job_Event_Information
1 -
joule
4 -
Journal Entries
1 -
Just Ask
1 -
Kerberos for ABAP
8 -
Kerberos for JAVA
8 -
KNN
1 -
Launch Wizard
1 -
learning content
2 -
Life at SAP
5 -
lightning
1 -
Linear Regression SAP HANA Cloud
1 -
local tax regulations
1 -
LP
1 -
Machine Learning
2 -
Marketing
1 -
Master Data
3 -
Master Data Management
14 -
Maxdb
2 -
MDG
1 -
MDGM
1 -
MDM
1 -
Message box.
1 -
Messages on RF Device
1 -
Microservices Architecture
1 -
Microsoft Universal Print
1 -
Middleware Solutions
1 -
Migration
5 -
ML Model Development
1 -
Modeling in SAP HANA Cloud
8 -
Monitoring
3 -
MTA
1 -
Multi-Record Scenarios
1 -
Multiple Event Triggers
1 -
Neo
1 -
New Event Creation
1 -
New Feature
1 -
Newcomer
1 -
NodeJS
2 -
ODATA
2 -
OData APIs
1 -
odatav2
1 -
ODATAV4
1 -
ODBC
1 -
ODBC Connection
1 -
Onpremise
1 -
open source
2 -
OpenAI API
1 -
Oracle
1 -
PaPM
1 -
PaPM Dynamic Data Copy through Writer function
1 -
PaPM Remote Call
1 -
PAS-C01
1 -
Pay Component Management
1 -
PGP
1 -
Pickle
1 -
PLANNING ARCHITECTURE
1 -
Popup in Sap analytical cloud
1 -
PostgrSQL
1 -
POSTMAN
1 -
Process Automation
2 -
Product Updates
4 -
PSM
1 -
Public Cloud
1 -
Python
4 -
Qlik
1 -
Qualtrics
1 -
RAP
3 -
RAP BO
2 -
Record Deletion
1 -
Recovery
1 -
recurring payments
1 -
redeply
1 -
Release
1 -
Remote Consumption Model
1 -
Replication Flows
1 -
research
1 -
Resilience
1 -
REST
1 -
REST API
1 -
Retagging Required
1 -
Risk
1 -
Rolling Kernel Switch
1 -
route
1 -
rules
1 -
S4 HANA
1 -
S4 HANA Cloud
1 -
S4 HANA On-Premise
1 -
S4HANA
3 -
S4HANA_OP_2023
2 -
SAC
10 -
SAC PLANNING
9 -
SAP
4 -
SAP ABAP
1 -
SAP Advanced Event Mesh
1 -
SAP AI Core
8 -
SAP AI Launchpad
8 -
SAP Analytic Cloud Compass
1 -
Sap Analytical Cloud
1 -
SAP Analytics Cloud
4 -
SAP Analytics Cloud for Consolidation
3 -
SAP Analytics Cloud Story
1 -
SAP analytics clouds
1 -
SAP BAS
1 -
SAP Basis
6 -
SAP BODS
1 -
SAP BODS certification.
1 -
SAP BTP
21 -
SAP BTP Build Work Zone
2 -
SAP BTP Cloud Foundry
6 -
SAP BTP Costing
1 -
SAP BTP CTMS
1 -
SAP BTP Innovation
1 -
SAP BTP Migration Tool
1 -
SAP BTP SDK IOS
1 -
SAP Build
11 -
SAP Build App
1 -
SAP Build apps
1 -
SAP Build CodeJam
1 -
SAP Build Process Automation
3 -
SAP Build work zone
10 -
SAP Business Objects Platform
1 -
SAP Business Technology
2 -
SAP Business Technology Platform (XP)
1 -
sap bw
1 -
SAP CAP
2 -
SAP CDC
1 -
SAP CDP
1 -
SAP CDS VIEW
1 -
SAP Certification
1 -
SAP Cloud ALM
4 -
SAP Cloud Application Programming Model
1 -
SAP Cloud Integration for Data Services
1 -
SAP cloud platform
8 -
SAP Companion
1 -
SAP CPI
3 -
SAP CPI (Cloud Platform Integration)
2 -
SAP CPI Discover tab
1 -
sap credential store
1 -
SAP Customer Data Cloud
1 -
SAP Customer Data Platform
1 -
SAP Data Intelligence
1 -
SAP Data Migration in Retail Industry
1 -
SAP Data Services
1 -
SAP DATABASE
1 -
SAP Dataspher to Non SAP BI tools
1 -
SAP Datasphere
10 -
SAP DRC
1 -
SAP EWM
1 -
SAP Fiori
2 -
SAP Fiori App Embedding
1 -
Sap Fiori Extension Project Using BAS
1 -
SAP GRC
1 -
SAP HANA
1 -
SAP HCM (Human Capital Management)
1 -
SAP HR Solutions
1 -
SAP IDM
1 -
SAP Integration Suite
9 -
SAP Integrations
4 -
SAP iRPA
2 -
SAP Learning Class
1 -
SAP Learning Hub
1 -
SAP Odata
2 -
SAP on Azure
1 -
SAP PartnerEdge
1 -
sap partners
1 -
SAP Password Reset
1 -
SAP PO Migration
1 -
SAP Prepackaged Content
1 -
SAP Process Automation
2 -
SAP Process Integration
2 -
SAP Process Orchestration
1 -
SAP S4HANA
2 -
SAP S4HANA Cloud
1 -
SAP S4HANA Cloud for Finance
1 -
SAP S4HANA Cloud private edition
1 -
SAP Sandbox
1 -
SAP STMS
1 -
SAP successfactors
3 -
SAP SuccessFactors HXM Core
1 -
SAP Time
1 -
SAP TM
2 -
SAP Trading Partner Management
1 -
SAP UI5
1 -
SAP Upgrade
1 -
SAP Utilities
1 -
SAP-GUI
8 -
SAP_COM_0276
1 -
SAPBTP
1 -
SAPCPI
1 -
SAPEWM
1 -
sapmentors
1 -
saponaws
2 -
SAPS4HANA
1 -
SAPUI5
4 -
schedule
1 -
Secure Login Client Setup
8 -
security
9 -
Selenium Testing
1 -
SEN
1 -
SEN Manager
1 -
service
1 -
SET_CELL_TYPE
1 -
SET_CELL_TYPE_COLUMN
1 -
SFTP scenario
2 -
Simplex
1 -
Single Sign On
8 -
Singlesource
1 -
SKLearn
1 -
soap
1 -
Software Development
1 -
SOLMAN
1 -
solman 7.2
2 -
Solution Manager
3 -
sp_dumpdb
1 -
sp_dumptrans
1 -
SQL
1 -
sql script
1 -
SSL
8 -
SSO
8 -
Substring function
1 -
SuccessFactors
1 -
SuccessFactors Platform
1 -
SuccessFactors Time Tracking
1 -
Sybase
1 -
system copy method
1 -
System owner
1 -
Table splitting
1 -
Tax Integration
1 -
Technical article
1 -
Technical articles
1 -
Technology Updates
14 -
Technology Updates
1 -
Technology_Updates
1 -
terraform
1 -
Threats
1 -
Time Collectors
1 -
Time Off
2 -
Time Sheet
1 -
Time Sheet SAP SuccessFactors Time Tracking
1 -
Tips and tricks
2 -
toggle button
1 -
Tools
1 -
Trainings & Certifications
1 -
Transport in SAP BODS
1 -
Transport Management
1 -
TypeScript
2 -
ui designer
1 -
unbind
1 -
Unified Customer Profile
1 -
UPB
1 -
Use of Parameters for Data Copy in PaPM
1 -
User Unlock
1 -
VA02
1 -
Validations
1 -
Vector Database
2 -
Vector Engine
1 -
Visual Studio Code
1 -
VSCode
1 -
Web SDK
1 -
work zone
1 -
workload
1 -
xsa
1 -
XSA Refresh
1
- « Previous
- Next »
Related Content
- ML- Linear Regression definition , implementation scenarios in HANA in Technology Blogs by Members
- Possible Use Cases Of ECC & S/4HANA Connection With SAP Datasphere. in Technology Q&A
- SAP Datasphere - Space, Data Integration, and Data Modeling Best Practices in Technology Blogs by SAP
- What are the use cases of SAP Datasphere over SAP BW4/HANA in Technology Q&A
- Language Code for SAP Business Warehouse Application Server Power BI Connector in Technology Q&A
Top kudoed authors
| User | Count |
|---|---|
| 10 | |
| 9 | |
| 5 | |
| 4 | |
| 4 | |
| 3 | |
| 3 | |
| 3 | |
| 3 | |
| 3 |