
- SAP Community
- Products and Technology
- Technology
- Technology Blogs by Members
- Aggregation using CDS view for any given slice and...
Technology Blogs by Members
Explore a vibrant mix of technical expertise, industry insights, and tech buzz in member blogs covering SAP products, technology, and events. Get in the mix!
Turn on suggestions
Auto-suggest helps you quickly narrow down your search results by suggesting possible matches as you type.
Showing results for
AbhijeetK
Active Participant
Options
- Subscribe to RSS Feed
- Mark as New
- Mark as Read
- Bookmark
- Subscribe
- Printer Friendly Page
- Report Inappropriate Content
10-06-2019
1:53 AM
Introduction
There are many blogs on aggregation using CDS view or without CDS view, even there is topic called embedded analytics where in all KPI, Charts and aggregation is achieved and using KPI modeler one can consume all these functionality.
All you need is the understanding of the annotations and the CDS views (most of the part) and yes if you haven’t started digging on that, start now, don’t be left behind.
https://blogs.sap.com/2019/02/12/dont-be-that-team-why-cds-views-are-the-new-abap-objects/.
There are already many blogs available for embedded analytics, cds views with analytical capabilities and stuff, which has in-depth information. I will be mentioning those in the references.
In this blog I will try to cover dynamic aggregation for any given dimensions and measures, similarly pivot table in ms excel sheet.
Prerequisites
Basic knowledge of ABAP CDS view, SAP Odata service, Cration of odata service using CDS view with reference data source.
Dynamic aggregation(for any given slice and dice of dimensions and measures) can be achieve either we can go with abap(group by) or CDS view.
And in CDS view also there are two ways either using SADL Layer in Odata or Analytical engine framework which can generate the aggregations for you automatically.
This blog will basically give information about analytical application wherein for given LOB how odata service for charts and KPI single service can be use for aggregation any slice and dice of dimensions and measures.
Aggregations in CDS Views
So basically we can add analytical capabilities to a CDS view using two approaches --
- Basic Analytical CDS View -> For simple analytical Fiori apps, which uses SAP SADL layer queries
- Advance Analytical CDS view(Handled in Analytical engine ) -> For Complex analytical Fiori apps with annotation @analytics.query: true that uses Analytical Engine (Cubes and stuff)
What is it about Basic and Advanced stuff..??
Basic means, you don’t need to have a view which has the annotation @analytics.query: true and only basic calculations will work. The Query will be handled by the SADL layer (Dynamic ABAP Select query)
For Advance Analytical capabilities like exception aggregations, complex formulas, query browser app etc.., which the analytical engine (BW) provides, we need to go with the Analytical Query CDS view.
Advance Analytical CDS view
So Using Advance Analytical CDS view(Embedded analytics) in CDS view we can use annotation Analytics.datacategory and Analytics.query. And we need to put aggregation.default or default.aggregation annotation on measures so that in metadata of odata will clearly get to know which fields are dimension and which one are measures. For BW Analytical engine, what are advantage and how to use maheshkumar.palavalli will publish in next blog.
Aggregation using SADL layer
When we want to use single service for read(including analytical quires, KPI, Charts, Stories and aggregation) and the same service need to be use for CUD operations then it approach can be use.
So lets get started --
first create CDS view according to business requirement using VDM concepts as below --

add annotation on measures as below --

So what have we got here is the annotation @DefaultAggregation : #SUM, this annotation makes that particular column as a measure and does the sum of that column data and #AVG will get the average value.
now in next step create odata service using RDS(Refrence data source) which is best approach for generating odata service
once we introduce default.aggregation on measures, In metadata of service(which is created by RDS) all other fields become dimension as below --

Rest all properties become dimension in metadata as below--

now the given service will work as it is, except there will be one 'Analytical ID' key get generated suppressing all the other semantics key, how to resolve this technical key into semantics key I will cover on later part, which is used for fetching single record, navigation from one entity to other, or updating and deleting for given semantics key.
In Below Image .1 is aggregation Id followed by sales order(semantic key) then subsequent key 000001 is sales order item and at last PUSD is Parameter where in value is usd(currency conversion).

If we are executing service then it wont give aggregation value but it will run as normal service
with all filters, count, inline count, pagination($top,$skip) depending on URL call
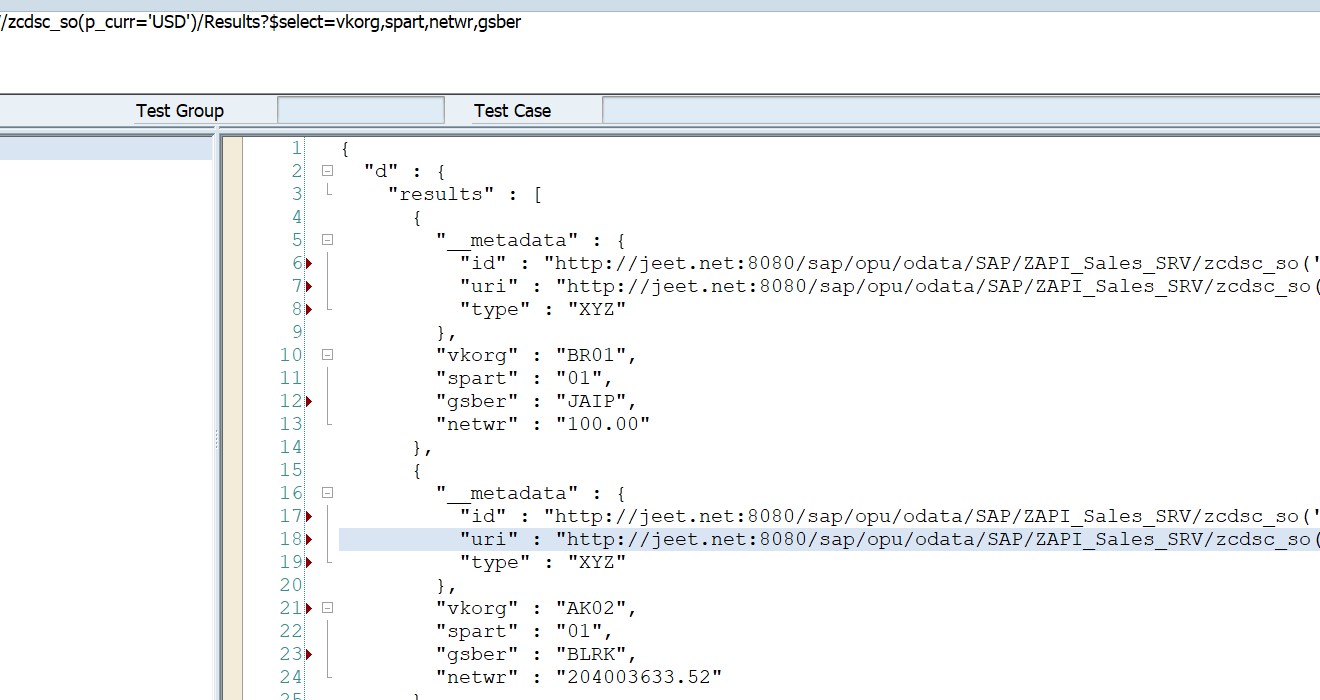
If we want aggregation(groupby) on given dimension then we need to call URL as below and it will give aggregation based on given dimensions for the measures.
sap/opu/odata/SAP/Service_Name/Entity?$select=Dimension1,dim2,dm3,measure1,measure2
In Below use case we are passing netwr and vkorg, so based on organisation dynamic groupby is result set is coming .

by using above url we can see for any given dimension and measures results will come in pivot(like in excel pivot is there, which can be used in different charts and executive dashboard.
below is the results set --
Based on Sales Orgnization and division(spart) below is aggregation

Based on Sales org, division, and sales area--
Note:
- If you pass all non measure fields, again the aggregation will not be applied, which is obvious.
- Always pass the aggregation annotations at the consumption view level as these annotations won’t be propagated from child view(interface,basic) to the parent view(consumption).
- Don’t create the CDS view with aggregations manually like SUM or AVG or COUNT and expose them as the OData service for the Fiori App. It will loose it’s charm, try to design it in a generic way using defualtaggregation annotations, so that it can be reusable in different smart controls.
Now again there are different cases
1.) Simple CDS view as above
In case of simple CDS view for navigation,update, delete or for single record fetch(using key) we need to use key, to resolve Analytical ID into semantics key there is already interface method we can directly used as below --
if_sadl_gw_dpc_util~get_dpc( )->get_keys_from_analytical_id(
EXPORTING io_tech_request_context = io_tech_request_context
IMPORTING et_keys = DATA(lt_keys) ).
EXPORTING io_tech_request_context = io_tech_request_context
IMPORTING et_keys = DATA(lt_keys) ).
this method is already implemented in DPC class.
2.)CDS view with parameter -- If we are not using annotation default.aggregation and using CDS view with parameter then there will be 2 entities get generated, and in URL can be use as below --
URL : /sap/opu/odata/SAP/Service_Name/Entity(p_parameter='Value')/Set
But as we are using annotation default.aggregation so instead of Set there will be Results in URL as below --
URL : /sap/opu/odata/SAP/Service_Name/Entity(p_parameter='Value')/Results
In Next Blog maheshkumar.palavalli will cover Advance Analytics, after that if time permits I will try to cover CUD(Create, Update and Delete) operation using same service, with and without input parameters in CDS view, using currency and Unit conversion, Yeartodate, Monthtodate and quatertodate calculation using CDS view.
Feel free to comment and let me know if I miss something here or you would like to add something to this as I am also in the learning stage at this point.
Thanks a lot to maheshkumar.palavalli for making me understand difference between both approach Sadl layer and analitical layer
Regards,
Abhijeet Kankani
- SAP Managed Tags:
- SAP Fiori,
- ABAP Development,
- SAPUI5,
- SAP HANA,
- SAP S/4HANA,
- NW ABAP Gateway (OData)
8 Comments
You must be a registered user to add a comment. If you've already registered, sign in. Otherwise, register and sign in.
Labels in this area
-
"automatische backups"
1 -
"regelmäßige sicherung"
1 -
505 Technology Updates 53
1 -
ABAP
14 -
ABAP API
1 -
ABAP CDS Views
2 -
ABAP CDS Views - BW Extraction
1 -
ABAP CDS Views - CDC (Change Data Capture)
1 -
ABAP class
2 -
ABAP Cloud
2 -
ABAP Development
5 -
ABAP in Eclipse
1 -
ABAP Platform Trial
1 -
ABAP Programming
2 -
abap technical
1 -
absl
1 -
access data from SAP Datasphere directly from Snowflake
1 -
Access data from SAP datasphere to Qliksense
1 -
Accrual
1 -
action
1 -
adapter modules
1 -
Addon
1 -
Adobe Document Services
1 -
ADS
1 -
ADS Config
1 -
ADS with ABAP
1 -
ADS with Java
1 -
ADT
2 -
Advance Shipping and Receiving
1 -
Advanced Event Mesh
3 -
AEM
1 -
AI
7 -
AI Launchpad
1 -
AI Projects
1 -
AIML
9 -
Alert in Sap analytical cloud
1 -
Amazon S3
1 -
Analytical Dataset
1 -
Analytical Model
1 -
Analytics
1 -
Analyze Workload Data
1 -
annotations
1 -
API
1 -
API and Integration
3 -
API Call
2 -
Application Architecture
1 -
Application Development
5 -
Application Development for SAP HANA Cloud
3 -
Applications and Business Processes (AP)
1 -
Artificial Intelligence
1 -
Artificial Intelligence (AI)
4 -
Artificial Intelligence (AI) 1 Business Trends 363 Business Trends 8 Digital Transformation with Cloud ERP (DT) 1 Event Information 462 Event Information 15 Expert Insights 114 Expert Insights 76 Life at SAP 418 Life at SAP 1 Product Updates 4
1 -
Artificial Intelligence (AI) blockchain Data & Analytics
1 -
Artificial Intelligence (AI) blockchain Data & Analytics Intelligent Enterprise
1 -
Artificial Intelligence (AI) blockchain Data & Analytics Intelligent Enterprise Oil Gas IoT Exploration Production
1 -
Artificial Intelligence (AI) blockchain Data & Analytics Intelligent Enterprise sustainability responsibility esg social compliance cybersecurity risk
1 -
ASE
1 -
ASR
2 -
ASUG
1 -
Attachments
1 -
Authorisations
1 -
Automating Processes
1 -
Automation
1 -
aws
2 -
Azure
1 -
Azure AI Studio
1 -
B2B Integration
1 -
Backorder Processing
1 -
Backup
1 -
Backup and Recovery
1 -
Backup schedule
1 -
BADI_MATERIAL_CHECK error message
1 -
Bank
1 -
BAS
1 -
basis
2 -
Basis Monitoring & Tcodes with Key notes
2 -
Batch Management
1 -
BDC
1 -
Best Practice
1 -
bitcoin
1 -
Blockchain
3 -
BOP in aATP
1 -
BOP Segments
1 -
BOP Strategies
1 -
BOP Variant
1 -
BPC
1 -
BPC LIVE
1 -
BTP
11 -
BTP Destination
2 -
Business AI
1 -
Business and IT Integration
1 -
Business application stu
1 -
Business Architecture
1 -
Business Communication Services
1 -
Business Continuity
1 -
Business Data Fabric
3 -
Business Partner
12 -
Business Partner Master Data
10 -
Business Technology Platform
2 -
Business Trends
1 -
CA
1 -
calculation view
1 -
CAP
3 -
Capgemini
1 -
CAPM
1 -
Catalyst for Efficiency: Revolutionizing SAP Integration Suite with Artificial Intelligence (AI) and
1 -
CCMS
2 -
CDQ
12 -
CDS
2 -
Cental Finance
1 -
Certificates
1 -
CFL
1 -
Change Management
1 -
chatbot
1 -
chatgpt
3 -
CL_SALV_TABLE
2 -
Class Runner
1 -
Classrunner
1 -
Cloud ALM Monitoring
1 -
Cloud ALM Operations
1 -
cloud connector
1 -
Cloud Extensibility
1 -
Cloud Foundry
3 -
Cloud Integration
6 -
Cloud Platform Integration
2 -
cloudalm
1 -
communication
1 -
Compensation Information Management
1 -
Compensation Management
1 -
Compliance
1 -
Compound Employee API
1 -
Configuration
1 -
Connectors
1 -
Consolidation Extension for SAP Analytics Cloud
1 -
Controller-Service-Repository pattern
1 -
Conversion
1 -
Cosine similarity
1 -
cryptocurrency
1 -
CSI
1 -
ctms
1 -
Custom chatbot
3 -
Custom Destination Service
1 -
custom fields
1 -
Customer Experience
1 -
Customer Journey
1 -
Customizing
1 -
Cyber Security
2 -
Data
1 -
Data & Analytics
1 -
Data Aging
1 -
Data Analytics
2 -
Data and Analytics (DA)
1 -
Data Archiving
1 -
Data Back-up
1 -
Data Governance
5 -
Data Integration
2 -
Data Quality
12 -
Data Quality Management
12 -
Data Synchronization
1 -
data transfer
1 -
Data Unleashed
1 -
Data Value
8 -
database tables
1 -
Datasphere
2 -
datenbanksicherung
1 -
dba cockpit
1 -
dbacockpit
1 -
Debugging
2 -
Delimiting Pay Components
1 -
Delta Integrations
1 -
Destination
3 -
Destination Service
1 -
Developer extensibility
1 -
Developing with SAP Integration Suite
1 -
Devops
1 -
digital transformation
1 -
Documentation
1 -
Dot Product
1 -
DQM
1 -
dump database
1 -
dump transaction
1 -
e-Invoice
1 -
E4H Conversion
1 -
Eclipse ADT ABAP Development Tools
2 -
edoc
1 -
edocument
1 -
ELA
1 -
Embedded Consolidation
1 -
Embedding
1 -
Embeddings
1 -
Employee Central
1 -
Employee Central Payroll
1 -
Employee Central Time Off
1 -
Employee Information
1 -
Employee Rehires
1 -
Enable Now
1 -
Enable now manager
1 -
endpoint
1 -
Enhancement Request
1 -
Enterprise Architecture
1 -
ETL Business Analytics with SAP Signavio
1 -
Euclidean distance
1 -
Event Dates
1 -
Event Driven Architecture
1 -
Event Mesh
2 -
Event Reason
1 -
EventBasedIntegration
1 -
EWM
1 -
EWM Outbound configuration
1 -
EWM-TM-Integration
1 -
Existing Event Changes
1 -
Expand
1 -
Expert
2 -
Expert Insights
1 -
Fiori
14 -
Fiori Elements
2 -
Fiori SAPUI5
12 -
Flask
1 -
Full Stack
8 -
Funds Management
1 -
General
1 -
Generative AI
1 -
Getting Started
1 -
GitHub
8 -
Grants Management
1 -
groovy
1 -
GTP
1 -
HANA
5 -
HANA Cloud
2 -
Hana Cloud Database Integration
2 -
HANA DB
1 -
HANA XS Advanced
1 -
Historical Events
1 -
home labs
1 -
HowTo
1 -
HR Data Management
1 -
html5
8 -
Identity cards validation
1 -
idm
1 -
Implementation
1 -
input parameter
1 -
instant payments
1 -
Integration
3 -
Integration Advisor
1 -
Integration Architecture
1 -
Integration Center
1 -
Integration Suite
1 -
intelligent enterprise
1 -
Java
1 -
job
1 -
Job Information Changes
1 -
Job-Related Events
1 -
Job_Event_Information
1 -
joule
4 -
Journal Entries
1 -
Just Ask
1 -
Kerberos for ABAP
8 -
Kerberos for JAVA
8 -
Launch Wizard
1 -
Learning Content
2 -
Life at SAP
1 -
lightning
1 -
Linear Regression SAP HANA Cloud
1 -
local tax regulations
1 -
LP
1 -
Machine Learning
2 -
Marketing
1 -
Master Data
3 -
Master Data Management
14 -
Maxdb
2 -
MDG
1 -
MDGM
1 -
MDM
1 -
Message box.
1 -
Messages on RF Device
1 -
Microservices Architecture
1 -
Microsoft Universal Print
1 -
Middleware Solutions
1 -
Migration
5 -
ML Model Development
1 -
Modeling in SAP HANA Cloud
8 -
Monitoring
3 -
MTA
1 -
Multi-Record Scenarios
1 -
Multiple Event Triggers
1 -
Neo
1 -
New Event Creation
1 -
New Feature
1 -
Newcomer
1 -
NodeJS
2 -
ODATA
2 -
OData APIs
1 -
odatav2
1 -
ODATAV4
1 -
ODBC
1 -
ODBC Connection
1 -
Onpremise
1 -
open source
2 -
OpenAI API
1 -
Oracle
1 -
PaPM
1 -
PaPM Dynamic Data Copy through Writer function
1 -
PaPM Remote Call
1 -
PAS-C01
1 -
Pay Component Management
1 -
PGP
1 -
Pickle
1 -
PLANNING ARCHITECTURE
1 -
Popup in Sap analytical cloud
1 -
PostgrSQL
1 -
POSTMAN
1 -
Process Automation
2 -
Product Updates
4 -
PSM
1 -
Public Cloud
1 -
Python
4 -
Qlik
1 -
Qualtrics
1 -
RAP
3 -
RAP BO
2 -
Record Deletion
1 -
Recovery
1 -
recurring payments
1 -
redeply
1 -
Release
1 -
Remote Consumption Model
1 -
Replication Flows
1 -
Research
1 -
Resilience
1 -
REST
1 -
REST API
1 -
Retagging Required
1 -
Risk
1 -
Rolling Kernel Switch
1 -
route
1 -
rules
1 -
S4 HANA
1 -
S4 HANA Cloud
1 -
S4 HANA On-Premise
1 -
S4HANA
3 -
S4HANA_OP_2023
2 -
SAC
10 -
SAC PLANNING
9 -
SAP
4 -
SAP ABAP
1 -
SAP Advanced Event Mesh
1 -
SAP AI Core
8 -
SAP AI Launchpad
8 -
SAP Analytic Cloud Compass
1 -
Sap Analytical Cloud
1 -
SAP Analytics Cloud
4 -
SAP Analytics Cloud for Consolidation
2 -
SAP Analytics Cloud Story
1 -
SAP analytics clouds
1 -
SAP BAS
1 -
SAP Basis
6 -
SAP BODS
1 -
SAP BODS certification.
1 -
SAP BTP
20 -
SAP BTP Build Work Zone
2 -
SAP BTP Cloud Foundry
5 -
SAP BTP Costing
1 -
SAP BTP CTMS
1 -
SAP BTP Innovation
1 -
SAP BTP Migration Tool
1 -
SAP BTP SDK IOS
1 -
SAP Build
11 -
SAP Build App
1 -
SAP Build apps
1 -
SAP Build CodeJam
1 -
SAP Build Process Automation
3 -
SAP Build work zone
10 -
SAP Business Objects Platform
1 -
SAP Business Technology
2 -
SAP Business Technology Platform (XP)
1 -
sap bw
1 -
SAP CAP
2 -
SAP CDC
1 -
SAP CDP
1 -
SAP Certification
1 -
SAP Cloud ALM
4 -
SAP Cloud Application Programming Model
1 -
SAP Cloud Integration for Data Services
1 -
SAP cloud platform
8 -
SAP Companion
1 -
SAP CPI
3 -
SAP CPI (Cloud Platform Integration)
2 -
SAP CPI Discover tab
1 -
sap credential store
1 -
SAP Customer Data Cloud
1 -
SAP Customer Data Platform
1 -
SAP Data Intelligence
1 -
SAP Data Migration in Retail Industry
1 -
SAP Data Services
1 -
SAP DATABASE
1 -
SAP Dataspher to Non SAP BI tools
1 -
SAP Datasphere
9 -
SAP DRC
1 -
SAP EWM
1 -
SAP Fiori
2 -
SAP Fiori App Embedding
1 -
Sap Fiori Extension Project Using BAS
1 -
SAP GRC
1 -
SAP HANA
1 -
SAP HCM (Human Capital Management)
1 -
SAP HR Solutions
1 -
SAP IDM
1 -
SAP Integration Suite
9 -
SAP Integrations
4 -
SAP iRPA
2 -
SAP Learning Class
1 -
SAP Learning Hub
1 -
SAP Odata
2 -
SAP on Azure
1 -
SAP PartnerEdge
1 -
sap partners
1 -
SAP Password Reset
1 -
SAP PO Migration
1 -
SAP Prepackaged Content
1 -
SAP Process Automation
2 -
SAP Process Integration
2 -
SAP Process Orchestration
1 -
SAP S4HANA
2 -
SAP S4HANA Cloud
1 -
SAP S4HANA Cloud for Finance
1 -
SAP S4HANA Cloud private edition
1 -
SAP Sandbox
1 -
SAP STMS
1 -
SAP SuccessFactors
2 -
SAP SuccessFactors HXM Core
1 -
SAP Time
1 -
SAP TM
2 -
SAP Trading Partner Management
1 -
SAP UI5
1 -
SAP Upgrade
1 -
SAP-GUI
8 -
SAP_COM_0276
1 -
SAPBTP
1 -
SAPCPI
1 -
SAPEWM
1 -
sapmentors
1 -
saponaws
2 -
SAPUI5
4 -
schedule
1 -
Secure Login Client Setup
8 -
security
9 -
Selenium Testing
1 -
SEN
1 -
SEN Manager
1 -
service
1 -
SET_CELL_TYPE
1 -
SET_CELL_TYPE_COLUMN
1 -
SFTP scenario
2 -
Simplex
1 -
Single Sign On
8 -
Singlesource
1 -
SKLearn
1 -
soap
1 -
Software Development
1 -
SOLMAN
1 -
solman 7.2
2 -
Solution Manager
3 -
sp_dumpdb
1 -
sp_dumptrans
1 -
SQL
1 -
sql script
1 -
SSL
8 -
SSO
8 -
Substring function
1 -
SuccessFactors
1 -
SuccessFactors Time Tracking
1 -
Sybase
1 -
system copy method
1 -
System owner
1 -
Table splitting
1 -
Tax Integration
1 -
Technical article
1 -
Technical articles
1 -
Technology Updates
1 -
Technology Updates
1 -
Technology_Updates
1 -
Threats
1 -
Time Collectors
1 -
Time Off
2 -
Tips and tricks
2 -
Tools
1 -
Trainings & Certifications
1 -
Transport in SAP BODS
1 -
Transport Management
1 -
TypeScript
2 -
unbind
1 -
Unified Customer Profile
1 -
UPB
1 -
Use of Parameters for Data Copy in PaPM
1 -
User Unlock
1 -
VA02
1 -
Validations
1 -
Vector Database
1 -
Vector Engine
1 -
Visual Studio Code
1 -
VSCode
1 -
Web SDK
1 -
work zone
1 -
workload
1 -
xsa
1 -
XSA Refresh
1
- « Previous
- Next »
Related Content
- CDS consuming other CDS with virtualElement field has this field empty in Technology Q&A
- Create OData V2 in SEGW with Aggregation Annotation on Entity Type in Technology Q&A
- SAP Datasphere - Space, Data Integration, and Data Modeling Best Practices in Technology Blogs by SAP
- Analytical Query CDS View creation and consumption in RSRT along with publishing OData Services in Technology Blogs by Members
- Recap — SAP Data Unleashed 2024 in Technology Blogs by Members
Top kudoed authors
| User | Count |
|---|---|
| 10 | |
| 9 | |
| 7 | |
| 6 | |
| 4 | |
| 4 | |
| 3 | |
| 3 | |
| 3 | |
| 3 |