
- SAP Community
- Products and Technology
- Technology
- Technology Blogs by SAP
- Augment your Analysis with Smart Discovery
Technology Blogs by SAP
Learn how to extend and personalize SAP applications. Follow the SAP technology blog for insights into SAP BTP, ABAP, SAP Analytics Cloud, SAP HANA, and more.
Turn on suggestions
Auto-suggest helps you quickly narrow down your search results by suggesting possible matches as you type.
Showing results for
former_member73
Explorer
Options
- Subscribe to RSS Feed
- Mark as New
- Mark as Read
- Bookmark
- Subscribe
- Printer Friendly Page
- Report Inappropriate Content
09-07-2019
8:40 PM
Smart Discovery is one of SAP Analytics Cloud’s Augmented Analytics smart features. These smart features augment the analytics process to get you the information you need in less time and with far less manual work. They use machine learning technology to automatically analyze your data, surfacing hidden patterns and complex relationships that can lead to actionable insights.
As a business analyst and story creator, Smart Discovery helps you to understand business drivers behind core KPIs such as revenue, churn, and productivity.
Whether you want a quick way to start your analysis or want to dive deeper into an existing story, Smart Discovery will auto-generate pages of analysis to help you discover insights and answer your business questions.
With Smart Discovery you can:
In SAP Analytics Cloud version 2018.16 we began releasing an update to the existing Smart Discovery functionality. If you don't have the new version yet, don't worry. All subscribers will have access to the new functionality soon.
In this new version you will benefit from:
Now, you can use Smart Discovery to build a comprehensive story for you from scratch.
To start your story with a Smart Discovery, follow these steps:
Smart Discovery will also run within an existing SAP Analytics Cloud story.
To run a Smart Discovery in an existing story, follow these steps:
Once you have selected the desired target measure or dimension to analyze, additional discovery components can be specified under advanced options. The same advanced options are available whether you're creating a new story with Smart Discovery or run it in an existing story.

Version
If you’re working with multiple versions of data (ie. actual, budget, forecast) you'll want to select the version of the data for Smart Discovery to run on.
Record name
To help specify the context of your analysis, you can set a name for the data records you are considering in the discovery. This will enhance the discovery and make it easier to consume by colleagues who are less familiar with the raw data.
In the content on Smart Discovery pages, Analytics Cloud uses the record name indicated in advanced options or defaults to “record(s)” if one has not been specified.

Included Columns
Considering the information in the underlying data model, you may want to specify which measures and dimensions the Machine Learning algorithm of Smart Discovery should consider.

Filters
By adding filters, you’ll reduce the number of records to be analyzed. Filters allow you to choose specific measure and dimension members to include or exclude from the analysis.
The side panel helps you visualize how the filter selection will impact the overall Discovery capacity. You can also choose to allow viewers to use filters while they’re consuming your Smart Discovery.

Smart Discovery automatically generates a rich story composed of four pages: Overview, Key Influencers, Unexpected values, and Simulation. These pages contain sophisticated information that is ready to be consumed. The augmented analytics process means that your story is prepared in just a few minutes, saving your hours of work.
The overview page shares meaningful insights that are automatically generated by SAP Analytics Cloud's machine learning algorithms.
On the overview page you’ll find information on:
The concept of key influencers is important. It helps to explain how machine learning features, including Smart Discovery, work to augment the analytics process.
Key influencers are the dimensions that best explain (or influence) the value of the target measure in the context of the model.
For example, imagine a dataset where “Age” is a key influencer of “Revenue”. This would mean that the variation of age highly correlates with the variation of revenue; be it a positive (i.e. the older the population, the higher revenue) or negative (i.e. the older the population, the lower revenue).
Sometimes, certain key influencers can be removed from the analysis if the correlation is obvious from a business perspective. The real value lies in the key influencers information that may not have otherwise been observed without the machine learning power of the Smart Discovery.
On the Key Influencer page, Smart Discovery presents the top 10 key influencers of the target measure as a ranked bar chart. The top 3 influencers are highlighted.
The quality of the discovery is scored out of five. This is because when the Smart Discovery runs, machine learning algorithms create many possible predictive models. Then, the model that has the most explanatory power for the data provided is selected for the Smart Discovery. The model is scored based on how well it works when applied to new data. A quality score of 5/5 indicates high-quality insights that can be trusted.

Below, you can see how the top three key influencers contribute to the value of the target measure. In this example, the first chart compares Total Expected Revenue (the selected target) for each of the Customer Segment values. The second chart explains the distribution of the target over the whole dataset per Customer Segment.

One of the predictive models created by the Smart Discovery explores any trends in the expected/predicted values for certain attributes, following a calculated regression line. If an actual value diverges from the regression line it is categorized as “unexpected”.

The Simulation page is also based on a calculated regression model. It shows a combination of contributors (influencers) and their impact on your selected target.
The simulation acts as a “what-if” analysis, helping you test the impact of various inputs (dimension/measures). Modify inputs independently or all together. Then, observe if the change positively, negatively or neutrally contributes to the target. You'll dynamically see the delta in percentage between the previous and current value of the total target.
The included waterfall chart helps to visualize the whole configuration. Base Value is a "retro calculation" made for assessing whether the combination of contributing values brings an increase or decrease to the target.

Once you've finished analyzing the results of your Smart Discovery you can save it as a new story or part of your existing story.
Next, you'll want to add comments to highlight the most interesting insights that you've discovered and then share the story with other users in your organization. With augmented analytics capabilities like SAP Analytics Cloud's Smart Discovery, you'll be making better decisions with high-quality insights in no time.
As a business analyst and story creator, Smart Discovery helps you to understand business drivers behind core KPIs such as revenue, churn, and productivity.
Whether you want a quick way to start your analysis or want to dive deeper into an existing story, Smart Discovery will auto-generate pages of analysis to help you discover insights and answer your business questions.
With Smart Discovery you can:
- Identify actionable insights
- Expose the key influencers driving business-critical KPIs
- Analyze outliers to identify impactful decisions
- Predict future outcomes with interactive “what-if” simulations
What's New with Smart Discovery?
In SAP Analytics Cloud version 2018.16 we began releasing an update to the existing Smart Discovery functionality. If you don't have the new version yet, don't worry. All subscribers will have access to the new functionality soon.
Download the updated Smart Discovery documentation
In this new version you will benefit from:
- A more intuitive workflow: use Smart Discovery to build a new story or add Smart Discovery to an existing story
- More charts and descriptive content are included on pre-built story pages
- Explanations for key drivers, unexpected values, and simulated impact on your business
- Integration with SAP Digital Boardroom
- User experience enhancements
- The ability to format and edit the auto-generated charts and calculations
How to use Smart Discovery to Build a Story Automatically
Now, you can use Smart Discovery to build a comprehensive story for you from scratch.
To start your story with a Smart Discovery, follow these steps:
- From the home page, select Create a new story

- Choose Run a Smart Discovery

- Select your datasource

- Choose the measure or dimension you want to learn more about

- Set advanced options (described in next section) and click Run
How to use Smart Discovery in an Existing Story
Smart Discovery will also run within an existing SAP Analytics Cloud story.
To run a Smart Discovery in an existing story, follow these steps:
- From your open story, click on the three dots under the More section in the toolbar and select Smart Discovery from the menu

- Choose the measure or dimension you want to learn more about
- Set advanced options (described in next section) and click Run
Smart Discovery Advanced Options
Once you have selected the desired target measure or dimension to analyze, additional discovery components can be specified under advanced options. The same advanced options are available whether you're creating a new story with Smart Discovery or run it in an existing story.
Version
If you’re working with multiple versions of data (ie. actual, budget, forecast) you'll want to select the version of the data for Smart Discovery to run on.
Record name
To help specify the context of your analysis, you can set a name for the data records you are considering in the discovery. This will enhance the discovery and make it easier to consume by colleagues who are less familiar with the raw data.
In the content on Smart Discovery pages, Analytics Cloud uses the record name indicated in advanced options or defaults to “record(s)” if one has not been specified.
Included Columns
Considering the information in the underlying data model, you may want to specify which measures and dimensions the Machine Learning algorithm of Smart Discovery should consider.
Filters
By adding filters, you’ll reduce the number of records to be analyzed. Filters allow you to choose specific measure and dimension members to include or exclude from the analysis.
The side panel helps you visualize how the filter selection will impact the overall Discovery capacity. You can also choose to allow viewers to use filters while they’re consuming your Smart Discovery.
What does a Smart Discovery Look Like?
Smart Discovery automatically generates a rich story composed of four pages: Overview, Key Influencers, Unexpected values, and Simulation. These pages contain sophisticated information that is ready to be consumed. The augmented analytics process means that your story is prepared in just a few minutes, saving your hours of work.
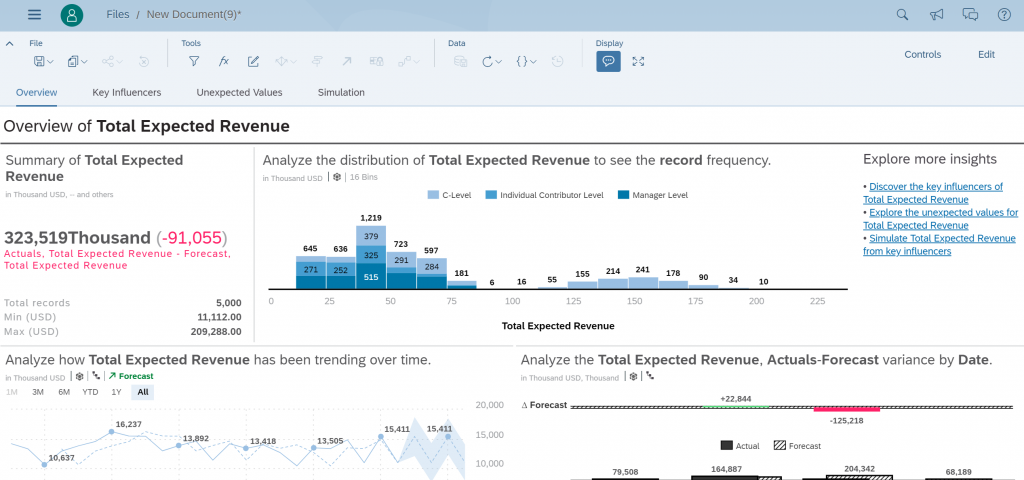
Overview Page
The overview page shares meaningful insights that are automatically generated by SAP Analytics Cloud's machine learning algorithms.
On the overview page you’ll find information on:
- Target measure value and context (data model, applied filter and hierarchy) displayed as a key point with a comparison between actual and forecast versions, as well as the Min, Max and aggregated value (Total)
- Distribution of the target measure for all records, represented by a histogram
- Trends over time with a predictive forecast (provided that you have a time dimension in your metadata)
- Other explanatory charts enriched with Dynamic Text Tokens
Key Influencers Page
The concept of key influencers is important. It helps to explain how machine learning features, including Smart Discovery, work to augment the analytics process.
Key influencers are the dimensions that best explain (or influence) the value of the target measure in the context of the model.
For example, imagine a dataset where “Age” is a key influencer of “Revenue”. This would mean that the variation of age highly correlates with the variation of revenue; be it a positive (i.e. the older the population, the higher revenue) or negative (i.e. the older the population, the lower revenue).
Sometimes, certain key influencers can be removed from the analysis if the correlation is obvious from a business perspective. The real value lies in the key influencers information that may not have otherwise been observed without the machine learning power of the Smart Discovery.
On the Key Influencer page, Smart Discovery presents the top 10 key influencers of the target measure as a ranked bar chart. The top 3 influencers are highlighted.
The quality of the discovery is scored out of five. This is because when the Smart Discovery runs, machine learning algorithms create many possible predictive models. Then, the model that has the most explanatory power for the data provided is selected for the Smart Discovery. The model is scored based on how well it works when applied to new data. A quality score of 5/5 indicates high-quality insights that can be trusted.
Below, you can see how the top three key influencers contribute to the value of the target measure. In this example, the first chart compares Total Expected Revenue (the selected target) for each of the Customer Segment values. The second chart explains the distribution of the target over the whole dataset per Customer Segment.
Unexpected values
One of the predictive models created by the Smart Discovery explores any trends in the expected/predicted values for certain attributes, following a calculated regression line. If an actual value diverges from the regression line it is categorized as “unexpected”.
Simulation
The Simulation page is also based on a calculated regression model. It shows a combination of contributors (influencers) and their impact on your selected target.
The simulation acts as a “what-if” analysis, helping you test the impact of various inputs (dimension/measures). Modify inputs independently or all together. Then, observe if the change positively, negatively or neutrally contributes to the target. You'll dynamically see the delta in percentage between the previous and current value of the total target.
The included waterfall chart helps to visualize the whole configuration. Base Value is a "retro calculation" made for assessing whether the combination of contributing values brings an increase or decrease to the target.
What's Next?
Once you've finished analyzing the results of your Smart Discovery you can save it as a new story or part of your existing story.
Next, you'll want to add comments to highlight the most interesting insights that you've discovered and then share the story with other users in your organization. With augmented analytics capabilities like SAP Analytics Cloud's Smart Discovery, you'll be making better decisions with high-quality insights in no time.
- SAP Managed Tags:
- SAP Analytics Cloud,
- Data and Analytics,
- SAP Business Technology Platform
Labels:
You must be a registered user to add a comment. If you've already registered, sign in. Otherwise, register and sign in.
Labels in this area
-
ABAP CDS Views - CDC (Change Data Capture)
2 -
AI
1 -
Analyze Workload Data
1 -
BTP
1 -
Business and IT Integration
2 -
Business application stu
1 -
Business Technology Platform
1 -
Business Trends
1,658 -
Business Trends
92 -
CAP
1 -
cf
1 -
Cloud Foundry
1 -
Confluent
1 -
Customer COE Basics and Fundamentals
1 -
Customer COE Latest and Greatest
3 -
Customer Data Browser app
1 -
Data Analysis Tool
1 -
data migration
1 -
data transfer
1 -
Datasphere
2 -
Event Information
1,400 -
Event Information
66 -
Expert
1 -
Expert Insights
177 -
Expert Insights
293 -
General
1 -
Google cloud
1 -
Google Next'24
1 -
Kafka
1 -
Life at SAP
780 -
Life at SAP
13 -
Migrate your Data App
1 -
MTA
1 -
Network Performance Analysis
1 -
NodeJS
1 -
PDF
1 -
POC
1 -
Product Updates
4,577 -
Product Updates
341 -
Replication Flow
1 -
RisewithSAP
1 -
SAP BTP
1 -
SAP BTP Cloud Foundry
1 -
SAP Cloud ALM
1 -
SAP Cloud Application Programming Model
1 -
SAP Datasphere
2 -
SAP S4HANA Cloud
1 -
SAP S4HANA Migration Cockpit
1 -
Technology Updates
6,873 -
Technology Updates
419 -
Workload Fluctuations
1
Related Content
- Introducing Blog Series of SAP Signavio Process Insights, discovery edition – An in-depth exploratio in Technology Blogs by SAP
- Unify your process and task mining insights: How SAP UEM by Knoa integrates with SAP Signavio in Technology Blogs by SAP
- SAP HANA Cloud Vector Engine: Quick FAQ Reference in Technology Blogs by SAP
- Webinar Replay: Better Business Outcomes with the SAP HANA Cloud Vector Engine in Technology Blogs by SAP
- Getting ready to start using SAP Focused Run in Technology Blogs by SAP
Top kudoed authors
| User | Count |
|---|---|
| 35 | |
| 25 | |
| 14 | |
| 13 | |
| 7 | |
| 7 | |
| 6 | |
| 6 | |
| 5 | |
| 5 |