
- SAP Community
- Products and Technology
- Technology
- Technology Blogs by SAP
- Configuring KPI tags of an Analytical List Page (A...
Technology Blogs by SAP
Learn how to extend and personalize SAP applications. Follow the SAP technology blog for insights into SAP BTP, ABAP, SAP Analytics Cloud, SAP HANA, and more.
Turn on suggestions
Auto-suggest helps you quickly narrow down your search results by suggesting possible matches as you type.
Showing results for
Employee
Options
- Subscribe to RSS Feed
- Mark as New
- Mark as Read
- Bookmark
- Subscribe
- Printer Friendly Page
- Report Inappropriate Content
08-22-2019
11:44 AM
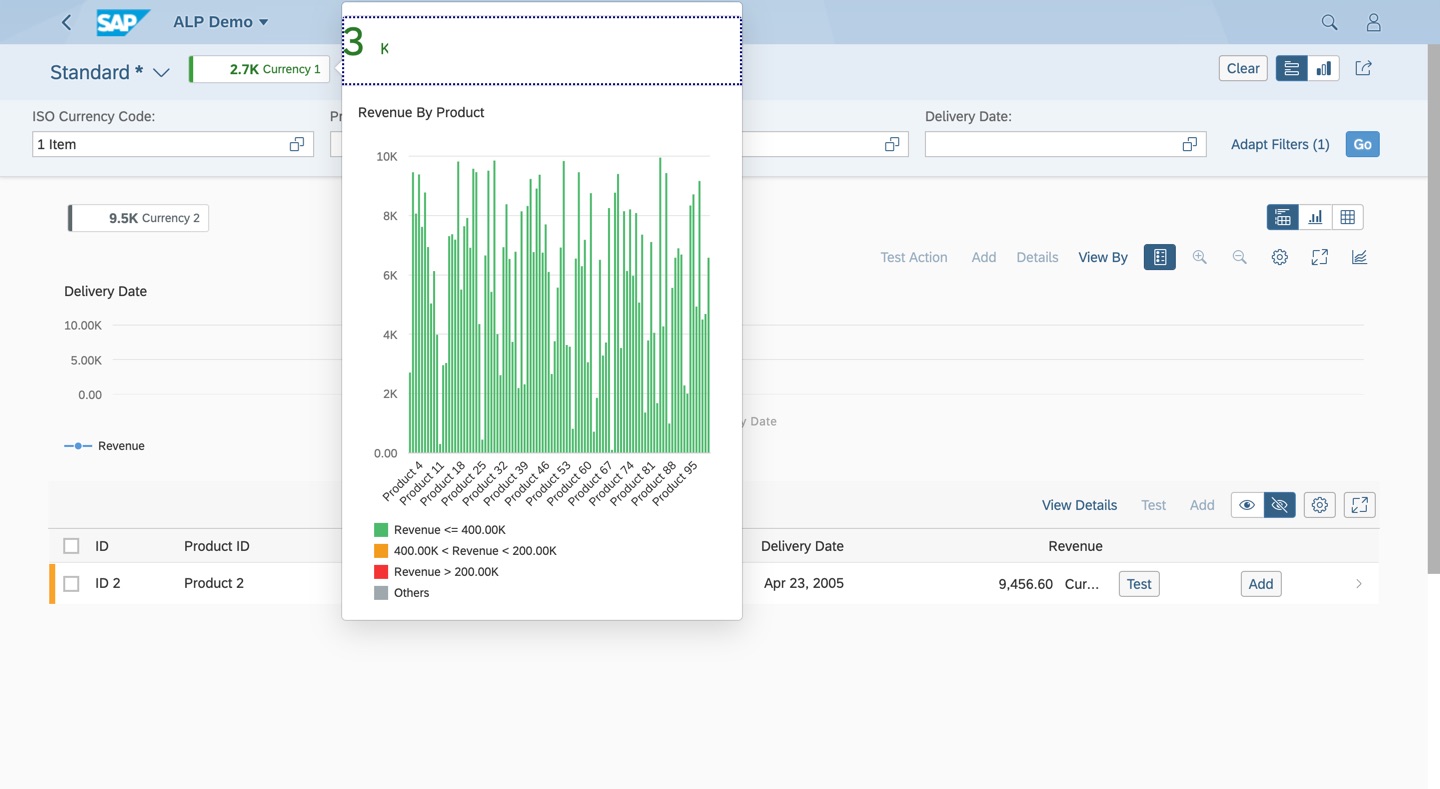
An ALP application allows showing different KPI values as KPI tags. ALP supports two types of KPI tags i.e. filterable and global. As the name suggests global KPI tag value does not depend on the filter selection and are shown on the left corner of the title area of an ALP application. Whereas filterable KPI's value can vary depending on the filter selection and are shown on the left-hand side of the smart chart's toolbar of an ALP application.

On click of any KPI tag, it opens up analytical card pop up which provide more drilled down information about the KPI and which can be further used to navigate to another application for further information.
In this blog, I'll discuss how to configure these KPI tags of an ALP application along with its various settings like criticality.
To create a KPI tag, first, you have to add KPI object inside "keyPerformanceIndicators" property of the application manifest
description of the KPI object attributes:
model --> name of the data model.
entityset --> entity set of the oData service
qualifier --> qualifier for the KPI annotation
filterable --> whether the KPI is of type global or filterable. Default is Global.
In the above example, I'm creating two KPI tags one filterable (KPIRevenue1) and other global (KPIRevenue).
Now, let's have a look at the KPI annotation (KPIRevenue) of our global KPI tag (KPIRevenue):
UI.KPI annotation mainly has properties like SelectionVariant, DataPoint, ID and Details. first 2 we have discussed in my previous blogs. The ID gives the ID to the KPI tag hence you should make sure its unique for each KPI tag in your application else you will land up in duplicate ID error while runtime.
KPIDetails annotation has PresentationVariant property which has Visualization which I have pointed to existing UI.Chart annotation (just for the sake of simplicity, in most of the practical scenario it will point to different chart annotation) which we created while creating visual filters in my previous blog of this blog series.
KPIDetails annotation also has Semantic Object and action property which will be used for intend based navigation when the end-user click on the KPI tag chart pop up.
Similarly, we need to provide UI.KPI annotation for our filterable KPI tag:

If you notice closely every KPI tag have a name displayed. In our case its REV. This name is coming from the title property of our data point annotation. In my example, the name displayed is REV and title which I had given to our #Revenue datapoint is Revenue. The logic behind this is:
The criticality of the KPI tag is derived from the criticality annotation defined for the associated data point. The global KPI tag supports both criticality and CriticalityCalculation annotation whereas filterable KPIs only supports criticality annotation.
In this blog, we successfully configured the KPI tags both global and filterable for our sample ALP application and learnt about different settings for the like name, criticality and navigation of the KPI tags.
In the next blog, I’ll discuss various extensions available to ALP application developer.
On click of any KPI tag, it opens up analytical card pop up which provide more drilled down information about the KPI and which can be further used to navigate to another application for further information.
In this blog, I'll discuss how to configure these KPI tags of an ALP application along with its various settings like criticality.
Prerequisites
- Make sure you have been to the previous blog of this blog series and you have rest of the sample ALP application to add new KPI tags
- For reference, you can clone the GIT repo for this sample application which we are building.
Configuring KPI tag
To create a KPI tag, first, you have to add KPI object inside "keyPerformanceIndicators" property of the application manifest
"keyPerformanceIndicators": {

							"KPIRevenue": {

								"model": "kpi",

								"entitySet": "SEPMRA_C_PD_ProductSalesData",

								"qualifier": "KPIRevenue"

							},

							"KPIRevenue1": {

								"model": "kpi",

								"entitySet": "SEPMRA_C_PD_ProductSalesData",

								"qualifier": "KPIRevenue1",

								"filterable": true

							}

						}
description of the KPI object attributes:
model --> name of the data model.
entityset --> entity set of the oData service
qualifier --> qualifier for the KPI annotation
filterable --> whether the KPI is of type global or filterable. Default is Global.
In the above example, I'm creating two KPI tags one filterable (KPIRevenue1) and other global (KPIRevenue).
Now, let's have a look at the KPI annotation (KPIRevenue) of our global KPI tag (KPIRevenue):
				<Annotation Term="UI.KPI" Qualifier="KPIRevenue">

					<Record>

						<!--<PropertyValue Property="SelectionVariant" Path="@UI.SelectionVariant#CurrencyVisualFilter" />-->

						<PropertyValue Property="DataPoint" Path="@UI.DataPoint#revenue"/>

						<PropertyValue Property="ID" String="KPIRevenue"/>

						<PropertyValue Property="Detail">

							<Record Type="UI.KPIDetailType">

								<PropertyValue Property="DefaultPresentationVariant">

									<Record Type="UI.PresentationVariantType">

										<PropertyValue Property="Visualizations">

											<Collection>

												<AnnotationPath>@UI.Chart#ProductVisualFilter</AnnotationPath>

											</Collection>

										</PropertyValue>

									</Record>

								</PropertyValue>

								<PropertyValue Property="SemanticObject" String="test"/>

								<PropertyValue Property="Action" String="test"/>

							</Record>

						</PropertyValue>

					</Record>

				</Annotation>
UI.KPI annotation mainly has properties like SelectionVariant, DataPoint, ID and Details. first 2 we have discussed in my previous blogs. The ID gives the ID to the KPI tag hence you should make sure its unique for each KPI tag in your application else you will land up in duplicate ID error while runtime.
KPIDetails annotation has PresentationVariant property which has Visualization which I have pointed to existing UI.Chart annotation (just for the sake of simplicity, in most of the practical scenario it will point to different chart annotation) which we created while creating visual filters in my previous blog of this blog series.
KPIDetails annotation also has Semantic Object and action property which will be used for intend based navigation when the end-user click on the KPI tag chart pop up.
Similarly, we need to provide UI.KPI annotation for our filterable KPI tag:
				<Annotation Term="UI.KPI" Qualifier="KPIRevenue1">

					<Record>

						<!--<PropertyValue Property="SelectionVariant" Path="@UI.SelectionVariant#CurrencyVisualFilter" />-->

						<PropertyValue Property="DataPoint" Path="@UI.DataPoint#revenue"/>

						<PropertyValue Property="ID" String="KPIRevenue1"/>

						<PropertyValue Property="Detail">

							<Record Type="UI.KPIDetailType">

								<PropertyValue Property="DefaultPresentationVariant">

									<Record Type="UI.PresentationVariantType">

										<PropertyValue Property="Visualizations">

											<Collection>

												<AnnotationPath>@UI.Chart#CurrencyVisualFilter</AnnotationPath>

											</Collection>

										</PropertyValue>

									</Record>

								</PropertyValue>

								<PropertyValue Property="SemanticObject" String="test"/>

								<PropertyValue Property="Action" String="test"/>

							</Record>

						</PropertyValue>

					</Record>

				</Annotation>
Name displayed on KPI tag
If you notice closely every KPI tag have a name displayed. In our case its REV. This name is coming from the title property of our data point annotation. In my example, the name displayed is REV and title which I had given to our #Revenue datapoint is Revenue. The logic behind this is:
- if the datapoint title is of 1 word then the first 3 letters will be displayed.
- else if the datapoint title is of 2 words then the first letters of both words will be displayed.
- else the first letters of the first 3 words will be displayed.
The criticality of the KPI tag
The criticality of the KPI tag is derived from the criticality annotation defined for the associated data point. The global KPI tag supports both criticality and CriticalityCalculation annotation whereas filterable KPIs only supports criticality annotation.
Conclusion
In this blog, we successfully configured the KPI tags both global and filterable for our sample ALP application and learnt about different settings for the like name, criticality and navigation of the KPI tags.
What Next?
In the next blog, I’ll discuss various extensions available to ALP application developer.
- SAP Managed Tags:
- SAP Fiori
Labels:
You must be a registered user to add a comment. If you've already registered, sign in. Otherwise, register and sign in.
Labels in this area
-
ABAP CDS Views - CDC (Change Data Capture)
2 -
AI
1 -
Analyze Workload Data
1 -
BTP
1 -
Business and IT Integration
2 -
Business application stu
1 -
Business Technology Platform
1 -
Business Trends
1,658 -
Business Trends
105 -
CAP
1 -
cf
1 -
Cloud Foundry
1 -
Confluent
1 -
Customer COE Basics and Fundamentals
1 -
Customer COE Latest and Greatest
3 -
Customer Data Browser app
1 -
Data Analysis Tool
1 -
data migration
1 -
data transfer
1 -
Datasphere
2 -
Event Information
1,400 -
Event Information
69 -
Expert
1 -
Expert Insights
177 -
Expert Insights
332 -
General
1 -
Google cloud
1 -
Google Next'24
1 -
GraphQL
1 -
Kafka
1 -
Life at SAP
780 -
Life at SAP
13 -
Migrate your Data App
1 -
MTA
1 -
Network Performance Analysis
1 -
NodeJS
1 -
PDF
1 -
POC
1 -
Product Updates
4,575 -
Product Updates
377 -
Replication Flow
1 -
REST API
1 -
RisewithSAP
1 -
SAP BTP
1 -
SAP BTP Cloud Foundry
1 -
SAP Cloud ALM
1 -
SAP Cloud Application Programming Model
1 -
SAP Datasphere
2 -
SAP S4HANA Cloud
1 -
SAP S4HANA Migration Cockpit
1 -
Technology Updates
6,872 -
Technology Updates
464 -
Workload Fluctuations
1
Related Content
- Going Beyond Traditional Task Mining in Technology Blogs by SAP
- SAP BTP FAQs - Part 1 (General Topics in SAP BTP) in Technology Blogs by SAP
- Configuring SAP CI/CD pipeline for Deploying ReactJS application in Cloud Foundry in Technology Blogs by Members
- revamped SAP First Guidance Collection in Technology Blogs by Members
- New Card Upload Process and Role-based Filtering of Cards in Work Zone Adv in Technology Blogs by SAP
Top kudoed authors
| User | Count |
|---|---|
| 16 | |
| 12 | |
| 10 | |
| 8 | |
| 7 | |
| 6 | |
| 6 | |
| 5 | |
| 5 | |
| 5 |