
- SAP Community
- Products and Technology
- Technology
- Technology Blogs by Members
- Advanced monitoring and health check with RealCore...
Technology Blogs by Members
Explore a vibrant mix of technical expertise, industry insights, and tech buzz in member blogs covering SAP products, technology, and events. Get in the mix!
Turn on suggestions
Auto-suggest helps you quickly narrow down your search results by suggesting possible matches as you type.
Showing results for
r_herrmann
Active Contributor
Options
- Subscribe to RSS Feed
- Mark as New
- Mark as Read
- Bookmark
- Subscribe
- Printer Friendly Page
- Report Inappropriate Content
08-19-2019
4:36 PM
Although the SAP CPI (as a relatively new product) is constantly being expanded in its product range, there are still a few features missing - especially in the area of monitoring. Be it an overview of the news volume of the last few days / weeks or an overview of the utilization of the system. For that reason (and of course to see what's technically possible), we've developed a small tool called "Realcore CPI Dashboard" which we'd like to share with you.
Since the article is a bit longer, we have divided it into the following sections:
The Realcore SAP CPI Dashboard is a web-based tool (webpage) which enables you to check different parameters of your SAP CPI instance. For sake of easyness the complete tool is packed into one single IFlow which does all the technical handling like information retrieval, API endpoint provision for the web-frontend as also delivering the web-frontend itself. The following screenshot gives a preview of the look'n'feel.

Now let's take a look at the different features. Some are probably self-explanatory where others certainly need an explanation. Also we will highlight from which data sources the values are taken, so that you know how we retieve the data.

The (system) over view tiles show four different values. The CPU average load for the last 1, 5 and 15 minutes, the percentual CPU usage and percentual IO/Wait time (=time the processor idles, because of IO operations like disk write), the system uptime and the message count for the current day.

The system memory and swap section shows the current system (=container which hosts the IFlow) memory and swap size and usage. For both, memory and swap, you can see used, free and total values.
The actual values are read via Groovy Script from the /proc/meminfo system file. Note: For the memory the value "Mem Available" and not "Mem Free" is used. (Mem Free might be smaller than Mem Available, but we thought it's more interesting to find out how much memory could be allocated at all.)

The Java Information card shows the memory available to/for the Java Virtual Machine (JVM) as also some basic information about the used Java version. (Like version, vendor and information about the system user under which the JVM is running.)
Information about the Java version and user information are read via Groovy Script by use of Java's System.getProperty("java.*") functions.
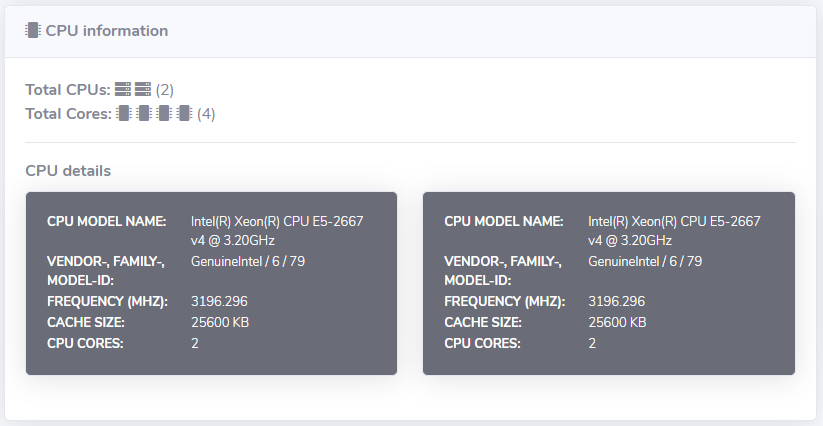
The CPU information card shows information about the CPUs which are assigned to the host/machine which hosts the dashboard IFlow. It gives you a clue what hardware your tenant is running and enables you to get aware of changes on the hostsystem.
The actual values are read via Groovy Script from the /proc/cpuinfo system file.

The Disk usage card shows the usage (used/available space) for different mounts of the Linux machine your CPI is running on. It may help you to identify performance issues.
The information shown is gathered via Java's system.io.File-class and its functions getTotalSpace() and getUsableSpace().

This card shows the total message volume (=all messages regardless of their status) for the last 30 days whereby the interval is split into two halfs. Thus it is easy to compare if your total message volume during the last 14 days is increasing or decreasing compared two the two weeks before.
The message volume is read via REST api call from /MessageProcessingLogs-api.

This card shows the total message volume for the last 48h. It should help you to find out if there are irregularities between the message volume today and the day before.
The message volume is read via REST api call from /MessageProcessingLogs-api.

The Software versions card shows the software versions of different "core" parts of the SAP CPI (like OS, CPI release, Groovy version, ...) as also of each and every SAP CPI module. It may be helpful in two ways. Either if something breaks without any changes done by you (in that case you could check if there was an update which may break your interfaces) or to find out which features of Groovy/Java/XSLT you can use (=because you may want to use bleeding edge features, but aren't sure if CPI already uses the latest Java/Groovy/etc. version).

The logfiles card lists various log files from the CPI and offers three options for each file: 1) Open the log file in a new webbrowser tab. 2) Open the logfile in an in-page popup. 3) Download the log file. It's correct that these are the same files like the ones which are accessable via the SAP CPI monitoring perspective, but with our dashboard you can view them immediately without the need to download and unzip them first. Note: This view is only visible to dashboard users which have the appropriate "log file"-role.
Direct file access via Groovy's/Java's file api.

This view shows information about the current user of the dashboard. It shows the S-User/useraccount which was used to call the dashboard, shows if the user has sufficient rights to show the dashboard at all, the logfiles and the password section and lists all of the roles assigned to the user.
The username is read from SAP CPI's message header. The "Can access"-checks are calculated by the role list. The role list itself is retrieved via the SAP Cloud Platform Authorization and Management API.

The security material view lists all credential pairs from your SAP CPI instance. In addition it is able to show the passwords/secret keys of your credentials. Since this is highly sensitive data this card is disabled by default. Note: This view is only visible to dashboard users which have the appropriate "security material"-role.
The security material list is queried via the web-based /api/v1/UserCredentials-api. The passwords themselve are retrieved via the official ITApiFactory/SecureStoreService-(Groovy Script-)api. If you wonder now, if it's really that easy to read passwords - yes it is. Everyone who has sufficient rights to deploy an IFlow also has enough rights to read out all passwords. (If you're interested to should read this article and its comments.)

The artifact comparison view is my personal favourite of the dashboard's functions. It checks all artifacts from the design perspectives as also from the runtime (=deployed artifacts), matches them by their artifact id and then shows if their version equals or differs. That way you can easily find out where you have artifacts in new versions which aren't deployed yet as also where you might have deleted an artifact but forgotten to undeploy it.
For artifact retrieval two web apis are used: /api/v1/IntegrationRuntimeArtifacts-api and /itspaces/odata/1.0/workspace.svc/ContentEntities.ContentPackages-api (unofficial).

The alerting engine allows you to configure alerting rules which then are checked regularly by the dashboard. If a message or a certificate from the keystore matches one of the confgured rules, an email will be send out. You can configure two typed of alerting rules: messages-based rules and certificate-based rules. Message-based rules can check for specific Iflows, sender- or receiver-systems as also for specific message states. If the combination of filters set up in a rule is matched by a message, an email will be send to the mail receiver, configured in the rule. Certificate-based rules allow you to setup alert emails that will inform you X days before all/a specific certificate looses its validity.
The alerting engine is implemented withing the IFlow itself. Based on a timer/trigger the /MessageProcessingLog-api is called and the results are checked against the given alert rules.
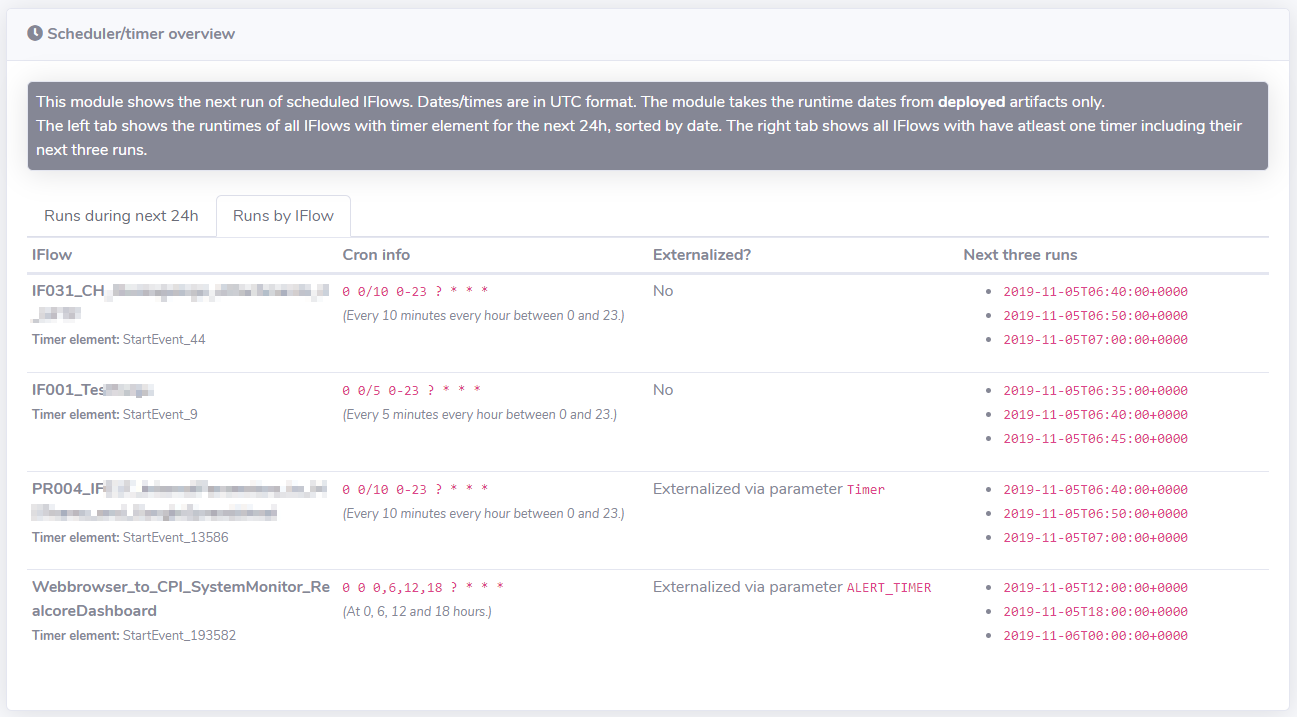
The IFlow scheduler overview helps you with two lists. One list shows all upcoming IFlow run dates based on timer-events for the next 24h. The second list shows all IFlows containing timers and gives some more detailed information like the cron expression, the next three runs and parameters used in the timer configuration.
The runtimes/-dates are calculated via the cron expressions. The cron expressions theirself are read from CPI's runtime node via Groovy script and the OSGi classes. If you want to learn more about OSGi in context of CPI, you should read this article.

The IFlow comparison tool allows you to compare two IFlows with ease. For text-based files it gives you a side-by-side diff view. For binary files it will show differences in CRC (checksums). Thus you can find differences between IFlows in seconds. You can either compare two IFlows from the same tenant or do a remote diff against another SAP CPI tenant.
This feature is based on two sources. For the package and artifact retrieval the (unofficial) /itspaces/odata/1.0/workspace.svc/ContentEntities.ContentPackages-api is used. For getting the content (IFlows) themselves the official /api/v1/IntegrationDesigntimeArtifacts-api is used.
Since this article already isn't the shortest one, we decided to provide the installation and configuration information in a second blog post which can be found here.
Time for a self-critical review: The development of the tool and especially the exploration of the technical / operational limits was definitely interesting. I think our tool definitely adds value to a CPI guy's life.
Nevertheless, there are a few limitations. Of course, values such as CPU utilization or memory consumption only refer to the runtime node on which the dashboard IFlow is deployed on. Since, to my knowledge, you can not influence on which node(-id) an IFlow is deployed, it will be difficult to monitor all nodes. Nevertheless, I think reading RAM and CPU makes sense, because scaling across the nodes should leave all nodes with a similar load. (Attention - this is just my personal guess. At this point, I would love to be teached a better one.)
The source code as also the deployable IFlow was published on Github as OpenSource (MIT licensed). (A small manual how to develop and "compile" the IFlow if you want to make changes will follow.)
Now we reached the end of the first article of this series. I hope you enjoyed reading it and appreciate your feedback, thoughts and comments.
Thanks and credits: I would like to thank...
Since the article is a bit longer, we have divided it into the following sections:
- What is Realcore's SAP CPI Dashboard?
- Features and data sources
- How to install and configure the dashboard?
- Summary
What is Realcore's SAP CPI Dashboard?
The Realcore SAP CPI Dashboard is a web-based tool (webpage) which enables you to check different parameters of your SAP CPI instance. For sake of easyness the complete tool is packed into one single IFlow which does all the technical handling like information retrieval, API endpoint provision for the web-frontend as also delivering the web-frontend itself. The following screenshot gives a preview of the look'n'feel.
Features and data sources
Now let's take a look at the different features. Some are probably self-explanatory where others certainly need an explanation. Also we will highlight from which data sources the values are taken, so that you know how we retieve the data.
System overview
The (system) over view tiles show four different values. The CPU average load for the last 1, 5 and 15 minutes, the percentual CPU usage and percentual IO/Wait time (=time the processor idles, because of IO operations like disk write), the system uptime and the message count for the current day.
Data source(s)
- CPU Load Average: Read and parsed via Groovy Script from /proc/loadavg
- CPU usage and IO wait: Read and calculated via Groovy Script from /proc/stat
- System uptime: Read and parsed via Groovy Script from /proc/uptime
- Messages today: Read via REST call from /MessageProcessingLogs-api
System memory and swap
The system memory and swap section shows the current system (=container which hosts the IFlow) memory and swap size and usage. For both, memory and swap, you can see used, free and total values.
Data source(s)
The actual values are read via Groovy Script from the /proc/meminfo system file. Note: For the memory the value "Mem Available" and not "Mem Free" is used. (Mem Free might be smaller than Mem Available, but we thought it's more interesting to find out how much memory could be allocated at all.)
Java information
The Java Information card shows the memory available to/for the Java Virtual Machine (JVM) as also some basic information about the used Java version. (Like version, vendor and information about the system user under which the JVM is running.)
Data source(s)
Information about the Java version and user information are read via Groovy Script by use of Java's System.getProperty("java.*") functions.
CPU information
The CPU information card shows information about the CPUs which are assigned to the host/machine which hosts the dashboard IFlow. It gives you a clue what hardware your tenant is running and enables you to get aware of changes on the hostsystem.
Data source(s)
The actual values are read via Groovy Script from the /proc/cpuinfo system file.
Disk usage
The Disk usage card shows the usage (used/available space) for different mounts of the Linux machine your CPI is running on. It may help you to identify performance issues.
Data source(s)
The information shown is gathered via Java's system.io.File-class and its functions getTotalSpace() and getUsableSpace().
Message volume / last 30 days
This card shows the total message volume (=all messages regardless of their status) for the last 30 days whereby the interval is split into two halfs. Thus it is easy to compare if your total message volume during the last 14 days is increasing or decreasing compared two the two weeks before.
Data source(s)
The message volume is read via REST api call from /MessageProcessingLogs-api.
Message volume last 2 days
This card shows the total message volume for the last 48h. It should help you to find out if there are irregularities between the message volume today and the day before.
Data source(s)
The message volume is read via REST api call from /MessageProcessingLogs-api.
Software versions
The Software versions card shows the software versions of different "core" parts of the SAP CPI (like OS, CPI release, Groovy version, ...) as also of each and every SAP CPI module. It may be helpful in two ways. Either if something breaks without any changes done by you (in that case you could check if there was an update which may break your interfaces) or to find out which features of Groovy/Java/XSLT you can use (=because you may want to use bleeding edge features, but aren't sure if CPI already uses the latest Java/Groovy/etc. version).
Data source(s)
- Operating system: Read and parsed via Groovy Script from /proc/version-system file
- SAP CPI release: Read via Groovy Script and FrameworkUtil.getBundle()-function
- Groovy release: Read from Groovy-variable GroovySystem.version
- JVM version: Read via Groovy Script by use of System.getProperty("java.version")
- XSLT Engine: Read via XSLT mapping and its select/property function (<xsl:variable name="properties" select="('xsl:version')"/>)
- SAP CPI modules: Read via reflection/FrameworkUtil.getBundle()
Logfiles
The logfiles card lists various log files from the CPI and offers three options for each file: 1) Open the log file in a new webbrowser tab. 2) Open the logfile in an in-page popup. 3) Download the log file. It's correct that these are the same files like the ones which are accessable via the SAP CPI monitoring perspective, but with our dashboard you can view them immediately without the need to download and unzip them first. Note: This view is only visible to dashboard users which have the appropriate "log file"-role.
Data source(s)
Direct file access via Groovy's/Java's file api.
Caller information
This view shows information about the current user of the dashboard. It shows the S-User/useraccount which was used to call the dashboard, shows if the user has sufficient rights to show the dashboard at all, the logfiles and the password section and lists all of the roles assigned to the user.
Data source(s)
The username is read from SAP CPI's message header. The "Can access"-checks are calculated by the role list. The role list itself is retrieved via the SAP Cloud Platform Authorization and Management API.
Security material
The security material view lists all credential pairs from your SAP CPI instance. In addition it is able to show the passwords/secret keys of your credentials. Since this is highly sensitive data this card is disabled by default. Note: This view is only visible to dashboard users which have the appropriate "security material"-role.
Data source(s)
The security material list is queried via the web-based /api/v1/UserCredentials-api. The passwords themselve are retrieved via the official ITApiFactory/SecureStoreService-(Groovy Script-)api. If you wonder now, if it's really that easy to read passwords - yes it is. Everyone who has sufficient rights to deploy an IFlow also has enough rights to read out all passwords. (If you're interested to should read this article and its comments.)
Artifact comparison
The artifact comparison view is my personal favourite of the dashboard's functions. It checks all artifacts from the design perspectives as also from the runtime (=deployed artifacts), matches them by their artifact id and then shows if their version equals or differs. That way you can easily find out where you have artifacts in new versions which aren't deployed yet as also where you might have deleted an artifact but forgotten to undeploy it.
Data source(s)
For artifact retrieval two web apis are used: /api/v1/IntegrationRuntimeArtifacts-api and /itspaces/odata/1.0/workspace.svc/ContentEntities.ContentPackages-api (unofficial).
Alerting engine
The alerting engine allows you to configure alerting rules which then are checked regularly by the dashboard. If a message or a certificate from the keystore matches one of the confgured rules, an email will be send out. You can configure two typed of alerting rules: messages-based rules and certificate-based rules. Message-based rules can check for specific Iflows, sender- or receiver-systems as also for specific message states. If the combination of filters set up in a rule is matched by a message, an email will be send to the mail receiver, configured in the rule. Certificate-based rules allow you to setup alert emails that will inform you X days before all/a specific certificate looses its validity.
Data source(s)
The alerting engine is implemented withing the IFlow itself. Based on a timer/trigger the /MessageProcessingLog-api is called and the results are checked against the given alert rules.
IFlow scheduler overview
The IFlow scheduler overview helps you with two lists. One list shows all upcoming IFlow run dates based on timer-events for the next 24h. The second list shows all IFlows containing timers and gives some more detailed information like the cron expression, the next three runs and parameters used in the timer configuration.
Data source(s)
The runtimes/-dates are calculated via the cron expressions. The cron expressions theirself are read from CPI's runtime node via Groovy script and the OSGi classes. If you want to learn more about OSGi in context of CPI, you should read this article.
IFlow comparison tool
The IFlow comparison tool allows you to compare two IFlows with ease. For text-based files it gives you a side-by-side diff view. For binary files it will show differences in CRC (checksums). Thus you can find differences between IFlows in seconds. You can either compare two IFlows from the same tenant or do a remote diff against another SAP CPI tenant.
Data source(s)
This feature is based on two sources. For the package and artifact retrieval the (unofficial) /itspaces/odata/1.0/workspace.svc/ContentEntities.ContentPackages-api is used. For getting the content (IFlows) themselves the official /api/v1/IntegrationDesigntimeArtifacts-api is used.
How to install and configure the dashboard?
Since this article already isn't the shortest one, we decided to provide the installation and configuration information in a second blog post which can be found here.
Summary
Time for a self-critical review: The development of the tool and especially the exploration of the technical / operational limits was definitely interesting. I think our tool definitely adds value to a CPI guy's life.
Nevertheless, there are a few limitations. Of course, values such as CPU utilization or memory consumption only refer to the runtime node on which the dashboard IFlow is deployed on. Since, to my knowledge, you can not influence on which node(-id) an IFlow is deployed, it will be difficult to monitor all nodes. Nevertheless, I think reading RAM and CPU makes sense, because scaling across the nodes should leave all nodes with a similar load. (Attention - this is just my personal guess. At this point, I would love to be teached a better one.)
The source code as also the deployable IFlow was published on Github as OpenSource (MIT licensed). (A small manual how to develop and "compile" the IFlow if you want to make changes will follow.)
Now we reached the end of the first article of this series. I hope you enjoyed reading it and appreciate your feedback, thoughts and comments.
Thanks and credits: I would like to thank...
- engswee.yeoh for his engagement for the community (and his XPI tools) - you influenced me a lot.
- 7a519509aed84a2c9e6f627841825b5a for his CPI tracker which inspired me to build this tool.
- Former Member for his excellent article on exploring SAP CPI's file system.
- SAP Managed Tags:
- SAP Integration Suite,
- SAP BTP Security,
- Cloud Integration,
- SAP Business Technology Platform
28 Comments
You must be a registered user to add a comment. If you've already registered, sign in. Otherwise, register and sign in.
Labels in this area
-
"automatische backups"
1 -
"regelmäßige sicherung"
1 -
"TypeScript" "Development" "FeedBack"
1 -
505 Technology Updates 53
1 -
ABAP
14 -
ABAP API
1 -
ABAP CDS Views
2 -
ABAP CDS Views - BW Extraction
1 -
ABAP CDS Views - CDC (Change Data Capture)
1 -
ABAP class
2 -
ABAP Cloud
2 -
ABAP Development
5 -
ABAP in Eclipse
1 -
ABAP Platform Trial
1 -
ABAP Programming
2 -
abap technical
1 -
absl
2 -
access data from SAP Datasphere directly from Snowflake
1 -
Access data from SAP datasphere to Qliksense
1 -
Accrual
1 -
action
1 -
adapter modules
1 -
Addon
1 -
Adobe Document Services
1 -
ADS
1 -
ADS Config
1 -
ADS with ABAP
1 -
ADS with Java
1 -
ADT
2 -
Advance Shipping and Receiving
1 -
Advanced Event Mesh
3 -
AEM
1 -
AI
7 -
AI Launchpad
1 -
AI Projects
1 -
AIML
9 -
Alert in Sap analytical cloud
1 -
Amazon S3
1 -
Analytical Dataset
1 -
Analytical Model
1 -
Analytics
1 -
Analyze Workload Data
1 -
annotations
1 -
API
1 -
API and Integration
3 -
API Call
2 -
Application Architecture
1 -
Application Development
5 -
Application Development for SAP HANA Cloud
3 -
Applications and Business Processes (AP)
1 -
Artificial Intelligence
1 -
Artificial Intelligence (AI)
5 -
Artificial Intelligence (AI) 1 Business Trends 363 Business Trends 8 Digital Transformation with Cloud ERP (DT) 1 Event Information 462 Event Information 15 Expert Insights 114 Expert Insights 76 Life at SAP 418 Life at SAP 1 Product Updates 4
1 -
Artificial Intelligence (AI) blockchain Data & Analytics
1 -
Artificial Intelligence (AI) blockchain Data & Analytics Intelligent Enterprise
1 -
Artificial Intelligence (AI) blockchain Data & Analytics Intelligent Enterprise Oil Gas IoT Exploration Production
1 -
Artificial Intelligence (AI) blockchain Data & Analytics Intelligent Enterprise sustainability responsibility esg social compliance cybersecurity risk
1 -
ASE
1 -
ASR
2 -
ASUG
1 -
Attachments
1 -
Authorisations
1 -
Automating Processes
1 -
Automation
2 -
aws
2 -
Azure
1 -
Azure AI Studio
1 -
B2B Integration
1 -
Backorder Processing
1 -
Backup
1 -
Backup and Recovery
1 -
Backup schedule
1 -
BADI_MATERIAL_CHECK error message
1 -
Bank
1 -
BAS
1 -
basis
2 -
Basis Monitoring & Tcodes with Key notes
2 -
Batch Management
1 -
BDC
1 -
Best Practice
1 -
bitcoin
1 -
Blockchain
3 -
bodl
1 -
BOP in aATP
1 -
BOP Segments
1 -
BOP Strategies
1 -
BOP Variant
1 -
BPC
1 -
BPC LIVE
1 -
BTP
12 -
BTP Destination
2 -
Business AI
1 -
Business and IT Integration
1 -
Business application stu
1 -
Business Application Studio
1 -
Business Architecture
1 -
Business Communication Services
1 -
Business Continuity
1 -
Business Data Fabric
3 -
Business Partner
12 -
Business Partner Master Data
10 -
Business Technology Platform
2 -
Business Trends
4 -
CA
1 -
calculation view
1 -
CAP
3 -
Capgemini
1 -
CAPM
1 -
Catalyst for Efficiency: Revolutionizing SAP Integration Suite with Artificial Intelligence (AI) and
1 -
CCMS
2 -
CDQ
12 -
CDS
2 -
Cental Finance
1 -
Certificates
1 -
CFL
1 -
Change Management
1 -
chatbot
1 -
chatgpt
3 -
CL_SALV_TABLE
2 -
Class Runner
1 -
Classrunner
1 -
Cloud ALM Monitoring
1 -
Cloud ALM Operations
1 -
cloud connector
1 -
Cloud Extensibility
1 -
Cloud Foundry
4 -
Cloud Integration
6 -
Cloud Platform Integration
2 -
cloudalm
1 -
communication
1 -
Compensation Information Management
1 -
Compensation Management
1 -
Compliance
1 -
Compound Employee API
1 -
Configuration
1 -
Connectors
1 -
Consolidation Extension for SAP Analytics Cloud
2 -
Control Indicators.
1 -
Controller-Service-Repository pattern
1 -
Conversion
1 -
Cosine similarity
1 -
cryptocurrency
1 -
CSI
1 -
ctms
1 -
Custom chatbot
3 -
Custom Destination Service
1 -
custom fields
1 -
Customer Experience
1 -
Customer Journey
1 -
Customizing
1 -
cyber security
3 -
cybersecurity
1 -
Data
1 -
Data & Analytics
1 -
Data Aging
1 -
Data Analytics
2 -
Data and Analytics (DA)
1 -
Data Archiving
1 -
Data Back-up
1 -
Data Flow
1 -
Data Governance
5 -
Data Integration
2 -
Data Quality
12 -
Data Quality Management
12 -
Data Synchronization
1 -
data transfer
1 -
Data Unleashed
1 -
Data Value
8 -
database tables
1 -
Datasphere
3 -
datenbanksicherung
1 -
dba cockpit
1 -
dbacockpit
1 -
Debugging
2 -
Delimiting Pay Components
1 -
Delta Integrations
1 -
Destination
3 -
Destination Service
1 -
Developer extensibility
1 -
Developing with SAP Integration Suite
1 -
Devops
1 -
digital transformation
1 -
Documentation
1 -
Dot Product
1 -
DQM
1 -
dump database
1 -
dump transaction
1 -
e-Invoice
1 -
E4H Conversion
1 -
Eclipse ADT ABAP Development Tools
2 -
edoc
1 -
edocument
1 -
ELA
1 -
Embedded Consolidation
1 -
Embedding
1 -
Embeddings
1 -
Employee Central
1 -
Employee Central Payroll
1 -
Employee Central Time Off
1 -
Employee Information
1 -
Employee Rehires
1 -
Enable Now
1 -
Enable now manager
1 -
endpoint
1 -
Enhancement Request
1 -
Enterprise Architecture
1 -
ETL Business Analytics with SAP Signavio
1 -
Euclidean distance
1 -
Event Dates
1 -
Event Driven Architecture
1 -
Event Mesh
2 -
Event Reason
1 -
EventBasedIntegration
1 -
EWM
1 -
EWM Outbound configuration
1 -
EWM-TM-Integration
1 -
Existing Event Changes
1 -
Expand
1 -
Expert
2 -
Expert Insights
2 -
Exploits
1 -
Fiori
14 -
Fiori Elements
2 -
Fiori SAPUI5
12 -
Flask
1 -
Full Stack
8 -
Funds Management
1 -
General
1 -
General Splitter
1 -
Generative AI
1 -
Getting Started
1 -
GitHub
8 -
Grants Management
1 -
GraphQL
1 -
groovy
1 -
GTP
1 -
HANA
6 -
HANA Cloud
2 -
Hana Cloud Database Integration
2 -
HANA DB
2 -
HANA XS Advanced
1 -
Historical Events
1 -
home labs
1 -
HowTo
1 -
HR Data Management
1 -
html5
8 -
HTML5 Application
1 -
Identity cards validation
1 -
idm
1 -
Implementation
1 -
input parameter
1 -
instant payments
1 -
Integration
3 -
Integration Advisor
1 -
Integration Architecture
1 -
Integration Center
1 -
Integration Suite
1 -
intelligent enterprise
1 -
iot
1 -
Java
1 -
job
1 -
Job Information Changes
1 -
Job-Related Events
1 -
Job_Event_Information
1 -
joule
4 -
Journal Entries
1 -
Just Ask
1 -
Kerberos for ABAP
8 -
Kerberos for JAVA
8 -
KNN
1 -
Launch Wizard
1 -
Learning Content
2 -
Life at SAP
5 -
lightning
1 -
Linear Regression SAP HANA Cloud
1 -
Loading Indicator
1 -
local tax regulations
1 -
LP
1 -
Machine Learning
2 -
Marketing
1 -
Master Data
3 -
Master Data Management
14 -
Maxdb
2 -
MDG
1 -
MDGM
1 -
MDM
1 -
Message box.
1 -
Messages on RF Device
1 -
Microservices Architecture
1 -
Microsoft Universal Print
1 -
Middleware Solutions
1 -
Migration
5 -
ML Model Development
1 -
Modeling in SAP HANA Cloud
8 -
Monitoring
3 -
MTA
1 -
Multi-Record Scenarios
1 -
Multiple Event Triggers
1 -
Myself Transformation
1 -
Neo
1 -
New Event Creation
1 -
New Feature
1 -
Newcomer
1 -
NodeJS
2 -
ODATA
2 -
OData APIs
1 -
odatav2
1 -
ODATAV4
1 -
ODBC
1 -
ODBC Connection
1 -
Onpremise
1 -
open source
2 -
OpenAI API
1 -
Oracle
1 -
PaPM
1 -
PaPM Dynamic Data Copy through Writer function
1 -
PaPM Remote Call
1 -
PAS-C01
1 -
Pay Component Management
1 -
PGP
1 -
Pickle
1 -
PLANNING ARCHITECTURE
1 -
Popup in Sap analytical cloud
1 -
PostgrSQL
1 -
POSTMAN
1 -
Process Automation
2 -
Product Updates
4 -
PSM
1 -
Public Cloud
1 -
Python
4 -
Qlik
1 -
Qualtrics
1 -
RAP
3 -
RAP BO
2 -
Record Deletion
1 -
Recovery
1 -
recurring payments
1 -
redeply
1 -
Release
1 -
Remote Consumption Model
1 -
Replication Flows
1 -
research
1 -
Resilience
1 -
REST
1 -
REST API
2 -
Retagging Required
1 -
Risk
1 -
Rolling Kernel Switch
1 -
route
1 -
rules
1 -
S4 HANA
1 -
S4 HANA Cloud
1 -
S4 HANA On-Premise
1 -
S4HANA
3 -
S4HANA_OP_2023
2 -
SAC
10 -
SAC PLANNING
9 -
SAP
4 -
SAP ABAP
1 -
SAP Advanced Event Mesh
1 -
SAP AI Core
8 -
SAP AI Launchpad
8 -
SAP Analytic Cloud Compass
1 -
Sap Analytical Cloud
1 -
SAP Analytics Cloud
4 -
SAP Analytics Cloud for Consolidation
3 -
SAP Analytics Cloud Story
1 -
SAP analytics clouds
1 -
SAP BAS
1 -
SAP Basis
6 -
SAP BODS
1 -
SAP BODS certification.
1 -
SAP BTP
21 -
SAP BTP Build Work Zone
2 -
SAP BTP Cloud Foundry
6 -
SAP BTP Costing
1 -
SAP BTP CTMS
1 -
SAP BTP Innovation
1 -
SAP BTP Migration Tool
1 -
SAP BTP SDK IOS
1 -
SAP Build
11 -
SAP Build App
1 -
SAP Build apps
1 -
SAP Build CodeJam
1 -
SAP Build Process Automation
3 -
SAP Build work zone
10 -
SAP Business Objects Platform
1 -
SAP Business Technology
2 -
SAP Business Technology Platform (XP)
1 -
sap bw
1 -
SAP CAP
2 -
SAP CDC
1 -
SAP CDP
1 -
SAP CDS VIEW
1 -
SAP Certification
1 -
SAP Cloud ALM
4 -
SAP Cloud Application Programming Model
1 -
SAP Cloud Integration for Data Services
1 -
SAP cloud platform
8 -
SAP Companion
1 -
SAP CPI
3 -
SAP CPI (Cloud Platform Integration)
2 -
SAP CPI Discover tab
1 -
sap credential store
1 -
SAP Customer Data Cloud
1 -
SAP Customer Data Platform
1 -
SAP Data Intelligence
1 -
SAP Data Migration in Retail Industry
1 -
SAP Data Services
1 -
SAP DATABASE
1 -
SAP Dataspher to Non SAP BI tools
1 -
SAP Datasphere
9 -
SAP DRC
1 -
SAP EWM
1 -
SAP Fiori
3 -
SAP Fiori App Embedding
1 -
Sap Fiori Extension Project Using BAS
1 -
SAP GRC
1 -
SAP HANA
1 -
SAP HCM (Human Capital Management)
1 -
SAP HR Solutions
1 -
SAP IDM
1 -
SAP Integration Suite
9 -
SAP Integrations
4 -
SAP iRPA
2 -
SAP LAGGING AND SLOW
1 -
SAP Learning Class
1 -
SAP Learning Hub
1 -
SAP Odata
2 -
SAP on Azure
1 -
SAP PartnerEdge
1 -
sap partners
1 -
SAP Password Reset
1 -
SAP PO Migration
1 -
SAP Prepackaged Content
1 -
SAP Process Automation
2 -
SAP Process Integration
2 -
SAP Process Orchestration
1 -
SAP S4HANA
2 -
SAP S4HANA Cloud
1 -
SAP S4HANA Cloud for Finance
1 -
SAP S4HANA Cloud private edition
1 -
SAP Sandbox
1 -
SAP STMS
1 -
SAP successfactors
3 -
SAP SuccessFactors HXM Core
1 -
SAP Time
1 -
SAP TM
2 -
SAP Trading Partner Management
1 -
SAP UI5
1 -
SAP Upgrade
1 -
SAP Utilities
1 -
SAP-GUI
8 -
SAP_COM_0276
1 -
SAPBTP
1 -
SAPCPI
1 -
SAPEWM
1 -
sapmentors
1 -
saponaws
2 -
SAPS4HANA
1 -
SAPUI5
5 -
schedule
1 -
Script Operator
1 -
Secure Login Client Setup
8 -
security
9 -
Selenium Testing
1 -
Self Transformation
1 -
Self-Transformation
1 -
SEN
1 -
SEN Manager
1 -
service
1 -
SET_CELL_TYPE
1 -
SET_CELL_TYPE_COLUMN
1 -
SFTP scenario
2 -
Simplex
1 -
Single Sign On
8 -
Singlesource
1 -
SKLearn
1 -
Slow loading
1 -
soap
1 -
Software Development
1 -
SOLMAN
1 -
solman 7.2
2 -
Solution Manager
3 -
sp_dumpdb
1 -
sp_dumptrans
1 -
SQL
1 -
sql script
1 -
SSL
8 -
SSO
8 -
Substring function
1 -
SuccessFactors
1 -
SuccessFactors Platform
1 -
SuccessFactors Time Tracking
1 -
Sybase
1 -
system copy method
1 -
System owner
1 -
Table splitting
1 -
Tax Integration
1 -
Technical article
1 -
Technical articles
1 -
Technology Updates
14 -
Technology Updates
1 -
Technology_Updates
1 -
terraform
1 -
Threats
2 -
Time Collectors
1 -
Time Off
2 -
Time Sheet
1 -
Time Sheet SAP SuccessFactors Time Tracking
1 -
Tips and tricks
2 -
toggle button
1 -
Tools
1 -
Trainings & Certifications
1 -
Transformation Flow
1 -
Transport in SAP BODS
1 -
Transport Management
1 -
TypeScript
2 -
ui designer
1 -
unbind
1 -
Unified Customer Profile
1 -
UPB
1 -
Use of Parameters for Data Copy in PaPM
1 -
User Unlock
1 -
VA02
1 -
Validations
1 -
Vector Database
2 -
Vector Engine
1 -
Visual Studio Code
1 -
VSCode
1 -
Vulnerabilities
1 -
Web SDK
1 -
work zone
1 -
workload
1 -
xsa
1 -
XSA Refresh
1
- « Previous
- Next »
Related Content
- Hack2Build on Business AI – Highlighted Use Cases in Technology Blogs by SAP
- Setup of Synthetic User Monitoring in SAP Cloud ALM in Technology Blogs by Members
- Exploring SAP Cloud ALM and its functionalities in Technology Blogs by Members
- SAP HANA Cloud provisioning in Kyma Runtime Environment in Technology Blogs by SAP
- Kyma Integration with SAP Cloud Logging. Part 1: Introduction and shipping Logs in Technology Blogs by SAP
Top kudoed authors
| User | Count |
|---|---|
| 8 | |
| 5 | |
| 5 | |
| 4 | |
| 4 | |
| 4 | |
| 4 | |
| 4 | |
| 3 | |
| 3 |