
- SAP Community
- Products and Technology
- Technology
- Technology Blogs by SAP
- Focused Insights Strategic Dashboard
Technology Blogs by SAP
Learn how to extend and personalize SAP applications. Follow the SAP technology blog for insights into SAP BTP, ABAP, SAP Analytics Cloud, SAP HANA, and more.
Turn on suggestions
Auto-suggest helps you quickly narrow down your search results by suggesting possible matches as you type.
Showing results for
Product and Topic Expert
Options
- Subscribe to RSS Feed
- Mark as New
- Mark as Read
- Bookmark
- Subscribe
- Printer Friendly Page
- Report Inappropriate Content
07-10-2019
10:11 AM

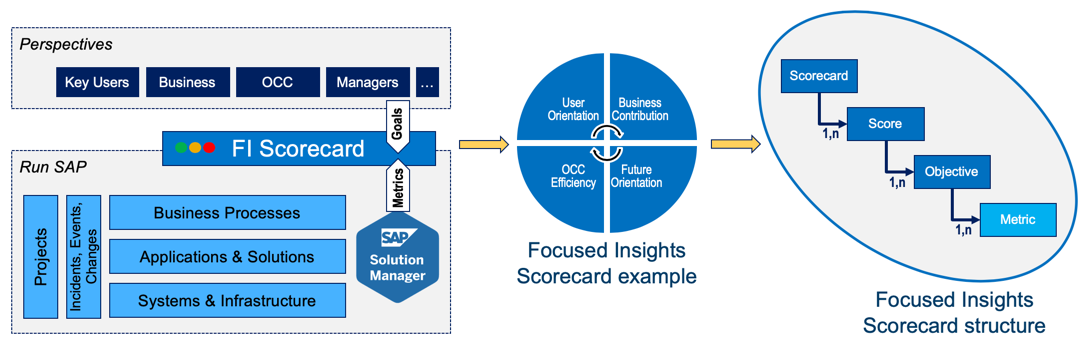
Focused Insights for SAP Solution Manager allow you to create and publish, without coding, synthetic web reports and dashboards that show the key indicators of your SAP landscape.
Focused Insights targets RunSAP methodology and the IT Operations as well as the complete lifecycle of the applications from blueprint to the maintenance and Continuous Improvement process. It benefits to anyone with a connexion to the IT department, experts, managers or executives in the IT or Business Department.
Strategic Dashboard
Strategic Dashboard is one of the models included with Focused Insights. Strategic Dashboard or IT Scorecard helps align your organisation with the corporate goals. It reports automatically on the status and measures the progress of your IT services. It is fully customisable with you own structure and business wording and matches your objectives with the actual technical metrics collected from the landscape.
In the following we’ll show the steps to configure a simple Score.
Define your KPIs
At the core of the Scorecard definition process stands the Key Performance Indicators (KPIS). The KPI is the link between your corporate goals, your organisation objectives and the reality of your IT services measured by the technical metrics; it is critical to choose the right ones for the successful completion of the project. In this exercise, people from diverse groups with a different perspective of the Service should agree on a set of significant and measurable KPIs.

In the following naïve example, we consider a simple development landscape composed of an ABAP development system and an ABAP QA system.
We build a single Score “System Health” which consists of the following KPIs:
- Availability: average availability of the systems part of the landscape
- Performance: average performance of the systems part of the landscape
- Events Management: number and average duration of the alerts
Define your technical metrics
Now that we have defined the Score and KPIs, we need to assign them actual technical metrics available from Focused Insights. The table below shows the chosen matching:
| KPI | Metrics |
| Availability |
|
| Performance |
|
| Events Management |
|
Publish KPIs Catalog from OCC Dashboard
The KPIs and technical metrics are built with the OCC Dashboard as it is this dashboard which provides an access to all Focused Insights data sources (data providers).
There is a one to one relationship between a KPI in the Strategic Dashboard and a gadget in the OCC Dashboard. Thus, as a good practice, we create one OCC Dashboard Instance per Strategic Score, with each gadget corresponding to a KPI of the Score. In our example, we have only one Score “System Health” with 3 KPIs (“Availability”, “Performance”, “Events Management”), thus, we create a new OCC Dashboard Instance called “System Health”, with 3 gadgets.
Although this structure seems appropriate in most cases, there is no obligation to stick to it; For example, the OCC Dashboard instance might contain additional gadgets that provide detailed information (see also OCC jump-in).
The table below indicates the data providers used to collect the technical metrics identified above.
| KPI | Metrics | OCC Data Provider |
| Availability | Availability in % of a technical system | /STDF/DP_SYSMON |
| Performance | Average ABAP Dialog Response Time of a technical system | /STDF/DP_SYSMON |
| Average response time of transaction SE80 | /STDF/DP_TRANSACTION | |
| Events Management | Number of red alerts created | /STDF/DP_MAI_ALERTING |
| Number of yellow alerts created | /STDF/DP_MAI_ALERTING | |
| Average alert processing time | /STDF/DP_MAI_ALERTING |
Remarks:
- You can use any of the OCC data providers with their corresponding filters and key figures to build your Strategic Dashboard, without limitation.
- The time period selected in the OCC Dashboard and the type of visualisation (renderer) are not important and won’t affect the Catalog we are building.

Default targets
This is of course essential to define right targets in order to get a meaningful reporting. The targets are your expectation for the metric (maximum or minimum value). If a value is below (maximum) or above (minimum) the target, then it is considered compliant, otherwise, the value is considered not compliant.
The targets are set in the Strategic Dashboard, but the default values come from the OCC Dashboard. We used properties “Trend” and “Red Threshold” of the OCC query to set the default value for the target. Property “Trend” indicates if the target is a minimum (Trend = Up) or a maximum (Trend = Down), while property “Red Threshold” contains the actual default value for the target. Again, what is defined as default value in the OCC Catalog can be redefined later from the Strategic Dashboard.

Once the OCC dashboard is ready, we export it as a catalog by marking it as “discoverable” in the top left corner.

About the time period
Strategic Dashboard is a monthly report with daily granularity. It provides 12 months of historical data, including or not the current month depending on your preference.
To use a metric with this dashboard, you must make sure that the corresponding data provider supports daily resolution. However, the time frame and resolution configured in the OCC Dashboard instance have no impact on the Catalog and on the Strategic Dashboard and can be freely chosen.
Build the Strategic dashboard
If you meet the prerequisites and have sufficient authorisation, you can create a new Strategic Dashboard instance. When you access the configuration application from the launchpad (little grey wheel), the empty SAPUI5 application is now opened (empty) instead of the Web Dynpro configuration application.

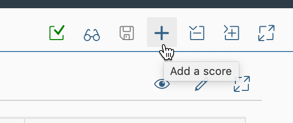
From the SAPUI5 application, you should see the “+” button on the top right corner of the dashboard; just press the “+” button to create a new instance.


Create a new Score “System Health” by pressing on the dedicated “+” button.

Once the Score “System Health” is added to the instance, the KPI Catalog appears automatically on the right side of the screen. The KPI Catalog belongs to the personalisation menu accessible from the top right corner of the screen.

Expand the KPI Catalog “System Health” and select the 3 KPIs “Availabilty”, “Performance” and “Events Management” defined previously, then press the button “Add KPI(s) selected”. The 3 KPIs are added to the score “System Health”.

Remarks:
- The name of Scores, KPIs and metrics can be easily changed in the Strategic Dashboard. In the example above, the KPI "Alerts" coming from the catalog is renamed "Events Management".
- There is no dependency between the Strategic Dashboard instance and the catalog(s). The content of the catalog is just copied into the Strategic Dashboard instance like a template, if the catalog is changed later on, the Strategic Dashboard instance won't be updated; the catalog must be applied again (delete the KPIs and add them again to the dashboard).
Targets, Thresholds and Groups
Once the Score and its KPIs are created, it is essential to set the targets, as the compliance scores will be calculated against these targets.
The targets are entered in the Metrics Table; each metric accepts its own target. This means that if you want to measure average system availability across multiple systems, you can set a different target for each system.
With the targets, you can also define the color thresholds for Scores and KPIs. The color threshold indicates when a compliance percentage should be displayed in green, orange or red. Two thresholds must be defined: "Green To Yellow" & "Yellow To Red"; there are independent for each Score and KPI.
With groups, you can partition a KPI between multiple custom dimensions. For example, you may want to partition your KPI "Availability" across different systems or locations. You may also want to partition the KPI "Performance" into different products, with each product having its own set of transactions. Once defined, the Governance View uses groups to break down the compliance of your Scores and KPIs.

Trigger the data collection
Once the dashboard instance is ready, we need to save it and trigger the collection of data. The data collection can be triggered with the magic stick button. Data collection may take some time depending on the size of the dashboard and the performance of Solution Manager.

You should trigger the data collection after the initial creation of your instance but also whenever you change it. The data collection not only loads historical data (close to 3 years of data when it is available in the BW) but also calculates percentages of compliance; thus, any change to the instance configuration (such as adjusting a metric target) could modify the compliance percentage.
On the top right of the screen an indicator tells you if the data collection is running or if it is completed.

Once the dashboard instance is stable (no more changes on the configuration), you no longer need to manually trigger data collection anymore; the daily job “/STDF/SCR_JOB takes over.
For more detailed information about the Strategic Dashboard, please check the official documentation. As a summary, the following features are offered:
- Fully customisable IT Scorecard
- 12 Months of historical data with month by month navigation and daily granularity
- History View to track service progress over time
- Governance View to break down a Score based on your own organisational dimensions (landscape, team, location, product…)
- KPI Compliance View to understand the value of compliance and quickly identify the metrics that influence it
- Custom Catalogs leveraging all the metrics available in Focused Insights and SAP Solution Manager
- Jump-in to custom OCC Dashboard for detail reporting

Prerequisites
Strategic Dashboard with Catalog support is available from Focused Insights SP4. You need the add-on ST-OST 200 SP4 for SAP Solution Manager 7.2 SP9.
Focused Insights (http://support.sap.com/focused-insights)
Focused solutions for SAP Solution Manager, is the extension concept for SAP Solution Manager, with the idea of helping our customers meet their particular innovation needs on an individual basis, without the need for homegrown software or partner solutions.
The goal of Focused Insights is to build and distribute powerful customer-specific dashboards in minutes using state-of-the-art user experience.
The content delivered with Focused Insights has been designed to deliver, in real time, the most relevant and valuable information to the right people. While it provides full transparency of information stored inside SAP Solution Manager, it also takes into account the best practices and experience gained during numerous custom projects, offering a set of prepackaged dashboards tailored to your needs.
SAP Focused Insights offers specialized dashboards for experts as well as management or non-technical users. Whether they address the CIO or an expert, dashboards remain consistent among each other since they rely on the same data sources mixed up and presented in different granularities or aggregation levels
Focused Insights comes with a rich content. It fully exploits the huge amount of data stored inside SAP Solution Manager. Metrics produced by the activation of a scenario, whether it is IT or business related, become immediately available to the prepackaged dashboards. Raw metrics can be grouped or combined to produce advanced metrics and high level KPIs.
Labels:
- 4. SAP Solution Manager Value Report
- analytics
- availability
- CEO dashboard
- Compliance
- Dashboard
- dashboards
- focused solutions
- Focused Solutions for SAP Solution Manager
- IT Operation excellence
- IT scorecard
- it service management
- kpis
- occ
- operation control center
- Performance
- runsap
- RunSAP like a factory
- SAP
- SAP Solution Manager
- scorecard
- strategic dashboard
2 Comments
You must be a registered user to add a comment. If you've already registered, sign in. Otherwise, register and sign in.
Labels in this area
-
ABAP CDS Views - CDC (Change Data Capture)
2 -
AI
1 -
Analyze Workload Data
1 -
BTP
1 -
Business and IT Integration
2 -
Business application stu
1 -
Business Technology Platform
1 -
Business Trends
1,661 -
Business Trends
87 -
CAP
1 -
cf
1 -
Cloud Foundry
1 -
Confluent
1 -
Customer COE Basics and Fundamentals
1 -
Customer COE Latest and Greatest
3 -
Customer Data Browser app
1 -
Data Analysis Tool
1 -
data migration
1 -
data transfer
1 -
Datasphere
2 -
Event Information
1,400 -
Event Information
64 -
Expert
1 -
Expert Insights
178 -
Expert Insights
273 -
General
1 -
Google cloud
1 -
Google Next'24
1 -
Kafka
1 -
Life at SAP
784 -
Life at SAP
11 -
Migrate your Data App
1 -
MTA
1 -
Network Performance Analysis
1 -
NodeJS
1 -
PDF
1 -
POC
1 -
Product Updates
4,577 -
Product Updates
326 -
Replication Flow
1 -
RisewithSAP
1 -
SAP BTP
1 -
SAP BTP Cloud Foundry
1 -
SAP Cloud ALM
1 -
SAP Cloud Application Programming Model
1 -
SAP Datasphere
2 -
SAP S4HANA Cloud
1 -
SAP S4HANA Migration Cockpit
1 -
Technology Updates
6,886 -
Technology Updates
403 -
Workload Fluctuations
1
Related Content
- Empowering Retail Business with a Seamless Data Migration to SAP S/4HANA in Technology Blogs by Members
- 10+ ways to reshape your SAP landscape with SAP Business Technology Platform - Blog 7 in Technology Blogs by SAP
- 10+ ways to reshape your SAP landscape with SAP Business Technology Platform – Blog 4 in Technology Blogs by SAP
- Business Process Integration and Assimilation in a M&A and How to Accelerate Synergy Savings. in Technology Blogs by SAP
- Partner-2-Partner Collaboration in Manufacturing in Technology Blogs by SAP
Top kudoed authors
| User | Count |
|---|---|
| 12 | |
| 10 | |
| 10 | |
| 7 | |
| 7 | |
| 7 | |
| 6 | |
| 6 | |
| 5 | |
| 4 |