
- SAP Community
- Products and Technology
- Technology
- Technology Blogs by Members
- [SIT Belgium 2019 Recap] Debugging Node.js Applica...
Technology Blogs by Members
Explore a vibrant mix of technical expertise, industry insights, and tech buzz in member blogs covering SAP products, technology, and events. Get in the mix!
Turn on suggestions
Auto-suggest helps you quickly narrow down your search results by suggesting possible matches as you type.
Showing results for
vadimklimov
Active Contributor
Options
- Subscribe to RSS Feed
- Mark as New
- Mark as Read
- Bookmark
- Subscribe
- Printer Friendly Page
- Report Inappropriate Content
05-22-2019
1:10 PM
Intro
This is a recap of the session “Troubleshooting Node.js applications: Debugging in SAP Cloud Platform Cloud Foundry” that took place in a recent SAP Inside Track Belgium 2019 event.
Slide deck of the session is available at SlideShare.
Overview of the session recap blog series:
| Part 1: Remote Debugging - Environment Preparation and General Techniques |
| Part 2: Remote Debugging in Production Environment |
| Part 3: Accessing Service Instance |
| Part 4: Time Travel Debugging |
Demo application and environment
The application that is going to be used for illustration of debugging techniques, is a Node.js application that has been written in TypeScript, compiled (to be more precisely, transpiled) using standard TypeScript compiler into JavaScript code that can be interpreted by JavaScript engine of Node.js runtime. Given the application has been developed in TypeScript and its code requires transpiling, to make debugging more straightforward, source map files generation has been enabled in TypeScript compiler configuration to make it possible to map originally developed TypeScript source code and corresponding JavaScript code that has been generated by TypeScript compiler:

The application exposes two APIs – one is to get current temperature in a specified city using data provided by OpenWeatherMap and consumed using its public API, and the other one is an echo service that sends back originally submitted text with a predefined prefix.
Several application configuration properties (such as URL of the consumed OpenWeatherMap API and application key required to consume the API) have been externalized as environment variables.
Application’s source code and accompanying deployment descriptors can be found in GitHub repository.
The application has been deployed to SAP Cloud Platform Cloud Foundry (SCP CF) environment.
Visual Studio Code has been used for development and debugging the application.
High level overview of Node.js debugger and debuggee interaction
Simplified illustration of how a debugger interacts with a debuggee (a Node.js application) is provided on the picture below:

It is necessary for the Node.js application to run with an enabled Node Inspector, which listens on a specific port (default is 9229, but it can be re-defined) for incoming connections from a debugger.
When a debugger (to be more precise, an Inspector client) successfully attaches to an Inspector, debugging session is established and a developer can proceed with traditional debugging steps. It shall be noted that currently Node.js runtime provides support for legacy V8 Debugging Protocol (enabled by arguments
--debug and --debug-brk) and its successor – V8 Inspector Protocol (enabled by arguments --inspect and --inspect-brk), but given V8 Debugging Protocol is deprecated in most recent release of Node.js (Node.js 12) and is not encouraged to be used on general basis, but only in reasonably exceptional cases, we will make use of V8 Inspector Protocol as much as possible.When the Node.js application is deployed to SCP CF and runs remotely, it is necessary for a debugger to establish connection to an Inspector over network and make use of port forwarding through SSH tunnel to an application container where the debugged Node.js application runs, which can be achieved by using SCP CF capabilities. An enhanced illustration of debugger and debuggee interaction in such an environment is provided below:

Several preparatory steps are required to achieve the illustrated state:

Preparation of Node.js application for remote debugging
In Node.js application manifest (package.json), define a script to start the application with an enabled Inspector (an argument
--inspect / --inspect-brk😞
It is also possible to modify the default script ‘start’ in such a way that it starts the application with an enabled Inspector, but I would rather prefer to keep the default start script unchanged and let it start the application with a disabled Inspector, and use a separate dedicated script to start the application with an enabled Inspector, so that it is possible to choose between starting the same application with enabled and a disabled Inspector by running a corresponding script.
Next, in Cloud Foundry deployment manifest (manifest.xml), use the defined script as a startup command of the deployed application:

This is required to instruct SCP CF that the deployed application shall be started not by running the default script (script ‘start’), but by running the earlier defined custom script.
Alternatively, it is also possible to specify application start command with an argument
-c when deploying the application using a CF CLI command cf push.After this is done, the Node.js application is pushed to SCP CF – it is now deployed to SCP CF environment and started with an enabled Inspector.
Preparation of Cloud Foundry environment for remote debugging
SCP CF provides possibility to enable SSH access to an application container – when such access is enabled, the container can be accessed via SSH using CF CLI.
By default, SSH access is enabled at SCP CF space level, but it is not enabled at application level.
This can be checked, as well as SSH access can be enabled or disabled using following CF CLI commands:
Space level
- Check if SSH access is enabled at space level:
cf space-ssh-allowed {space} - Enable SSH access:
cf allow-space-ssh {space} - Disable SSH access:
cf disallow-space-ssh {space}
Application level
- Check if SSH access is enabled at application level:
cf ssh-enabled {app} - Enable SSH access:
cf enable-ssh {app} - Disable SSH access:
cf disable-ssh {app}
After enabling SSH access to the application, it is essential to restart the application – otherwise, although a CF CLI command
cf ssh-enabled will output that SSH access is enabled, an attempt to connect to the application container using SSH (and a corresponding CF CLI command – cf ssh) will fail.When SSH access has been enabled, but the application has not been restarted:
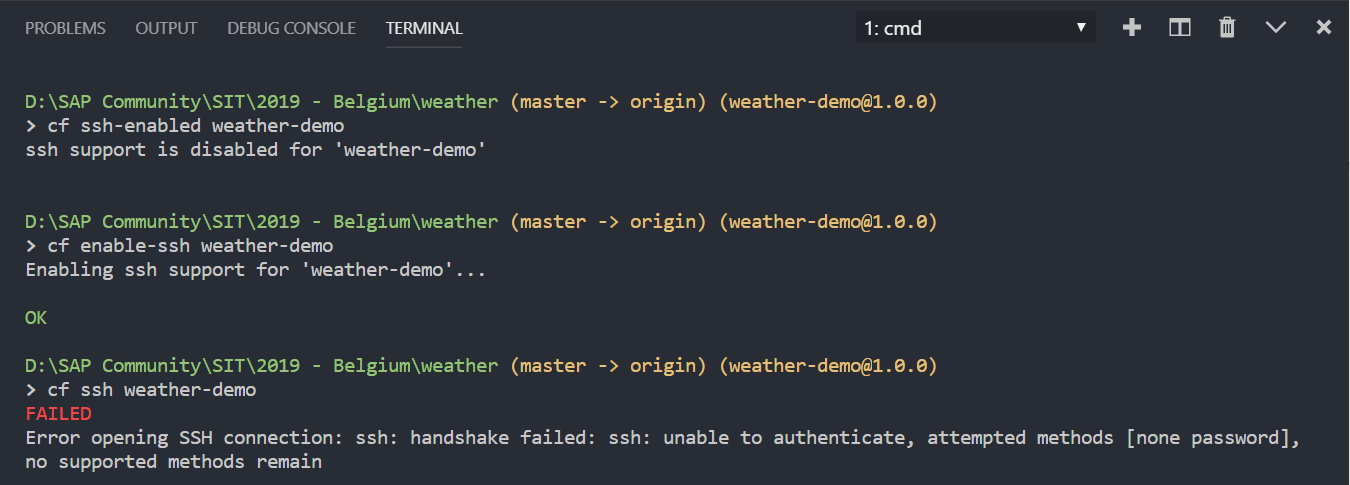
And after the application has been restarted:

After SSH access to the application has been enabled and the application has been restarted, it is now possible to forward remote ports through SSH tunnel and bind them to local ports of a machine where CF CLI runs. Later on in this blog series we will have a closer look at how knowledge of some aspects of networking in SCP CF and particularly understanding of application security groups can help leveraging some other capabilities of SSH tunnelling to SCP CF and accessing service instances that are running in it, but for time being, we will take a note that an Inspector of the running Node.js application is just one of services that can be accessed through SSH tunnel to the application container and an Inspector port that was used during startup of the Node.js application, can be forwarded and bound to a local port. It is essential to note that when started, port forwarding through SSH tunnel does not verify if the forwarded port is opened and if a corresponding listener service is ready to accept requests – in other words, it forwards requests sent to a local port, to a remote port through SSH tunnel, but does not verify readiness of a remote listener/service to accept requests on the specified remote port. As a result, it is technically possible to start port forwarding through SSH tunnel for a remote closed or not ready port, and port forwarding will be started successfully, whereas the error will be thrown when an actual request will be forwarded to that remote port and will hit a closed port or a service that listens on that port, but is not ready to accept requests.
A corresponding CF CLI command for port forwarding through SSH tunnel is:
cf ssh [-N] -L [bind host:]{bind port}:{host}:{port} {app}. An argument -N is used to omit access to an SSH shell of an application container right after setting up port forwarding. If the argument is provided, port forwarding through SSH tunnel is enabled and an SSH shell to an application container can be started at a later time using a CF CLI command cf ssh.Following the demo, a CF CLI command to enable port forwarding of a default Inspector port of the Node.js application deployed and running in SCP CF, is:
cf ssh -N -L 9229:127.0.0.1:9229 weather-demo:
In sake of simplicity, a default Inspector port (9229) is used and is mapped to the same bind port on a local machine. A bind port can be any unused port and does not need to be the same as a forwarded port.
At this point, not only the Node.js application has been deployed to SCP CF environment and started with an enabled Inspector, but an Inspector port has been forwarded and bound to a local port. Hence, from perspective of a locally running Node.js debugger, it is seen as if an Inspector of the Node.js application would have been running locally and listening on a local port 9229 – usage of a specified local port can be verified with the command
netstat executed on a local machine:
It shall be noted that when started, port forwarding through SSH tunnel does not verify if the remote is accessible, if the remote port is opened and if the corresponding listener service is ready to accept requests on it.
Debugging configuration
The last preparatory step is to set up debugging configuration that will allow a Node.js debugger to attach to a running process of a Node.js application. As it has been mentioned earlier, with the help of port forwarding through SSH tunnel, we now have a local port 9229 that listens for incoming requests, and when such requests will be received by it, CF CLI will forward them through SSH tunnel to an Inspector port of the Node.js application that runs in the application container in SCP CF.
In Visual Studio Code, debugging configuration is maintained in launch.json, and sample relevant debugging configuration is provided below:

A debuggee (the Node.js application) already runs – hence, a debugger does not need to launch it, but needs to be instructed to attach to it (request = attach).
Port to which a debugger needs to be attached, is a local port that was used when starting up port forwarding through SSH tunnel for an Inspector port – in the demo, it is a port 9229.
Special attention shall be drawn to parameters localRoot and remoteRoot. These parameters are used to specify root directory of the application source code in a local location (workspace) and root directory of the deployed application in a remote location (application container). Parameters are essential to allow correct source code mapping between a debugger and a debuggee. If these parameters are not provided, a debugger will not be able to map debugged source code located in a local workspace with interpreted code located in the application container of SCP CF. While it is common setting for local root, it is worth looking into how a value for remote root is determined. To do so, let us connect to the application container via SSH (using a CF CLI command cf ssh) and explore application environment.
It shall be noted that when a Node.js application is deployed to SCP CF, pushed application is placed to a directory /app in the application container, for which full path is $HOME/app that resolves to /home/vcap/app. As a result, we can list this directory and observe the Node.js application’s files that have been pushed when deploying the application:

This can be checked in an alternative way, using Node REPL (Read-Eval-Print-Loop) console. When a debugger is attached to a debuggee process, we can check few attributes of the process – such as process.execPath and process.mainModule – to see which executable was used to start a Node process (full path to Node executable) and what main module of the Node.js application is (full path to the module), correspondingly:

In the demo, I use Visual Studio Code debugger, but it is also finely possible to use alternative tools – such as Google Chrome DevTools:

Remote debugging in action
When we are done with preparatory steps, we can now launch respective debugging configuration and get similar debugging experience as if we would have been debugging a locally running Node.js application:

Visual Studio Code is equipped with feature rich Node.js debugger, so I will just highlight few of them that are handy.
Breakpoints and logpoints
Breakpoints is probably one of the most common techniques that developers got used to when debugging programs regardless of programming language, framework and runtime. Node.js is not an exception here, and breakpoints are first class citizens in a Node.js debugger. A specific flavour of breakpoints is conditional breakpoints that allow to pause execution of the debugged program only when certain condition is met, and corresponding expression evaluates to true:

Although it is doubtlessly helpful to pause a program and explore its internals – variables, call stack, etc. – there are practical cases when a developer only needs to observe content of specific variables or evaluate certain expressions, and pausing the debuggee becomes an unwanted side-effect in troubleshooting process. In such cases, it is more convenient to use logpoints instead of traditional breakpoints.
Logpoint is a type of breakpoint that produces a specified log entry and outputs it to debug terminal without suspending program execution. Essentially, logpoint is a
console.log() statement that is added at a specific location of an analyzed program at debug time, rather than at development time: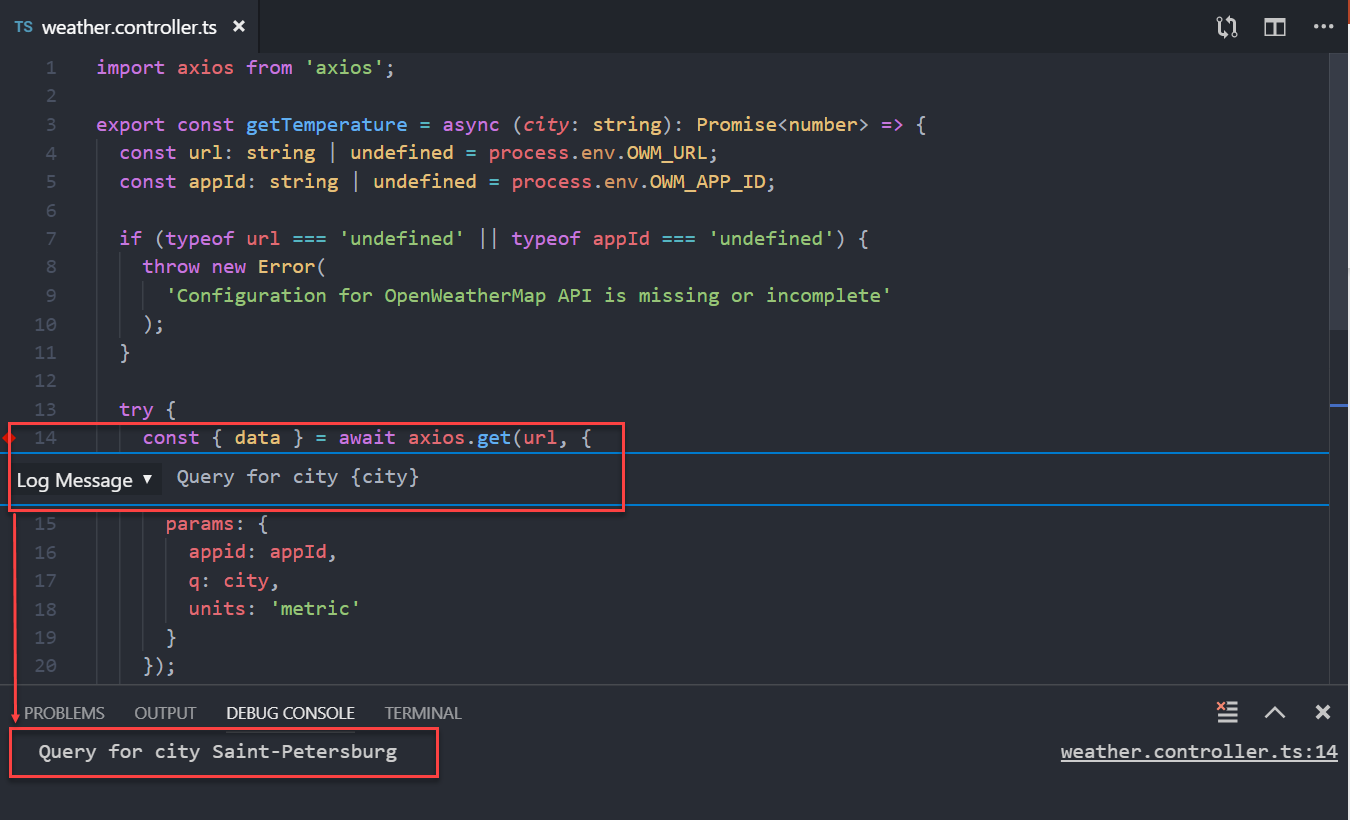
This can be verified by enabling trace of debugger and debuggee interaction, which can be achieved by activating debug adapter trace in corresponding used debugging configuration:


As it can be observed, for a location of a logpoint that was set in TypeScript source code of the application, a respective mapped location in generated JavaScript code was determined in a local workspace (thanks to source map files generated by TypeScript compiler) and passed to a matching location of that same generated JavaScript code that is located at the remote application container where the application runs (thanks to local root and remote root settings in debugging configuration).
Watched variables
There can be a lot of variables and properties declared when reaching certain processing steps, whereas a developer might be interested in continuously observing only few of them. In such cases, it is worth using watch expressions to get access to content of a selection of variables and to evaluate expressions:

Outro
In the next blog of this series, we will look into how described remote debugging technique can be used when troubleshooting Node.js applications that have been deployed to a production tenant of SCP CF or when some of prerequisites (preparatory steps) described in this blog, cannot be fulfilled.
There are helpful materials in SAP Community about usage of SSH and port forwarding through SSH in a Cloud Foundry environment that illustrate this technique with some other examples and that are worth further reading:
- SSH your SAP Cloud Platform CF app written by simen.huuse3,
- How to use an SSH tunnel with SCP Cloud Foundry backing-service written by murmelssonic,
- CloudFoundryFun #1 – Upgrade Cloud Foundry With A New REPL Feature written by mariusobert.
If you want to familiarize yourself with more hands-on examples on how the technique described in this blog can be applied to other application runtimes – in particular, to Java runtime – I would strongly recommend reading a blog Max’s Adventure in SAP Cloud Platform: Debug your Java application in Cloud Foundry written by iinside, where he provides detailed explanation and demonstration on how a Java application that has been deployed to SCP CF, can be debugged remotely.
- SAP Managed Tags:
- Node.js,
- SAP BTP, Cloud Foundry runtime and environment,
- SAP Business Technology Platform
4 Comments
You must be a registered user to add a comment. If you've already registered, sign in. Otherwise, register and sign in.
Labels in this area
-
"automatische backups"
1 -
"regelmäßige sicherung"
1 -
505 Technology Updates 53
1 -
ABAP
14 -
ABAP API
1 -
ABAP CDS Views
2 -
ABAP CDS Views - BW Extraction
1 -
ABAP CDS Views - CDC (Change Data Capture)
1 -
ABAP class
2 -
ABAP Cloud
2 -
ABAP Development
5 -
ABAP in Eclipse
1 -
ABAP Platform Trial
1 -
ABAP Programming
2 -
abap technical
1 -
absl
1 -
access data from SAP Datasphere directly from Snowflake
1 -
Access data from SAP datasphere to Qliksense
1 -
Accrual
1 -
action
1 -
adapter modules
1 -
Addon
1 -
Adobe Document Services
1 -
ADS
1 -
ADS Config
1 -
ADS with ABAP
1 -
ADS with Java
1 -
ADT
2 -
Advance Shipping and Receiving
1 -
Advanced Event Mesh
3 -
AEM
1 -
AI
7 -
AI Launchpad
1 -
AI Projects
1 -
AIML
9 -
Alert in Sap analytical cloud
1 -
Amazon S3
1 -
Analytical Dataset
1 -
Analytical Model
1 -
Analytics
1 -
Analyze Workload Data
1 -
annotations
1 -
API
1 -
API and Integration
3 -
API Call
2 -
Application Architecture
1 -
Application Development
5 -
Application Development for SAP HANA Cloud
3 -
Applications and Business Processes (AP)
1 -
Artificial Intelligence
1 -
Artificial Intelligence (AI)
4 -
Artificial Intelligence (AI) 1 Business Trends 363 Business Trends 8 Digital Transformation with Cloud ERP (DT) 1 Event Information 462 Event Information 15 Expert Insights 114 Expert Insights 76 Life at SAP 418 Life at SAP 1 Product Updates 4
1 -
Artificial Intelligence (AI) blockchain Data & Analytics
1 -
Artificial Intelligence (AI) blockchain Data & Analytics Intelligent Enterprise
1 -
Artificial Intelligence (AI) blockchain Data & Analytics Intelligent Enterprise Oil Gas IoT Exploration Production
1 -
Artificial Intelligence (AI) blockchain Data & Analytics Intelligent Enterprise sustainability responsibility esg social compliance cybersecurity risk
1 -
ASE
1 -
ASR
2 -
ASUG
1 -
Attachments
1 -
Authorisations
1 -
Automating Processes
1 -
Automation
1 -
aws
2 -
Azure
1 -
Azure AI Studio
1 -
B2B Integration
1 -
Backorder Processing
1 -
Backup
1 -
Backup and Recovery
1 -
Backup schedule
1 -
BADI_MATERIAL_CHECK error message
1 -
Bank
1 -
BAS
1 -
basis
2 -
Basis Monitoring & Tcodes with Key notes
2 -
Batch Management
1 -
BDC
1 -
Best Practice
1 -
bitcoin
1 -
Blockchain
3 -
BOP in aATP
1 -
BOP Segments
1 -
BOP Strategies
1 -
BOP Variant
1 -
BPC
1 -
BPC LIVE
1 -
BTP
11 -
BTP Destination
2 -
Business AI
1 -
Business and IT Integration
1 -
Business application stu
1 -
Business Architecture
1 -
Business Communication Services
1 -
Business Continuity
1 -
Business Data Fabric
3 -
Business Partner
12 -
Business Partner Master Data
10 -
Business Technology Platform
2 -
Business Trends
1 -
CA
1 -
calculation view
1 -
CAP
3 -
Capgemini
1 -
CAPM
1 -
Catalyst for Efficiency: Revolutionizing SAP Integration Suite with Artificial Intelligence (AI) and
1 -
CCMS
2 -
CDQ
12 -
CDS
2 -
Cental Finance
1 -
Certificates
1 -
CFL
1 -
Change Management
1 -
chatbot
1 -
chatgpt
3 -
CL_SALV_TABLE
2 -
Class Runner
1 -
Classrunner
1 -
Cloud ALM Monitoring
1 -
Cloud ALM Operations
1 -
cloud connector
1 -
Cloud Extensibility
1 -
Cloud Foundry
3 -
Cloud Integration
6 -
Cloud Platform Integration
2 -
cloudalm
1 -
communication
1 -
Compensation Information Management
1 -
Compensation Management
1 -
Compliance
1 -
Compound Employee API
1 -
Configuration
1 -
Connectors
1 -
Consolidation Extension for SAP Analytics Cloud
1 -
Controller-Service-Repository pattern
1 -
Conversion
1 -
Cosine similarity
1 -
cryptocurrency
1 -
CSI
1 -
ctms
1 -
Custom chatbot
3 -
Custom Destination Service
1 -
custom fields
1 -
Customer Experience
1 -
Customer Journey
1 -
Customizing
1 -
Cyber Security
2 -
Data
1 -
Data & Analytics
1 -
Data Aging
1 -
Data Analytics
2 -
Data and Analytics (DA)
1 -
Data Archiving
1 -
Data Back-up
1 -
Data Governance
5 -
Data Integration
2 -
Data Quality
12 -
Data Quality Management
12 -
Data Synchronization
1 -
data transfer
1 -
Data Unleashed
1 -
Data Value
8 -
database tables
1 -
Datasphere
2 -
datenbanksicherung
1 -
dba cockpit
1 -
dbacockpit
1 -
Debugging
2 -
Delimiting Pay Components
1 -
Delta Integrations
1 -
Destination
3 -
Destination Service
1 -
Developer extensibility
1 -
Developing with SAP Integration Suite
1 -
Devops
1 -
digital transformation
1 -
Documentation
1 -
Dot Product
1 -
DQM
1 -
dump database
1 -
dump transaction
1 -
e-Invoice
1 -
E4H Conversion
1 -
Eclipse ADT ABAP Development Tools
2 -
edoc
1 -
edocument
1 -
ELA
1 -
Embedded Consolidation
1 -
Embedding
1 -
Embeddings
1 -
Employee Central
1 -
Employee Central Payroll
1 -
Employee Central Time Off
1 -
Employee Information
1 -
Employee Rehires
1 -
Enable Now
1 -
Enable now manager
1 -
endpoint
1 -
Enhancement Request
1 -
Enterprise Architecture
1 -
ETL Business Analytics with SAP Signavio
1 -
Euclidean distance
1 -
Event Dates
1 -
Event Driven Architecture
1 -
Event Mesh
2 -
Event Reason
1 -
EventBasedIntegration
1 -
EWM
1 -
EWM Outbound configuration
1 -
EWM-TM-Integration
1 -
Existing Event Changes
1 -
Expand
1 -
Expert
2 -
Expert Insights
1 -
Fiori
14 -
Fiori Elements
2 -
Fiori SAPUI5
12 -
Flask
1 -
Full Stack
8 -
Funds Management
1 -
General
1 -
Generative AI
1 -
Getting Started
1 -
GitHub
8 -
Grants Management
1 -
groovy
1 -
GTP
1 -
HANA
5 -
HANA Cloud
2 -
Hana Cloud Database Integration
2 -
HANA DB
1 -
HANA XS Advanced
1 -
Historical Events
1 -
home labs
1 -
HowTo
1 -
HR Data Management
1 -
html5
8 -
Identity cards validation
1 -
idm
1 -
Implementation
1 -
input parameter
1 -
instant payments
1 -
Integration
3 -
Integration Advisor
1 -
Integration Architecture
1 -
Integration Center
1 -
Integration Suite
1 -
intelligent enterprise
1 -
Java
1 -
job
1 -
Job Information Changes
1 -
Job-Related Events
1 -
Job_Event_Information
1 -
joule
4 -
Journal Entries
1 -
Just Ask
1 -
Kerberos for ABAP
8 -
Kerberos for JAVA
8 -
Launch Wizard
1 -
Learning Content
2 -
Life at SAP
1 -
lightning
1 -
Linear Regression SAP HANA Cloud
1 -
local tax regulations
1 -
LP
1 -
Machine Learning
2 -
Marketing
1 -
Master Data
3 -
Master Data Management
14 -
Maxdb
2 -
MDG
1 -
MDGM
1 -
MDM
1 -
Message box.
1 -
Messages on RF Device
1 -
Microservices Architecture
1 -
Microsoft Universal Print
1 -
Middleware Solutions
1 -
Migration
5 -
ML Model Development
1 -
Modeling in SAP HANA Cloud
8 -
Monitoring
3 -
MTA
1 -
Multi-Record Scenarios
1 -
Multiple Event Triggers
1 -
Neo
1 -
New Event Creation
1 -
New Feature
1 -
Newcomer
1 -
NodeJS
2 -
ODATA
2 -
OData APIs
1 -
odatav2
1 -
ODATAV4
1 -
ODBC
1 -
ODBC Connection
1 -
Onpremise
1 -
open source
2 -
OpenAI API
1 -
Oracle
1 -
PaPM
1 -
PaPM Dynamic Data Copy through Writer function
1 -
PaPM Remote Call
1 -
PAS-C01
1 -
Pay Component Management
1 -
PGP
1 -
Pickle
1 -
PLANNING ARCHITECTURE
1 -
Popup in Sap analytical cloud
1 -
PostgrSQL
1 -
POSTMAN
1 -
Process Automation
2 -
Product Updates
4 -
PSM
1 -
Public Cloud
1 -
Python
4 -
Qlik
1 -
Qualtrics
1 -
RAP
3 -
RAP BO
2 -
Record Deletion
1 -
Recovery
1 -
recurring payments
1 -
redeply
1 -
Release
1 -
Remote Consumption Model
1 -
Replication Flows
1 -
Research
1 -
Resilience
1 -
REST
1 -
REST API
1 -
Retagging Required
1 -
Risk
1 -
Rolling Kernel Switch
1 -
route
1 -
rules
1 -
S4 HANA
1 -
S4 HANA Cloud
1 -
S4 HANA On-Premise
1 -
S4HANA
3 -
S4HANA_OP_2023
2 -
SAC
10 -
SAC PLANNING
9 -
SAP
4 -
SAP ABAP
1 -
SAP Advanced Event Mesh
1 -
SAP AI Core
8 -
SAP AI Launchpad
8 -
SAP Analytic Cloud Compass
1 -
Sap Analytical Cloud
1 -
SAP Analytics Cloud
4 -
SAP Analytics Cloud for Consolidation
2 -
SAP Analytics Cloud Story
1 -
SAP analytics clouds
1 -
SAP BAS
1 -
SAP Basis
6 -
SAP BODS
1 -
SAP BODS certification.
1 -
SAP BTP
20 -
SAP BTP Build Work Zone
2 -
SAP BTP Cloud Foundry
5 -
SAP BTP Costing
1 -
SAP BTP CTMS
1 -
SAP BTP Innovation
1 -
SAP BTP Migration Tool
1 -
SAP BTP SDK IOS
1 -
SAP Build
11 -
SAP Build App
1 -
SAP Build apps
1 -
SAP Build CodeJam
1 -
SAP Build Process Automation
3 -
SAP Build work zone
10 -
SAP Business Objects Platform
1 -
SAP Business Technology
2 -
SAP Business Technology Platform (XP)
1 -
sap bw
1 -
SAP CAP
2 -
SAP CDC
1 -
SAP CDP
1 -
SAP Certification
1 -
SAP Cloud ALM
4 -
SAP Cloud Application Programming Model
1 -
SAP Cloud Integration for Data Services
1 -
SAP cloud platform
8 -
SAP Companion
1 -
SAP CPI
3 -
SAP CPI (Cloud Platform Integration)
2 -
SAP CPI Discover tab
1 -
sap credential store
1 -
SAP Customer Data Cloud
1 -
SAP Customer Data Platform
1 -
SAP Data Intelligence
1 -
SAP Data Migration in Retail Industry
1 -
SAP Data Services
1 -
SAP DATABASE
1 -
SAP Dataspher to Non SAP BI tools
1 -
SAP Datasphere
9 -
SAP DRC
1 -
SAP EWM
1 -
SAP Fiori
2 -
SAP Fiori App Embedding
1 -
Sap Fiori Extension Project Using BAS
1 -
SAP GRC
1 -
SAP HANA
1 -
SAP HCM (Human Capital Management)
1 -
SAP HR Solutions
1 -
SAP IDM
1 -
SAP Integration Suite
9 -
SAP Integrations
4 -
SAP iRPA
2 -
SAP Learning Class
1 -
SAP Learning Hub
1 -
SAP Odata
2 -
SAP on Azure
1 -
SAP PartnerEdge
1 -
sap partners
1 -
SAP Password Reset
1 -
SAP PO Migration
1 -
SAP Prepackaged Content
1 -
SAP Process Automation
2 -
SAP Process Integration
2 -
SAP Process Orchestration
1 -
SAP S4HANA
2 -
SAP S4HANA Cloud
1 -
SAP S4HANA Cloud for Finance
1 -
SAP S4HANA Cloud private edition
1 -
SAP Sandbox
1 -
SAP STMS
1 -
SAP SuccessFactors
2 -
SAP SuccessFactors HXM Core
1 -
SAP Time
1 -
SAP TM
2 -
SAP Trading Partner Management
1 -
SAP UI5
1 -
SAP Upgrade
1 -
SAP-GUI
8 -
SAP_COM_0276
1 -
SAPBTP
1 -
SAPCPI
1 -
SAPEWM
1 -
sapmentors
1 -
saponaws
2 -
SAPUI5
4 -
schedule
1 -
Secure Login Client Setup
8 -
security
9 -
Selenium Testing
1 -
SEN
1 -
SEN Manager
1 -
service
1 -
SET_CELL_TYPE
1 -
SET_CELL_TYPE_COLUMN
1 -
SFTP scenario
2 -
Simplex
1 -
Single Sign On
8 -
Singlesource
1 -
SKLearn
1 -
soap
1 -
Software Development
1 -
SOLMAN
1 -
solman 7.2
2 -
Solution Manager
3 -
sp_dumpdb
1 -
sp_dumptrans
1 -
SQL
1 -
sql script
1 -
SSL
8 -
SSO
8 -
Substring function
1 -
SuccessFactors
1 -
SuccessFactors Time Tracking
1 -
Sybase
1 -
system copy method
1 -
System owner
1 -
Table splitting
1 -
Tax Integration
1 -
Technical article
1 -
Technical articles
1 -
Technology Updates
1 -
Technology Updates
1 -
Technology_Updates
1 -
Threats
1 -
Time Collectors
1 -
Time Off
2 -
Tips and tricks
2 -
Tools
1 -
Trainings & Certifications
1 -
Transport in SAP BODS
1 -
Transport Management
1 -
TypeScript
2 -
unbind
1 -
Unified Customer Profile
1 -
UPB
1 -
Use of Parameters for Data Copy in PaPM
1 -
User Unlock
1 -
VA02
1 -
Validations
1 -
Vector Database
1 -
Vector Engine
1 -
Visual Studio Code
1 -
VSCode
1 -
Web SDK
1 -
work zone
1 -
workload
1 -
xsa
1 -
XSA Refresh
1
- « Previous
- Next »
Related Content
- 10+ ways to reshape your SAP landscape with SAP Business Technology Platform – Blog 4 in Technology Blogs by SAP
- Top Picks: Innovations Highlights from SAP Business Technology Platform (Q1/2024) in Technology Blogs by SAP
- explore the business continuity recovery sap solutions on AWS DRS in Technology Blogs by Members
- Consuming CAPM Application's OData service into SAP Fiori Application in Business Application Studio in Technology Blogs by Members
- SAP SABRIX UPGRADE in Technology Blogs by Members
Top kudoed authors
| User | Count |
|---|---|
| 11 | |
| 9 | |
| 7 | |
| 6 | |
| 4 | |
| 4 | |
| 3 | |
| 3 | |
| 3 | |
| 3 |