
- SAP Community
- Products and Technology
- Technology
- Technology Blogs by SAP
- Access database tables content from Focused Insigh...
Technology Blogs by SAP
Learn how to extend and personalize SAP applications. Follow the SAP technology blog for insights into SAP BTP, ABAP, SAP Analytics Cloud, SAP HANA, and more.
Turn on suggestions
Auto-suggest helps you quickly narrow down your search results by suggesting possible matches as you type.
Showing results for
Product and Topic Expert
Options
- Subscribe to RSS Feed
- Mark as New
- Mark as Read
- Bookmark
- Subscribe
- Printer Friendly Page
- Report Inappropriate Content
04-17-2019
4:45 PM

Focused Insights comes with a wide range of data sources, most of them correspond to Solution Manager scenarios like system monitoring, interface channel monitoring, custom code management, test management...
However, sometimes there is the requirement to go beyond the standard and integrate data from a custom or Third Party application. For those use cases, there is now a new data provider (/STDF/DP_TABLE) that let you read time series and data from a database table located on Solution Manager or on an ABAP managed system connected to Solution Manager.
As we'll see in the following, in order to get the most from the data, the table should be structured in a way that Focused Insights can distinguish easily between three kinds of information: Time, Dimensions and Key Figures. In the context of custom project, thus, we have to build the Z tables accordingly.
The good news is that there are already several standard ABAP tables that we can read with the data provider /STDF/DP_TABLE. In this example, we'll see how we can access the content of table TBTCO which contains the runtime information of ABAP Jobs.
We want to display in a dashboard the following real time information:
- All current running jobs
- Number of jobs finished & cancelled per user today
- Focused Insights jobs last 7 days
Looking at the TBTCO table, we'll need the following fields:
- Time fields: STRTDATE (start date of the job)
- Dimension fields: JOBNAME (name of the job), SDLUNAME (user who executed the job), STATUS (status of the job)
- Key figure fields: we don't use any key figure fields, we'll just count the number of rows in the table.

On the Focused Insights configuration table located on Solution Manager /STDF/DP_TAB_SRC, we create a new entry to configure the access to the table TBTCO.
The alias "DEMO_JOB" is the key for this data source we'll need later on.
We let the field "RFC" empty, since we access locally the TBTCO table of Solution Manager .
Field "TIMESTAMP FIELD" contains the table field used for the time dimension: "STRDATE". Since the type of field "STRDATE" is DATS, the format configured in field "TIMESTAMP FORMAT" is "YYYYMMDD". We are not interested in this example to go below the resolution DAY, while it could be possible if we use two fields instead of one (separated with a coma): "STRDATE,STRTIME". In this case, the time format would be "YYYYMMDDHHSS". See also table below for different time formats supported.
| TIMESTAMP TYPE | FORMAT (UTC Time) |
| None | NO_TIMESTAMP |
| DATS | YYYYMMDD |
| TIMS | HHMMSS |
| DATS,TIMS | YYYYMMDDHHMMSS |
| TIMESTAMP / DEC15 | YYYYMMDDHHMMSS |
| LONG TIMESTAMP / DEC21 | YYYYMMDDHHMMSS,MMMUUUN |
| Packed Number | YYYY |
| Packed Number | YYYYMM |
| Packed Number | YYYYMMDD |
| Packed Number | YYYYMMDDHH |
| Packed Number | YYYYMMDDHHSS |
The field "DIMENSIONS" contains TBTCO fields "JOBNAME", "SDLUNAME" and "STATUS" we'll need to filter the data.
The field "KEYFIGURES FIELDS" remains empty; we use the number of rows as the key figure.

Remark about authorisations
whether the table is accessed locally on Solution Manager or on a remote managed system through an RFC call, it is important to assign carefully the authorisations to the user who executes the request.
The user must be granted the authorisation to execute the function module RFC_READ_TABLE together with the authorisations to access in display mode the source database table. Make sure to restrict the authorisations to the minimum required so that the user cannot access all database tables of the managed system.
See the example below for table TBTCO:

Once the data source is configured properly in table /STDF/DP_TAB_SRC, and user has the required authorisations, we can access it from OCC Dashboard.
Make sure you are running Focused Insights SP2 or upper, with wave 4.3 or upper. This can be checked from the Focused Insights Launchpad, on the bottom right of the main page.

In order to initialise the data provider /STDF/DP_TABLE make sure the setup has been ran successfully, especially the task "Init OCC" of "Step 7: Initialisation".
Gadget "Current Running Jobs"
Create a new gadget "Current Running Jobs" with renderer "SLR_RENDERER".
Select data provider "Table Data Provider" (/STDF/DP_TABLE).
Select the alias configured above: "DEMO_JOB".

On the section "Dimensions", select the running job status: "R".

Remark: since filters values come from the source table (TBTCO), it could be that status "R" is not listed if no jobs are currently running on the system. In this case, you can switch to the expert mode and enter the status manually in the query string.

We don't need to select a key figure.
Go to the section "Options".
Select "JOBNAME" as drill down dimension.
Select "Count" for the aggregation.

Select the time frame "Today/Day".

You can now save and display the result: all the running jobs on the system are listed in a table. Since we use a current time frame (Today/Day), the cache is not involved and the table is updated with the real time information each time you refresh the gadget.

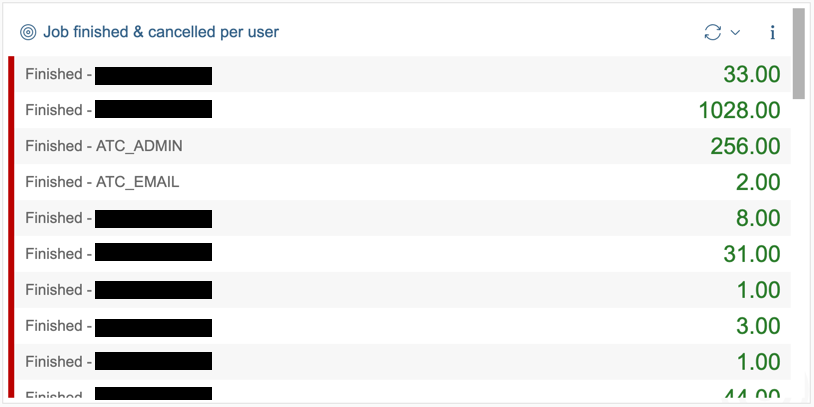
Gadget "Job finished & cancelled per user"
Create a new gadget "Job finished & cancelled per user" with renderer "SLR_RENDERER".
Select time frame Today / Day.
Create a new query with legend "Finished".
Select data provider "Table Data Provider" (/STDF/DP_TABLE).
Select the alias configured above: "DEMO_JOB".
On the section "Dimensions", select the finished job status: "F".
We don't need to select a key figure.
Go to the section "Options".
Select "SDLUNAME" as drill down dimension.
Select "Count" for the aggregation.
Create another query with legend "Cancelled", use the same configuration and filters, but this time select the aborted job status ("A") instead of the finished job status.
You can now save and display the result: all the finished and cancelled jobs per user are listed in a table. Since we use a current time frame (Today/Day), the cache is not involved and the table is updated with the real time information each time you refresh the gadget.
Gadget "Focused Insights jobs last 7 days"
Create a new gadget "Focused Insights Jobs" with renderer "STACK_COLUMN_CHART".
Select time frame Last 7 Day / Day.
Create a new query with legend "Finished".
Select data provider "Table Data Provider" (/STDF/DP_TABLE).
Select the alias configured above: "DEMO_JOB".
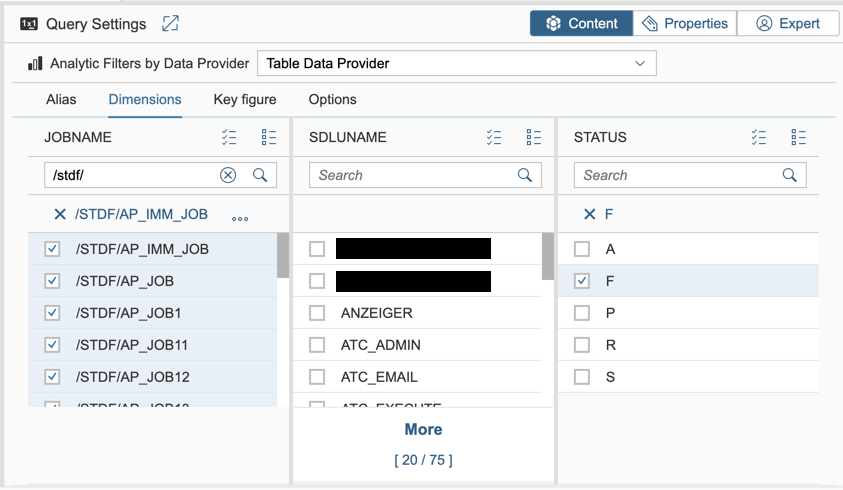
On the section "Dimensions", select the finished job status: "F".
With the help of the filter, select all job names starting with "/STDF/".
We don't need to select a key figure.
Go to the section "Options".
Select "Count" for the aggregation.
Create another query with legend "Cancelled", use the same configuration and filters, but this time select the aborted job status ("A") instead of the finished job status.
You can now save and display the result: all Focused Insights jobs finished and cancelled during the past 7 days.

Focused Insights (http://support.sap.com/focused-insights)
Focused solutions for SAP Solution Manager, is the extension concept for SAP Solution Manager, with the idea of helping our customers meet their particular innovation needs on an individual basis, without the need for homegrown software.
The goal of Focused Insights is to build and distribute powerful customer-specific dashboards in minutes using state-of-the-art user experience.
The content delivered with Focused Insights has been designed to deliver, in real time, the most relevant and valuable information to the right people. While it provides full transparency of information stored inside SAP Solution Manager, it also takes into account the best practices and experience gained during numerous custom projects, offering a set of prepackaged dashboards tailored to your needs.
SAP Focused Insights offers specialized dashboards for experts as well as management or non-technical users. Whether they address the CIO or an expert, dashboards remain consistent among each other since they rely on the same data sources mixed up and presented in different granularities or aggregation levels
Focused Insights comes with a rich content. It fully exploits the huge amount of data stored inside SAP Solution Manager. Metrics produced by the activation of a scenario, whether it is IT or business related, become immediately available to the prepackaged dashboards. Raw metrics can be grouped or combined to produce advanced metrics and high level KPIs.
- SAP Managed Tags:
- SAP Solution Manager,
- Focused Insights for SAP Solution Manager,
- SOLMAN System Monitoring
Labels:
3 Comments
You must be a registered user to add a comment. If you've already registered, sign in. Otherwise, register and sign in.
Labels in this area
-
ABAP CDS Views - CDC (Change Data Capture)
2 -
AI
1 -
Analyze Workload Data
1 -
BTP
1 -
Business and IT Integration
2 -
Business application stu
1 -
Business Technology Platform
1 -
Business Trends
1,661 -
Business Trends
88 -
CAP
1 -
cf
1 -
Cloud Foundry
1 -
Confluent
1 -
Customer COE Basics and Fundamentals
1 -
Customer COE Latest and Greatest
3 -
Customer Data Browser app
1 -
Data Analysis Tool
1 -
data migration
1 -
data transfer
1 -
Datasphere
2 -
Event Information
1,400 -
Event Information
65 -
Expert
1 -
Expert Insights
178 -
Expert Insights
280 -
General
1 -
Google cloud
1 -
Google Next'24
1 -
Kafka
1 -
Life at SAP
784 -
Life at SAP
11 -
Migrate your Data App
1 -
MTA
1 -
Network Performance Analysis
1 -
NodeJS
1 -
PDF
1 -
POC
1 -
Product Updates
4,577 -
Product Updates
330 -
Replication Flow
1 -
RisewithSAP
1 -
SAP BTP
1 -
SAP BTP Cloud Foundry
1 -
SAP Cloud ALM
1 -
SAP Cloud Application Programming Model
1 -
SAP Datasphere
2 -
SAP S4HANA Cloud
1 -
SAP S4HANA Migration Cockpit
1 -
Technology Updates
6,886 -
Technology Updates
408 -
Workload Fluctuations
1
Related Content
- It’s Official - SAP BTP is Again a Leader in G2’s Reports in Technology Blogs by SAP
- Analyze Expensive ABAP Workload in the Cloud with Work Process Sampling in Technology Blogs by SAP
- Introducing Blog Series of SAP Signavio Process Insights, discovery edition – An in-depth exploratio in Technology Blogs by SAP
- New Machine Learning features in SAP HANA Cloud in Technology Blogs by SAP
- SAP Analytics Cloud - Performance statistics in Technology Blogs by SAP
Top kudoed authors
| User | Count |
|---|---|
| 13 | |
| 10 | |
| 10 | |
| 9 | |
| 7 | |
| 6 | |
| 5 | |
| 5 | |
| 5 | |
| 4 |