
- SAP Community
- Products and Technology
- Technology
- Technology Blogs by Members
- SAP Analytics Cloud for newbies
Technology Blogs by Members
Explore a vibrant mix of technical expertise, industry insights, and tech buzz in member blogs covering SAP products, technology, and events. Get in the mix!
Turn on suggestions
Auto-suggest helps you quickly narrow down your search results by suggesting possible matches as you type.
Showing results for
ignacio_kristof
Active Participant
Options
- Subscribe to RSS Feed
- Mark as New
- Mark as Read
- Bookmark
- Subscribe
- Printer Friendly Page
- Report Inappropriate Content
04-01-2019
2:42 AM
Disclaimer: This blog has per objective to give and overview and express some thoughts on SAP Analytics Cloud. It was based on own research, but using different sources of information. It is relevant to highlight: SAP Handbook SAC01 , SAP Press book “Introducing SAP Analytics Cloud” by Pravin Datar and learning section from sap.analytics.cloud site. Update: 08/2020: The book refered is no longer available, but the replacement is the book, also from SAP Press, "SAP Analytics Cloud" by Abassim Sidliq.
Why is SAP Analytics Cloud so important? What can you do with it?
I think that the most important point about SAP Analytics Cloud is that brings a simple, powerful and quick-value-delivery tool for analyzing your data.
It is simple to access, feed the data and play with the information to have nice visual reports and insights on your information.
I see it as a powerful tool for Functional Consultants to bring analytics into their portfolio.
Of course that complex planning, complex analytics structures will require Analytics Consultants, BW Experts, BPC analysts. But when it is required to display data visually and perform data analysis with medium or low complexity it is a great tool.

Some quick use cases that come from the top of my head:
What is SAP Analytics Cloud?
SAP Analytic Cloud is a disruptive cloud solution that allows you to do planning, predictive analytics and business intelligence in a simple and intuitive solution.
It is a Software as a Service Solution (SaaS), built on SAP Cloud Platform and it has the following capabilities:
It can be hosted in Private or Public Cloud. It is ready to integrate easily with S/4HANA and HANA.

SAP Analytics Cloud it is becoming the primary Data Discover tool for SAP. SAP Lumira will continue to be supported but most of the innovation focus will be in SAC.

What type of data and how can you feed into SAP Analytics Cloud?
There are sections below with a quick overview of integration with SAP BPC, SAP BW and SAP S/4HANA.
Also, SAP Analytics Hub allows you to bring data from your different on-premise and cloud systems and centralize them in a single front-end platform (we will go deeper on this in a future blog).
Data Models in SAP Analytics Cloud
Data Modelling is the process of setting up, connecting, preparing and finally modeling the data.
Depending on what you want to do, you can create:
See the options you have to create your model:

Data Analysis and Visualization with SAP Analytics Cloud.
User experience and visualization are one of the great features of SAP Analytics Cloud. In the next points we will see an overview of some key aspects.
To create a Story, you do it from Home Page à Create à Story. And you will find the following options:
Within a Canvas Page, you can:

Some cool features that you can find when working in your Story:


Planning
SAP Analytics Cloud is setting a new standard for Financial Planning & analysis by combining business intelligence and planning, together in the cloud.

Several features are available in SAP Analytics Cloud, to execute planning tasks. The core features for planning capabilities are the following ones:


To use planning features, you need to work with planning models and have the proper permissions.
To start a simple plan, you can start from a blank model, adding dimensions manually or selecting existing dimensions. The blank planning model includes Actual, Budget, Planning and Forecast as predefined categories.
Integration with SAP BW
SAP Analytics Cloud integrates with SAP BW without replication required. The advantage is that you can use your existing data models in BW to generate views in SAP Analytics Cloud.

Check the following comparisons for connectivity options:

SAP Analytics Cloud and BPC
SAC and BPC have bi-directional integration. SAP Analytics Cloud it is not a success for for BPC but a complimentary tool. For example, a company uses BPC as it’s main planning tool but wants to use a Cloud planning app for other line of business.

You can do:

As example:
1.I quickly put an Excel toghether with some key data.
2.Uploaded to SAP Analytics Cloud and built a model with AP data:

3.Selected an existing template

4.After editing some aspects , I obtained a visual dashboard much more visual than just a table

Why is SAP Analytics Cloud so important? What can you do with it?
I think that the most important point about SAP Analytics Cloud is that brings a simple, powerful and quick-value-delivery tool for analyzing your data.
It is simple to access, feed the data and play with the information to have nice visual reports and insights on your information.
I see it as a powerful tool for Functional Consultants to bring analytics into their portfolio.
Of course that complex planning, complex analytics structures will require Analytics Consultants, BW Experts, BPC analysts. But when it is required to display data visually and perform data analysis with medium or low complexity it is a great tool.
- Bring data from multiple sources.
- You can create dynamic visual stories for different areas of business.
- Get instant insights on your data.
- Play with the data to create different scenarios.
- Collaborate with your team: Send the visualizations, ask them to take action on data, get feedback.
Image from SAP Handbook SAPC01
Some quick use cases that come from the top of my head:
- I have expertise in Cash Management and Treasury. I think that users would be really interested in getting different visuals on Cash Position and get insights from it. Despite S/4HANA Cash Management has graphic capabilities in FIORI apps, you can bring better insights or analysis on the table.
- If I think of Accounts Receivables, I could create cool dashboards to analyze information from different customers, geo-maps to see receivable performance in different countries, sending reports to manager using collaboration features.
- From an AP perspective, I could prepare analysis reports looking at different dimensions and getting insights from different perspectives.
What is SAP Analytics Cloud?
SAP Analytic Cloud is a disruptive cloud solution that allows you to do planning, predictive analytics and business intelligence in a simple and intuitive solution.
It is a Software as a Service Solution (SaaS), built on SAP Cloud Platform and it has the following capabilities:
- Analytics for Cloud and On-Premise applications without data replication
- Utilize data from SAP HANA for Analysis
- Smart discovery and smart analysis capabilities
- Data modeling
- Connectivity
It can be hosted in Private or Public Cloud. It is ready to integrate easily with S/4HANA and HANA.
Image from SAP Handbook SAPC01
SAP Analytics Cloud it is becoming the primary Data Discover tool for SAP. SAP Lumira will continue to be supported but most of the innovation focus will be in SAC.
Image from SAP Handbook SAPC01
What type of data and how can you feed into SAP Analytics Cloud?
- Live data source, coming from an On-Premise data source (SAP HANA, SAP S/4HANA, SAP BW). Not all SAP solutions have live connection (like Success Factors, Fieldglass, etc.)
- Replicated Data (or also called Acquired Data), for example from Excel. Google BigQuery, OData, SAP Fieldglass, SAP Concur, etc.
- Excel, CVS files
There are sections below with a quick overview of integration with SAP BPC, SAP BW and SAP S/4HANA.
Also, SAP Analytics Hub allows you to bring data from your different on-premise and cloud systems and centralize them in a single front-end platform (we will go deeper on this in a future blog).
Data Models in SAP Analytics Cloud
Data Modelling is the process of setting up, connecting, preparing and finally modeling the data.
Depending on what you want to do, you can create:
- Analysis Model: Uses the data only in read-mode. You can upload data from an excel, get it from different sources.
- Planning Model: The main difference in Planning model , is that you can generate, input and edit data within the application. It is pre-configured with dimensions for time and and categories.
See the options you have to create your model:
Image created by Ignacio Kristof
Data Analysis and Visualization with SAP Analytics Cloud.
User experience and visualization are one of the great features of SAP Analytics Cloud. In the next points we will see an overview of some key aspects.
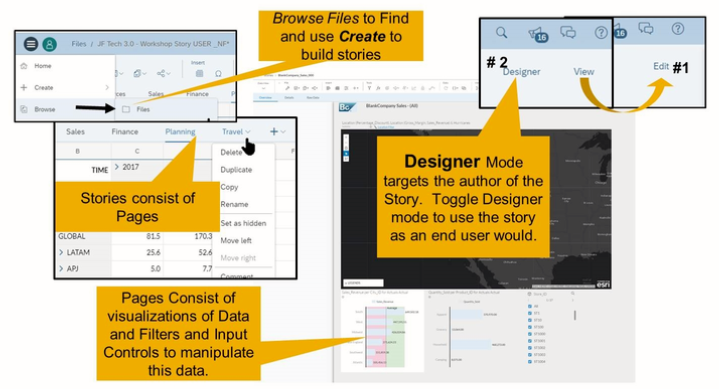
- Stories: A Story in SAP Analytics Cloud is a collection of charts, texts, images, tables used to generated a nice style presentation for certain audience. With the same data you could create different stories. For example, with data from Sales and Account Receivables, people from Treasury may be interested in DSO, and Sales Management on the Sales per region.
To create a Story, you do it from Home Page à Create à Story. And you will find the following options:
- Access and Explore Data: You can add data from a file, live connection or other sources to explorer the data and create different visuals.
- Add a Grid Page: You can add data from one or more models and display the information similarly to an excel sheet.
- Add a Canvas Page: You can add a Canvas to your story, to show info with a better visual model.
- Add a Responsive Page: You can create a responsive page for mobile devices. The same model or info will be arranged for mobile device screen.
Image from SAP Handbook SAPC01
Within a Canvas Page, you can:
- Add Chats, Images, Visualizations.
- Geo Maps: You can create Geo Maps to analyze geographical data, assisted by the geo-spatial capabilities of HANA.
Image created by Ignacio Kristof
Some cool features that you can find when working in your Story:
- Smart Discovery: By selecting Smart Discovery in the story, it will show some analysis in the information in your model, like Average, largest contributor, etc.
Image created by Ignacio Kristof
- Smart Discovery: It is a predictive analytics tool that helps you to discover different perspective on the data or relations. It will open a new page with new charts and graphics autogenerated.
- R Visualization: R is an open source programming language and environment for statistical computing and graphics. R provides a wide variety of statistical (linear and nonlinear modelling, classical statistical tests, time-series analysis, classification, clustering, …) and graphical techniques, and is highly extensible. It integrates with SAP Analytics Cloud to create visualizations based on R scripts.
Image from SAP Handbook SAPC01
Planning
SAP Analytics Cloud is setting a new standard for Financial Planning & analysis by combining business intelligence and planning, together in the cloud.
Image from SAP Handbook SAPC01
Several features are available in SAP Analytics Cloud, to execute planning tasks. The core features for planning capabilities are the following ones:
- Version Management: You can create different versions for the plans and maintain different categories, like Budget and Actuals.
- Data Entry: Imagine you have a plan with numbers, and you want to modify it by increasing sales volume or prices, to play with different scenarios. You can simply enter data manually in a table , copy / paste, spread values .
- Structure Allocations: You can use structured allocations to stablish a reusable process for allocating values. SAC simplifies the process of building complex allocations.
- Currency: You can display data in different currencies and modify FX rates on the fly.
- Input Tasks: You can assign a Story Page to users who are responsible for a dimension, for example Sales, and ask them to enter the data directly.
- Integration with SAP Analysis for MS Office: Analysis for office has not only the ability to consume data from SAP Analytic Cloud, but contribute directly to SAP Analytics Cloud.
- Value Driver Tree (VDT): Allows you to play with different models and show the end to end result for the different scenarios.
Image from SAP Handbook SAPC01
Image from SAP Handbook SAPC01
To use planning features, you need to work with planning models and have the proper permissions.
To start a simple plan, you can start from a blank model, adding dimensions manually or selecting existing dimensions. The blank planning model includes Actual, Budget, Planning and Forecast as predefined categories.
Integration with SAP BW
SAP Analytics Cloud integrates with SAP BW without replication required. The advantage is that you can use your existing data models in BW to generate views in SAP Analytics Cloud.
Image from SAP Handbook SAPC01
Check the following comparisons for connectivity options:
Image from SAP Handbook SAPC01
SAP Analytics Cloud and BPC
SAC and BPC have bi-directional integration. SAP Analytics Cloud it is not a success for for BPC but a complimentary tool. For example, a company uses BPC as it’s main planning tool but wants to use a Cloud planning app for other line of business.
Image from SAP Handbook SAPC01
You can do:
- Batch integration: Makes more usage of SAC calculation engine.
- Near Real time integration: Makes more use of BPC calculation engine.
Image from SAP Handbook SAPC01
As example:
1.I quickly put an Excel toghether with some key data.
2.Uploaded to SAP Analytics Cloud and built a model with AP data:
- Company Code
- Country
- Category of expense
- Balance to certain dates
3.Selected an existing template
4.After editing some aspects , I obtained a visual dashboard much more visual than just a table
- SAP Managed Tags:
- SAP Analytics Cloud
You must be a registered user to add a comment. If you've already registered, sign in. Otherwise, register and sign in.
Labels in this area
-
"automatische backups"
1 -
"regelmäßige sicherung"
1 -
"TypeScript" "Development" "FeedBack"
1 -
505 Technology Updates 53
1 -
ABAP
14 -
ABAP API
1 -
ABAP CDS Views
2 -
ABAP CDS Views - BW Extraction
1 -
ABAP CDS Views - CDC (Change Data Capture)
1 -
ABAP class
2 -
ABAP Cloud
2 -
ABAP Development
5 -
ABAP in Eclipse
1 -
ABAP Platform Trial
1 -
ABAP Programming
2 -
abap technical
1 -
absl
2 -
access data from SAP Datasphere directly from Snowflake
1 -
Access data from SAP datasphere to Qliksense
1 -
Accrual
1 -
action
1 -
adapter modules
1 -
Addon
1 -
Adobe Document Services
1 -
ADS
1 -
ADS Config
1 -
ADS with ABAP
1 -
ADS with Java
1 -
ADT
2 -
Advance Shipping and Receiving
1 -
Advanced Event Mesh
3 -
AEM
1 -
AI
7 -
AI Launchpad
1 -
AI Projects
1 -
AIML
9 -
Alert in Sap analytical cloud
1 -
Amazon S3
1 -
Analytical Dataset
1 -
Analytical Model
1 -
Analytics
1 -
Analyze Workload Data
1 -
annotations
1 -
API
1 -
API and Integration
3 -
API Call
2 -
Application Architecture
1 -
Application Development
5 -
Application Development for SAP HANA Cloud
3 -
Applications and Business Processes (AP)
1 -
Artificial Intelligence
1 -
Artificial Intelligence (AI)
5 -
Artificial Intelligence (AI) 1 Business Trends 363 Business Trends 8 Digital Transformation with Cloud ERP (DT) 1 Event Information 462 Event Information 15 Expert Insights 114 Expert Insights 76 Life at SAP 418 Life at SAP 1 Product Updates 4
1 -
Artificial Intelligence (AI) blockchain Data & Analytics
1 -
Artificial Intelligence (AI) blockchain Data & Analytics Intelligent Enterprise
1 -
Artificial Intelligence (AI) blockchain Data & Analytics Intelligent Enterprise Oil Gas IoT Exploration Production
1 -
Artificial Intelligence (AI) blockchain Data & Analytics Intelligent Enterprise sustainability responsibility esg social compliance cybersecurity risk
1 -
ASE
1 -
ASR
2 -
ASUG
1 -
Attachments
1 -
Authorisations
1 -
Automating Processes
1 -
Automation
2 -
aws
2 -
Azure
1 -
Azure AI Studio
1 -
B2B Integration
1 -
Backorder Processing
1 -
Backup
1 -
Backup and Recovery
1 -
Backup schedule
1 -
BADI_MATERIAL_CHECK error message
1 -
Bank
1 -
BAS
1 -
basis
2 -
Basis Monitoring & Tcodes with Key notes
2 -
Batch Management
1 -
BDC
1 -
Best Practice
1 -
bitcoin
1 -
Blockchain
3 -
bodl
1 -
BOP in aATP
1 -
BOP Segments
1 -
BOP Strategies
1 -
BOP Variant
1 -
BPC
1 -
BPC LIVE
1 -
BTP
12 -
BTP Destination
2 -
Business AI
1 -
Business and IT Integration
1 -
Business application stu
1 -
Business Application Studio
1 -
Business Architecture
1 -
Business Communication Services
1 -
Business Continuity
1 -
Business Data Fabric
3 -
Business Partner
12 -
Business Partner Master Data
10 -
Business Technology Platform
2 -
Business Trends
4 -
CA
1 -
calculation view
1 -
CAP
3 -
Capgemini
1 -
CAPM
1 -
Catalyst for Efficiency: Revolutionizing SAP Integration Suite with Artificial Intelligence (AI) and
1 -
CCMS
2 -
CDQ
12 -
CDS
2 -
Cental Finance
1 -
Certificates
1 -
CFL
1 -
Change Management
1 -
chatbot
1 -
chatgpt
3 -
CL_SALV_TABLE
2 -
Class Runner
1 -
Classrunner
1 -
Cloud ALM Monitoring
1 -
Cloud ALM Operations
1 -
cloud connector
1 -
Cloud Extensibility
1 -
Cloud Foundry
4 -
Cloud Integration
6 -
Cloud Platform Integration
2 -
cloudalm
1 -
communication
1 -
Compensation Information Management
1 -
Compensation Management
1 -
Compliance
1 -
Compound Employee API
1 -
Configuration
1 -
Connectors
1 -
Consolidation Extension for SAP Analytics Cloud
2 -
Control Indicators.
1 -
Controller-Service-Repository pattern
1 -
Conversion
1 -
Cosine similarity
1 -
cryptocurrency
1 -
CSI
1 -
ctms
1 -
Custom chatbot
3 -
Custom Destination Service
1 -
custom fields
1 -
Customer Experience
1 -
Customer Journey
1 -
Customizing
1 -
cyber security
3 -
Data
1 -
Data & Analytics
1 -
Data Aging
1 -
Data Analytics
2 -
Data and Analytics (DA)
1 -
Data Archiving
1 -
Data Back-up
1 -
Data Governance
5 -
Data Integration
2 -
Data Quality
12 -
Data Quality Management
12 -
Data Synchronization
1 -
data transfer
1 -
Data Unleashed
1 -
Data Value
8 -
database tables
1 -
Datasphere
2 -
datenbanksicherung
1 -
dba cockpit
1 -
dbacockpit
1 -
Debugging
2 -
Delimiting Pay Components
1 -
Delta Integrations
1 -
Destination
3 -
Destination Service
1 -
Developer extensibility
1 -
Developing with SAP Integration Suite
1 -
Devops
1 -
digital transformation
1 -
Documentation
1 -
Dot Product
1 -
DQM
1 -
dump database
1 -
dump transaction
1 -
e-Invoice
1 -
E4H Conversion
1 -
Eclipse ADT ABAP Development Tools
2 -
edoc
1 -
edocument
1 -
ELA
1 -
Embedded Consolidation
1 -
Embedding
1 -
Embeddings
1 -
Employee Central
1 -
Employee Central Payroll
1 -
Employee Central Time Off
1 -
Employee Information
1 -
Employee Rehires
1 -
Enable Now
1 -
Enable now manager
1 -
endpoint
1 -
Enhancement Request
1 -
Enterprise Architecture
1 -
ETL Business Analytics with SAP Signavio
1 -
Euclidean distance
1 -
Event Dates
1 -
Event Driven Architecture
1 -
Event Mesh
2 -
Event Reason
1 -
EventBasedIntegration
1 -
EWM
1 -
EWM Outbound configuration
1 -
EWM-TM-Integration
1 -
Existing Event Changes
1 -
Expand
1 -
Expert
2 -
Expert Insights
2 -
Fiori
14 -
Fiori Elements
2 -
Fiori SAPUI5
12 -
Flask
1 -
Full Stack
8 -
Funds Management
1 -
General
1 -
Generative AI
1 -
Getting Started
1 -
GitHub
8 -
Grants Management
1 -
groovy
1 -
GTP
1 -
HANA
6 -
HANA Cloud
2 -
Hana Cloud Database Integration
2 -
HANA DB
2 -
HANA XS Advanced
1 -
Historical Events
1 -
home labs
1 -
HowTo
1 -
HR Data Management
1 -
html5
8 -
HTML5 Application
1 -
Identity cards validation
1 -
idm
1 -
Implementation
1 -
input parameter
1 -
instant payments
1 -
Integration
3 -
Integration Advisor
1 -
Integration Architecture
1 -
Integration Center
1 -
Integration Suite
1 -
intelligent enterprise
1 -
iot
1 -
Java
1 -
job
1 -
Job Information Changes
1 -
Job-Related Events
1 -
Job_Event_Information
1 -
joule
4 -
Journal Entries
1 -
Just Ask
1 -
Kerberos for ABAP
8 -
Kerberos for JAVA
8 -
KNN
1 -
Launch Wizard
1 -
learning content
2 -
Life at SAP
5 -
lightning
1 -
Linear Regression SAP HANA Cloud
1 -
local tax regulations
1 -
LP
1 -
Machine Learning
2 -
Marketing
1 -
Master Data
3 -
Master Data Management
14 -
Maxdb
2 -
MDG
1 -
MDGM
1 -
MDM
1 -
Message box.
1 -
Messages on RF Device
1 -
Microservices Architecture
1 -
Microsoft Universal Print
1 -
Middleware Solutions
1 -
Migration
5 -
ML Model Development
1 -
Modeling in SAP HANA Cloud
8 -
Monitoring
3 -
MTA
1 -
Multi-Record Scenarios
1 -
Multiple Event Triggers
1 -
Neo
1 -
New Event Creation
1 -
New Feature
1 -
Newcomer
1 -
NodeJS
2 -
ODATA
2 -
OData APIs
1 -
odatav2
1 -
ODATAV4
1 -
ODBC
1 -
ODBC Connection
1 -
Onpremise
1 -
open source
2 -
OpenAI API
1 -
Oracle
1 -
PaPM
1 -
PaPM Dynamic Data Copy through Writer function
1 -
PaPM Remote Call
1 -
PAS-C01
1 -
Pay Component Management
1 -
PGP
1 -
Pickle
1 -
PLANNING ARCHITECTURE
1 -
Popup in Sap analytical cloud
1 -
PostgrSQL
1 -
POSTMAN
1 -
Process Automation
2 -
Product Updates
4 -
PSM
1 -
Public Cloud
1 -
Python
4 -
Qlik
1 -
Qualtrics
1 -
RAP
3 -
RAP BO
2 -
Record Deletion
1 -
Recovery
1 -
recurring payments
1 -
redeply
1 -
Release
1 -
Remote Consumption Model
1 -
Replication Flows
1 -
research
1 -
Resilience
1 -
REST
1 -
REST API
1 -
Retagging Required
1 -
Risk
1 -
Rolling Kernel Switch
1 -
route
1 -
rules
1 -
S4 HANA
1 -
S4 HANA Cloud
1 -
S4 HANA On-Premise
1 -
S4HANA
3 -
S4HANA_OP_2023
2 -
SAC
10 -
SAC PLANNING
9 -
SAP
4 -
SAP ABAP
1 -
SAP Advanced Event Mesh
1 -
SAP AI Core
8 -
SAP AI Launchpad
8 -
SAP Analytic Cloud Compass
1 -
Sap Analytical Cloud
1 -
SAP Analytics Cloud
4 -
SAP Analytics Cloud for Consolidation
3 -
SAP Analytics Cloud Story
1 -
SAP analytics clouds
1 -
SAP BAS
1 -
SAP Basis
6 -
SAP BODS
1 -
SAP BODS certification.
1 -
SAP BTP
21 -
SAP BTP Build Work Zone
2 -
SAP BTP Cloud Foundry
6 -
SAP BTP Costing
1 -
SAP BTP CTMS
1 -
SAP BTP Innovation
1 -
SAP BTP Migration Tool
1 -
SAP BTP SDK IOS
1 -
SAP Build
11 -
SAP Build App
1 -
SAP Build apps
1 -
SAP Build CodeJam
1 -
SAP Build Process Automation
3 -
SAP Build work zone
10 -
SAP Business Objects Platform
1 -
SAP Business Technology
2 -
SAP Business Technology Platform (XP)
1 -
sap bw
1 -
SAP CAP
2 -
SAP CDC
1 -
SAP CDP
1 -
SAP CDS VIEW
1 -
SAP Certification
1 -
SAP Cloud ALM
4 -
SAP Cloud Application Programming Model
1 -
SAP Cloud Integration for Data Services
1 -
SAP cloud platform
8 -
SAP Companion
1 -
SAP CPI
3 -
SAP CPI (Cloud Platform Integration)
2 -
SAP CPI Discover tab
1 -
sap credential store
1 -
SAP Customer Data Cloud
1 -
SAP Customer Data Platform
1 -
SAP Data Intelligence
1 -
SAP Data Migration in Retail Industry
1 -
SAP Data Services
1 -
SAP DATABASE
1 -
SAP Dataspher to Non SAP BI tools
1 -
SAP Datasphere
10 -
SAP DRC
1 -
SAP EWM
1 -
SAP Fiori
2 -
SAP Fiori App Embedding
1 -
Sap Fiori Extension Project Using BAS
1 -
SAP GRC
1 -
SAP HANA
1 -
SAP HCM (Human Capital Management)
1 -
SAP HR Solutions
1 -
SAP IDM
1 -
SAP Integration Suite
9 -
SAP Integrations
4 -
SAP iRPA
2 -
SAP Learning Class
1 -
SAP Learning Hub
1 -
SAP Odata
2 -
SAP on Azure
1 -
SAP PartnerEdge
1 -
sap partners
1 -
SAP Password Reset
1 -
SAP PO Migration
1 -
SAP Prepackaged Content
1 -
SAP Process Automation
2 -
SAP Process Integration
2 -
SAP Process Orchestration
1 -
SAP S4HANA
2 -
SAP S4HANA Cloud
1 -
SAP S4HANA Cloud for Finance
1 -
SAP S4HANA Cloud private edition
1 -
SAP Sandbox
1 -
SAP STMS
1 -
SAP successfactors
3 -
SAP SuccessFactors HXM Core
1 -
SAP Time
1 -
SAP TM
2 -
SAP Trading Partner Management
1 -
SAP UI5
1 -
SAP Upgrade
1 -
SAP Utilities
1 -
SAP-GUI
8 -
SAP_COM_0276
1 -
SAPBTP
1 -
SAPCPI
1 -
SAPEWM
1 -
sapmentors
1 -
saponaws
2 -
SAPS4HANA
1 -
SAPUI5
4 -
schedule
1 -
Secure Login Client Setup
8 -
security
9 -
Selenium Testing
1 -
SEN
1 -
SEN Manager
1 -
service
1 -
SET_CELL_TYPE
1 -
SET_CELL_TYPE_COLUMN
1 -
SFTP scenario
2 -
Simplex
1 -
Single Sign On
8 -
Singlesource
1 -
SKLearn
1 -
soap
1 -
Software Development
1 -
SOLMAN
1 -
solman 7.2
2 -
Solution Manager
3 -
sp_dumpdb
1 -
sp_dumptrans
1 -
SQL
1 -
sql script
1 -
SSL
8 -
SSO
8 -
Substring function
1 -
SuccessFactors
1 -
SuccessFactors Platform
1 -
SuccessFactors Time Tracking
1 -
Sybase
1 -
system copy method
1 -
System owner
1 -
Table splitting
1 -
Tax Integration
1 -
Technical article
1 -
Technical articles
1 -
Technology Updates
14 -
Technology Updates
1 -
Technology_Updates
1 -
terraform
1 -
Threats
1 -
Time Collectors
1 -
Time Off
2 -
Time Sheet
1 -
Time Sheet SAP SuccessFactors Time Tracking
1 -
Tips and tricks
2 -
toggle button
1 -
Tools
1 -
Trainings & Certifications
1 -
Transport in SAP BODS
1 -
Transport Management
1 -
TypeScript
2 -
ui designer
1 -
unbind
1 -
Unified Customer Profile
1 -
UPB
1 -
Use of Parameters for Data Copy in PaPM
1 -
User Unlock
1 -
VA02
1 -
Validations
1 -
Vector Database
2 -
Vector Engine
1 -
Visual Studio Code
1 -
VSCode
1 -
Web SDK
1 -
work zone
1 -
workload
1 -
xsa
1 -
XSA Refresh
1
- « Previous
- Next »
Related Content
- SAP Datasphere test tenant ? in Technology Q&A
- Issues with "SAP Analytics Cloud, add-in for Microsoft Excel" while working with SAP Datasphere in Technology Q&A
- SAP Analytics Cloud Excel Add In - Multiple Tables in Technology Q&A
- SAP Analytics Cloud, add-in for Microsoft Excel and SAP Datasphere connection in Technology Blogs by SAP
- Improvising Time Management in SAP S/4HANA Cloud: A Co-Innovation Solution in Technology Blogs by SAP
Top kudoed authors
| User | Count |
|---|---|
| 10 | |
| 9 | |
| 5 | |
| 4 | |
| 4 | |
| 3 | |
| 3 | |
| 3 | |
| 3 | |
| 3 |