
- SAP Community
- Products and Technology
- Technology
- Technology Blogs by Members
- SocialHero: Improving Health and Well-Being
Technology Blogs by Members
Explore a vibrant mix of technical expertise, industry insights, and tech buzz in member blogs covering SAP products, technology, and events. Get in the mix!
Turn on suggestions
Auto-suggest helps you quickly narrow down your search results by suggesting possible matches as you type.
Showing results for
Former Member
Options
- Subscribe to RSS Feed
- Mark as New
- Mark as Read
- Bookmark
- Subscribe
- Printer Friendly Page
- Report Inappropriate Content
12-03-2018
5:24 AM
Introduction
As a daughter, granddaughter, and future mother, it is highly important to me that people are able to live long, healthy lives and see the ones they love grow older; I believe that all parents should be able to watch their children grow up and, eventually, become parents of their own. As a result, I chose to look into Sustainability Development Goal 3: Good Health and Well-Being, focused on ensuring healthy lives and promoting well-being for all at all ages. For my story, I used the life expectancy by gender data on Singapore provided by SAP as well as GDP data from the World Bank.
Visualizations and Key Insights

Using SAP Analytics Cloud, I displayed life expectancies in Singapore for males and females, showcased in figure 1, and saw an increasing trend in life expectancy for each from 2004 to 2014. Over the 10-year period, the male life expectancy increased by four years, while the female life expectancy increased by three.
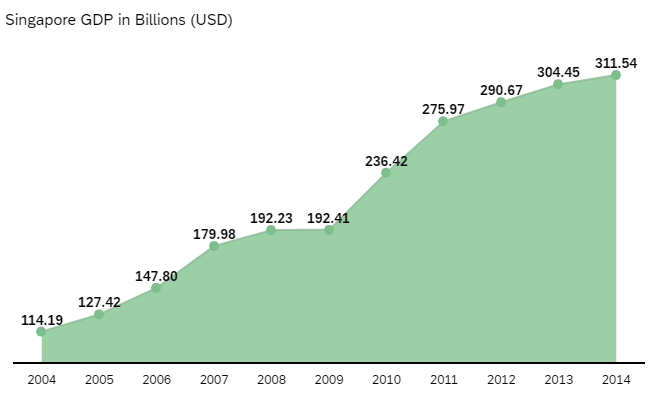 Figure 2: Singapore GDP in Billions (USD)
I then looked into Singapore’s GDP over the same time frame using data from the World Bank, seeing if the economic indicator had also increased. As represented in figure 2, I saw GDP grew year-after-year, almost tripling in the 10-year timespan.

Figure 3: Singapore Male Life Expectancy vs. GDP in Billions (USD)

Figure 4: Singapore Female Life Expectancy in Years vs. GDP in Billions (USD)
I then created scatterplots analyzing the life expectancy of each gender against GDP, shown in figures 3 and 4. Each graphic depicts an increasing trend, indicating that an increase in GDP correlates with an increase in life expectancy, which is what I had anticipated. This is supported by Australia’s Department of Health, which states that economic well-being can impact life expectancy (“Tier 1,” 2012). Knowing this, I then calculated the slope of the best-fit line for each scatterplot, indicating that for every increase in GDP of $10 billion, the Singapore male life expectancy increases by 0.151 years and female by 0.126 years, respectively.
Implementation
Although this UN Sustainability goal is focused on understanding why people die and addressing the causes, it appears that general efforts – ones that do not specifically target a single disease or infection – can still be made that will positively impact people’s well-being, by increasing life expectancy. As GDP is tied to life expectancy, it is my recommendation that SAP invests in countries through monetary donations and technological implementations. Investment is a factor of GDP, which is why SAP should promote innovation by monetarily supporting companies and organizations focused on researching and developing treatments for noncommunicable and infectious diseases. SAP should further take its latest health technologies, like CancerLinQ, and work with companies and hospitals to make the services more readily available to patients throughout the world. These investments may help countries find the specific solutions needed to improve their citizens' health and would leave countries wealthier than before. Although there is no single solution for improving the well-being of all, investing in countries will improve economic well-being around the world and ultimately lead to an increased life expectancy for all.
Reference
Tier 1 life expectancy and wellbeing 1.19 life expectancy at birth. (2012, Nov 15). Australian Government Department of Health. Retrieved from http://www.health.gov.au/internet/publications/publishing.nsf/Content/oatsih-hpf-2012-toc~tier1~life...
As a daughter, granddaughter, and future mother, it is highly important to me that people are able to live long, healthy lives and see the ones they love grow older; I believe that all parents should be able to watch their children grow up and, eventually, become parents of their own. As a result, I chose to look into Sustainability Development Goal 3: Good Health and Well-Being, focused on ensuring healthy lives and promoting well-being for all at all ages. For my story, I used the life expectancy by gender data on Singapore provided by SAP as well as GDP data from the World Bank.
Visualizations and Key Insights
Figure 1: Singapore Life Expectancy in Years by Gender
Using SAP Analytics Cloud, I displayed life expectancies in Singapore for males and females, showcased in figure 1, and saw an increasing trend in life expectancy for each from 2004 to 2014. Over the 10-year period, the male life expectancy increased by four years, while the female life expectancy increased by three.
Figure 2: Singapore GDP in Billions (USD) I then looked into Singapore’s GDP over the same time frame using data from the World Bank, seeing if the economic indicator had also increased. As represented in figure 2, I saw GDP grew year-after-year, almost tripling in the 10-year timespan.
Figure 3: Singapore Male Life Expectancy vs. GDP in Billions (USD)
Figure 4: Singapore Female Life Expectancy in Years vs. GDP in Billions (USD)
I then created scatterplots analyzing the life expectancy of each gender against GDP, shown in figures 3 and 4. Each graphic depicts an increasing trend, indicating that an increase in GDP correlates with an increase in life expectancy, which is what I had anticipated. This is supported by Australia’s Department of Health, which states that economic well-being can impact life expectancy (“Tier 1,” 2012). Knowing this, I then calculated the slope of the best-fit line for each scatterplot, indicating that for every increase in GDP of $10 billion, the Singapore male life expectancy increases by 0.151 years and female by 0.126 years, respectively.
Implementation
Although this UN Sustainability goal is focused on understanding why people die and addressing the causes, it appears that general efforts – ones that do not specifically target a single disease or infection – can still be made that will positively impact people’s well-being, by increasing life expectancy. As GDP is tied to life expectancy, it is my recommendation that SAP invests in countries through monetary donations and technological implementations. Investment is a factor of GDP, which is why SAP should promote innovation by monetarily supporting companies and organizations focused on researching and developing treatments for noncommunicable and infectious diseases. SAP should further take its latest health technologies, like CancerLinQ, and work with companies and hospitals to make the services more readily available to patients throughout the world. These investments may help countries find the specific solutions needed to improve their citizens' health and would leave countries wealthier than before. Although there is no single solution for improving the well-being of all, investing in countries will improve economic well-being around the world and ultimately lead to an increased life expectancy for all.
Reference
Tier 1 life expectancy and wellbeing 1.19 life expectancy at birth. (2012, Nov 15). Australian Government Department of Health. Retrieved from http://www.health.gov.au/internet/publications/publishing.nsf/Content/oatsih-hpf-2012-toc~tier1~life...
- SAP Managed Tags:
- SAP Analytics Cloud
You must be a registered user to add a comment. If you've already registered, sign in. Otherwise, register and sign in.
Labels in this area
-
"automatische backups"
1 -
"regelmäßige sicherung"
1 -
"TypeScript" "Development" "FeedBack"
1 -
505 Technology Updates 53
1 -
ABAP
14 -
ABAP API
1 -
ABAP CDS Views
2 -
ABAP CDS Views - BW Extraction
1 -
ABAP CDS Views - CDC (Change Data Capture)
1 -
ABAP class
2 -
ABAP Cloud
2 -
ABAP Development
5 -
ABAP in Eclipse
1 -
ABAP Platform Trial
1 -
ABAP Programming
2 -
abap technical
1 -
absl
1 -
access data from SAP Datasphere directly from Snowflake
1 -
Access data from SAP datasphere to Qliksense
1 -
Accrual
1 -
action
1 -
adapter modules
1 -
Addon
1 -
Adobe Document Services
1 -
ADS
1 -
ADS Config
1 -
ADS with ABAP
1 -
ADS with Java
1 -
ADT
2 -
Advance Shipping and Receiving
1 -
Advanced Event Mesh
3 -
AEM
1 -
AI
7 -
AI Launchpad
1 -
AI Projects
1 -
AIML
9 -
Alert in Sap analytical cloud
1 -
Amazon S3
1 -
Analytical Dataset
1 -
Analytical Model
1 -
Analytics
1 -
Analyze Workload Data
1 -
annotations
1 -
API
1 -
API and Integration
3 -
API Call
2 -
Application Architecture
1 -
Application Development
5 -
Application Development for SAP HANA Cloud
3 -
Applications and Business Processes (AP)
1 -
Artificial Intelligence
1 -
Artificial Intelligence (AI)
4 -
Artificial Intelligence (AI) 1 Business Trends 363 Business Trends 8 Digital Transformation with Cloud ERP (DT) 1 Event Information 462 Event Information 15 Expert Insights 114 Expert Insights 76 Life at SAP 418 Life at SAP 1 Product Updates 4
1 -
Artificial Intelligence (AI) blockchain Data & Analytics
1 -
Artificial Intelligence (AI) blockchain Data & Analytics Intelligent Enterprise
1 -
Artificial Intelligence (AI) blockchain Data & Analytics Intelligent Enterprise Oil Gas IoT Exploration Production
1 -
Artificial Intelligence (AI) blockchain Data & Analytics Intelligent Enterprise sustainability responsibility esg social compliance cybersecurity risk
1 -
ASE
1 -
ASR
2 -
ASUG
1 -
Attachments
1 -
Authorisations
1 -
Automating Processes
1 -
Automation
1 -
aws
2 -
Azure
1 -
Azure AI Studio
1 -
B2B Integration
1 -
Backorder Processing
1 -
Backup
1 -
Backup and Recovery
1 -
Backup schedule
1 -
BADI_MATERIAL_CHECK error message
1 -
Bank
1 -
BAS
1 -
basis
2 -
Basis Monitoring & Tcodes with Key notes
2 -
Batch Management
1 -
BDC
1 -
Best Practice
1 -
bitcoin
1 -
Blockchain
3 -
BOP in aATP
1 -
BOP Segments
1 -
BOP Strategies
1 -
BOP Variant
1 -
BPC
1 -
BPC LIVE
1 -
BTP
11 -
BTP Destination
2 -
Business AI
1 -
Business and IT Integration
1 -
Business application stu
1 -
Business Application Studio
1 -
Business Architecture
1 -
Business Communication Services
1 -
Business Continuity
1 -
Business Data Fabric
3 -
Business Partner
12 -
Business Partner Master Data
10 -
Business Technology Platform
2 -
Business Trends
1 -
CA
1 -
calculation view
1 -
CAP
3 -
Capgemini
1 -
CAPM
1 -
Catalyst for Efficiency: Revolutionizing SAP Integration Suite with Artificial Intelligence (AI) and
1 -
CCMS
2 -
CDQ
12 -
CDS
2 -
Cental Finance
1 -
Certificates
1 -
CFL
1 -
Change Management
1 -
chatbot
1 -
chatgpt
3 -
CL_SALV_TABLE
2 -
Class Runner
1 -
Classrunner
1 -
Cloud ALM Monitoring
1 -
Cloud ALM Operations
1 -
cloud connector
1 -
Cloud Extensibility
1 -
Cloud Foundry
4 -
Cloud Integration
6 -
Cloud Platform Integration
2 -
cloudalm
1 -
communication
1 -
Compensation Information Management
1 -
Compensation Management
1 -
Compliance
1 -
Compound Employee API
1 -
Configuration
1 -
Connectors
1 -
Consolidation Extension for SAP Analytics Cloud
1 -
Controller-Service-Repository pattern
1 -
Conversion
1 -
Cosine similarity
1 -
cryptocurrency
1 -
CSI
1 -
ctms
1 -
Custom chatbot
3 -
Custom Destination Service
1 -
custom fields
1 -
Customer Experience
1 -
Customer Journey
1 -
Customizing
1 -
Cyber Security
2 -
Data
1 -
Data & Analytics
1 -
Data Aging
1 -
Data Analytics
2 -
Data and Analytics (DA)
1 -
Data Archiving
1 -
Data Back-up
1 -
Data Governance
5 -
Data Integration
2 -
Data Quality
12 -
Data Quality Management
12 -
Data Synchronization
1 -
data transfer
1 -
Data Unleashed
1 -
Data Value
8 -
database tables
1 -
Datasphere
2 -
datenbanksicherung
1 -
dba cockpit
1 -
dbacockpit
1 -
Debugging
2 -
Delimiting Pay Components
1 -
Delta Integrations
1 -
Destination
3 -
Destination Service
1 -
Developer extensibility
1 -
Developing with SAP Integration Suite
1 -
Devops
1 -
digital transformation
1 -
Documentation
1 -
Dot Product
1 -
DQM
1 -
dump database
1 -
dump transaction
1 -
e-Invoice
1 -
E4H Conversion
1 -
Eclipse ADT ABAP Development Tools
2 -
edoc
1 -
edocument
1 -
ELA
1 -
Embedded Consolidation
1 -
Embedding
1 -
Embeddings
1 -
Employee Central
1 -
Employee Central Payroll
1 -
Employee Central Time Off
1 -
Employee Information
1 -
Employee Rehires
1 -
Enable Now
1 -
Enable now manager
1 -
endpoint
1 -
Enhancement Request
1 -
Enterprise Architecture
1 -
ETL Business Analytics with SAP Signavio
1 -
Euclidean distance
1 -
Event Dates
1 -
Event Driven Architecture
1 -
Event Mesh
2 -
Event Reason
1 -
EventBasedIntegration
1 -
EWM
1 -
EWM Outbound configuration
1 -
EWM-TM-Integration
1 -
Existing Event Changes
1 -
Expand
1 -
Expert
2 -
Expert Insights
1 -
Fiori
14 -
Fiori Elements
2 -
Fiori SAPUI5
12 -
Flask
1 -
Full Stack
8 -
Funds Management
1 -
General
1 -
Generative AI
1 -
Getting Started
1 -
GitHub
8 -
Grants Management
1 -
groovy
1 -
GTP
1 -
HANA
5 -
HANA Cloud
2 -
Hana Cloud Database Integration
2 -
HANA DB
1 -
HANA XS Advanced
1 -
Historical Events
1 -
home labs
1 -
HowTo
1 -
HR Data Management
1 -
html5
8 -
HTML5 Application
1 -
Identity cards validation
1 -
idm
1 -
Implementation
1 -
input parameter
1 -
instant payments
1 -
Integration
3 -
Integration Advisor
1 -
Integration Architecture
1 -
Integration Center
1 -
Integration Suite
1 -
intelligent enterprise
1 -
Java
1 -
job
1 -
Job Information Changes
1 -
Job-Related Events
1 -
Job_Event_Information
1 -
joule
4 -
Journal Entries
1 -
Just Ask
1 -
Kerberos for ABAP
8 -
Kerberos for JAVA
8 -
Launch Wizard
1 -
Learning Content
2 -
Life at SAP
1 -
lightning
1 -
Linear Regression SAP HANA Cloud
1 -
local tax regulations
1 -
LP
1 -
Machine Learning
2 -
Marketing
1 -
Master Data
3 -
Master Data Management
14 -
Maxdb
2 -
MDG
1 -
MDGM
1 -
MDM
1 -
Message box.
1 -
Messages on RF Device
1 -
Microservices Architecture
1 -
Microsoft Universal Print
1 -
Middleware Solutions
1 -
Migration
5 -
ML Model Development
1 -
Modeling in SAP HANA Cloud
8 -
Monitoring
3 -
MTA
1 -
Multi-Record Scenarios
1 -
Multiple Event Triggers
1 -
Neo
1 -
New Event Creation
1 -
New Feature
1 -
Newcomer
1 -
NodeJS
2 -
ODATA
2 -
OData APIs
1 -
odatav2
1 -
ODATAV4
1 -
ODBC
1 -
ODBC Connection
1 -
Onpremise
1 -
open source
2 -
OpenAI API
1 -
Oracle
1 -
PaPM
1 -
PaPM Dynamic Data Copy through Writer function
1 -
PaPM Remote Call
1 -
PAS-C01
1 -
Pay Component Management
1 -
PGP
1 -
Pickle
1 -
PLANNING ARCHITECTURE
1 -
Popup in Sap analytical cloud
1 -
PostgrSQL
1 -
POSTMAN
1 -
Process Automation
2 -
Product Updates
4 -
PSM
1 -
Public Cloud
1 -
Python
4 -
Qlik
1 -
Qualtrics
1 -
RAP
3 -
RAP BO
2 -
Record Deletion
1 -
Recovery
1 -
recurring payments
1 -
redeply
1 -
Release
1 -
Remote Consumption Model
1 -
Replication Flows
1 -
Research
1 -
Resilience
1 -
REST
1 -
REST API
1 -
Retagging Required
1 -
Risk
1 -
Rolling Kernel Switch
1 -
route
1 -
rules
1 -
S4 HANA
1 -
S4 HANA Cloud
1 -
S4 HANA On-Premise
1 -
S4HANA
3 -
S4HANA_OP_2023
2 -
SAC
10 -
SAC PLANNING
9 -
SAP
4 -
SAP ABAP
1 -
SAP Advanced Event Mesh
1 -
SAP AI Core
8 -
SAP AI Launchpad
8 -
SAP Analytic Cloud Compass
1 -
Sap Analytical Cloud
1 -
SAP Analytics Cloud
4 -
SAP Analytics Cloud for Consolidation
2 -
SAP Analytics Cloud Story
1 -
SAP analytics clouds
1 -
SAP BAS
1 -
SAP Basis
6 -
SAP BODS
1 -
SAP BODS certification.
1 -
SAP BTP
20 -
SAP BTP Build Work Zone
2 -
SAP BTP Cloud Foundry
5 -
SAP BTP Costing
1 -
SAP BTP CTMS
1 -
SAP BTP Innovation
1 -
SAP BTP Migration Tool
1 -
SAP BTP SDK IOS
1 -
SAP Build
11 -
SAP Build App
1 -
SAP Build apps
1 -
SAP Build CodeJam
1 -
SAP Build Process Automation
3 -
SAP Build work zone
10 -
SAP Business Objects Platform
1 -
SAP Business Technology
2 -
SAP Business Technology Platform (XP)
1 -
sap bw
1 -
SAP CAP
2 -
SAP CDC
1 -
SAP CDP
1 -
SAP Certification
1 -
SAP Cloud ALM
4 -
SAP Cloud Application Programming Model
1 -
SAP Cloud Integration for Data Services
1 -
SAP cloud platform
8 -
SAP Companion
1 -
SAP CPI
3 -
SAP CPI (Cloud Platform Integration)
2 -
SAP CPI Discover tab
1 -
sap credential store
1 -
SAP Customer Data Cloud
1 -
SAP Customer Data Platform
1 -
SAP Data Intelligence
1 -
SAP Data Migration in Retail Industry
1 -
SAP Data Services
1 -
SAP DATABASE
1 -
SAP Dataspher to Non SAP BI tools
1 -
SAP Datasphere
9 -
SAP DRC
1 -
SAP EWM
1 -
SAP Fiori
2 -
SAP Fiori App Embedding
1 -
Sap Fiori Extension Project Using BAS
1 -
SAP GRC
1 -
SAP HANA
1 -
SAP HCM (Human Capital Management)
1 -
SAP HR Solutions
1 -
SAP IDM
1 -
SAP Integration Suite
9 -
SAP Integrations
4 -
SAP iRPA
2 -
SAP Learning Class
1 -
SAP Learning Hub
1 -
SAP Odata
2 -
SAP on Azure
1 -
SAP PartnerEdge
1 -
sap partners
1 -
SAP Password Reset
1 -
SAP PO Migration
1 -
SAP Prepackaged Content
1 -
SAP Process Automation
2 -
SAP Process Integration
2 -
SAP Process Orchestration
1 -
SAP S4HANA
2 -
SAP S4HANA Cloud
1 -
SAP S4HANA Cloud for Finance
1 -
SAP S4HANA Cloud private edition
1 -
SAP Sandbox
1 -
SAP STMS
1 -
SAP SuccessFactors
2 -
SAP SuccessFactors HXM Core
1 -
SAP Time
1 -
SAP TM
2 -
SAP Trading Partner Management
1 -
SAP UI5
1 -
SAP Upgrade
1 -
SAP-GUI
8 -
SAP_COM_0276
1 -
SAPBTP
1 -
SAPCPI
1 -
SAPEWM
1 -
sapmentors
1 -
saponaws
2 -
SAPUI5
4 -
schedule
1 -
Secure Login Client Setup
8 -
security
9 -
Selenium Testing
1 -
SEN
1 -
SEN Manager
1 -
service
1 -
SET_CELL_TYPE
1 -
SET_CELL_TYPE_COLUMN
1 -
SFTP scenario
2 -
Simplex
1 -
Single Sign On
8 -
Singlesource
1 -
SKLearn
1 -
soap
1 -
Software Development
1 -
SOLMAN
1 -
solman 7.2
2 -
Solution Manager
3 -
sp_dumpdb
1 -
sp_dumptrans
1 -
SQL
1 -
sql script
1 -
SSL
8 -
SSO
8 -
Substring function
1 -
SuccessFactors
1 -
SuccessFactors Time Tracking
1 -
Sybase
1 -
system copy method
1 -
System owner
1 -
Table splitting
1 -
Tax Integration
1 -
Technical article
1 -
Technical articles
1 -
Technology Updates
1 -
Technology Updates
1 -
Technology_Updates
1 -
Threats
1 -
Time Collectors
1 -
Time Off
2 -
Tips and tricks
2 -
Tools
1 -
Trainings & Certifications
1 -
Transport in SAP BODS
1 -
Transport Management
1 -
TypeScript
2 -
unbind
1 -
Unified Customer Profile
1 -
UPB
1 -
Use of Parameters for Data Copy in PaPM
1 -
User Unlock
1 -
VA02
1 -
Validations
1 -
Vector Database
1 -
Vector Engine
1 -
Visual Studio Code
1 -
VSCode
1 -
Web SDK
1 -
work zone
1 -
workload
1 -
xsa
1 -
XSA Refresh
1
- « Previous
- Next »
Related Content
- Revolutionizing Operations for Exceptional Senior Care, thanks to the power of Grow with SAP and Industry Cloud in Technology Blogs by SAP
- Hack2Build on SAP Build, Partners build 13 solution prototypes using SAP Build in Technology Blogs by SAP
- Cloud-based Analytics: A Powerful Tool for the CFO. in Technology Blogs by SAP
- Transforming Our World for the Better with Data in Technology Blogs by SAP
Top kudoed authors
| User | Count |
|---|---|
| 11 | |
| 10 | |
| 7 | |
| 6 | |
| 4 | |
| 4 | |
| 3 | |
| 3 | |
| 3 | |
| 3 |