


- SAP Community
- Products and Technology
- Technology
- Technology Blogs by SAP
- Performance tuning of LUMIRA reports running on BW...
Technology Blogs by SAP
Learn how to extend and personalize SAP applications. Follow the SAP technology blog for insights into SAP BTP, ABAP, SAP Analytics Cloud, SAP HANA, and more.
Turn on suggestions
Auto-suggest helps you quickly narrow down your search results by suggesting possible matches as you type.
Showing results for
former_member18
Explorer
Options
- Subscribe to RSS Feed
- Mark as New
- Mark as Read
- Bookmark
- Subscribe
- Printer Friendly Page
- Report Inappropriate Content
11-02-2018
12:57 PM
Continue..........
As we have seen in our previous blog on "How to tune BW using SMGW and SM50 transaction"
https://blogs.sap.com/2018/11/01/performance-tuning-of-lumira-reports-running-on-bw-part-1/
The below section explains using other transactions, in order to help debugging BW performance issues
3. Transaction - STAD ( Business Transaction Analysis )
STAD is used for performance analysis. It explains how the resource consumption has occurred on the BW side, while viewing the lumira reports. It provides BW statistics like DB time, CPU time,Memory etc on USER level.
- Login to SAP Logon -> Go to System -> Select System Status -> Note down the system time(i.e. Start Time)

- Open the Lumira document via Launchpad
- Again Go to System -> Select System Status -> Note down the system time(i.e. End time)

- Execute STAD transition -> fill the start time as the one recorded and provide the duration of the run(i.e. 3min) -> click enter.

- Statistics of all the RFC calls triggered , during the viewing of lumira document is captured and its corresponding metrics is captured. It has a “column named USER” that can be used to track user specific activities.

- These statistics gives an initial feel of "how BW is responding" to the request triggered by Lumira server.
- Lumira processing time can be thus captured as = End to end response time - BW response time
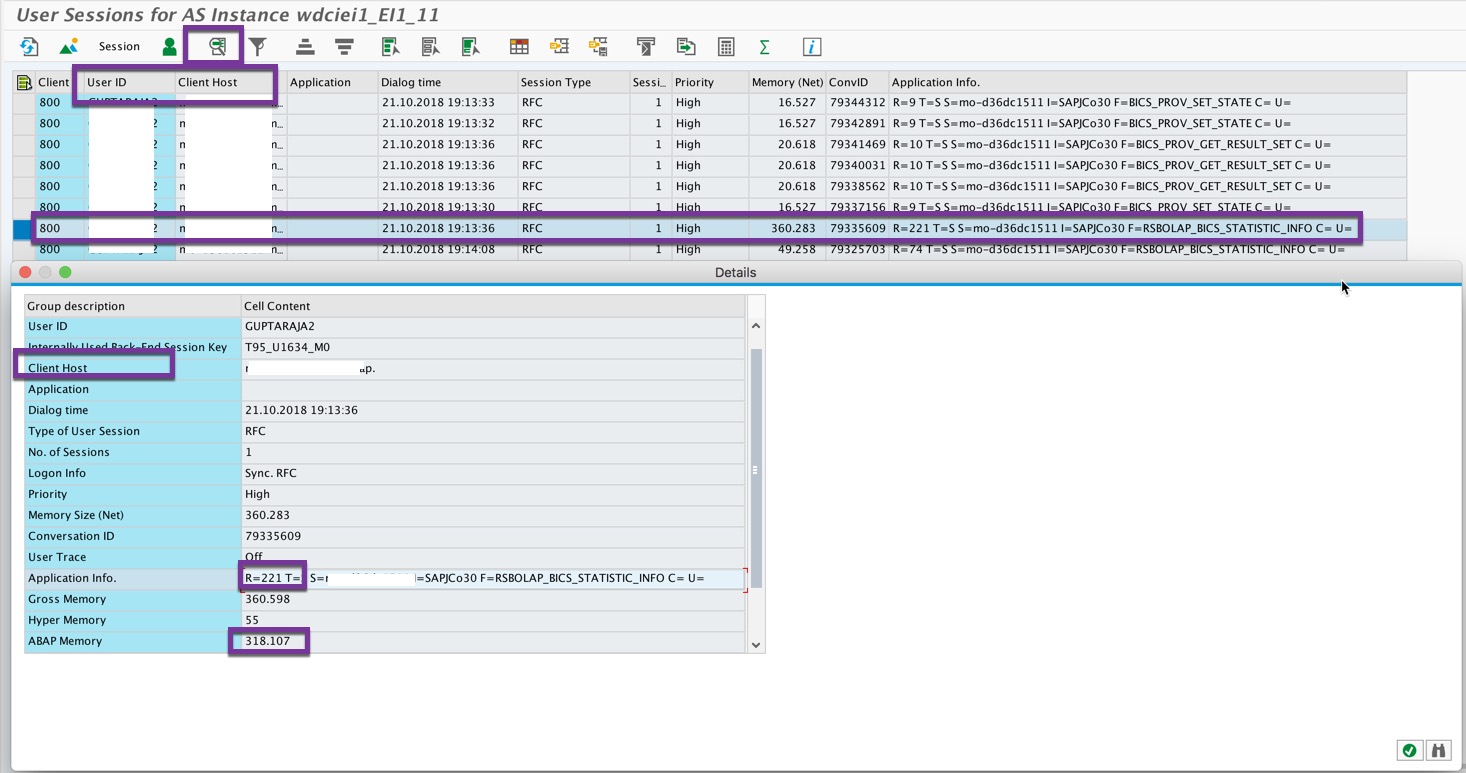
4. Transaction - SM04 ( User list )
This transaction is used for getting all the user list, which has logged into the BW system. This gives memory and response time tracking on the user level.
It also gives an idea about the client machine(i.e. the lumira server), through which the request is triggered . In Cluster setups, this can be used to understand, from which server majority of requests are being triggered to BW.
5. Transaction - ST06 ( operating system monitor)
Which is used to monitor the current and historical tends of SAP server/system utilisation.
Below example shows how CPU utilisation has occurred with and without load. If the CPU utilisation has increase above 70%. Then there might be some slowness in the response time.
6. Transaction - ST02 ( SAP Memory Configuration monitor )
This transaction is used to monitor "SAP Buffers and SAP Memory areas", to understand what percentage of allocated memory(under each memory segment) is being occupied.
These details could be used, to decide if memory block size needs to be increased or not(using the corresponding BW profile parameters).
Column named "SWAPS" gives a clear picture on how the application is using the memory. Ideally this column should be empty. Below snapshot shows the import area's to look for.
7. Transaction - ST03 ( Workload monitoring )
This transaction is used to identify the current and historical trend of hardware utilisation, i.e. it reflects the different components in BW and its contribution to the overall load in the system.
In the below snapshot, it can be observed that the majority of the load in the system is due to Remote Function Calls (RFC) and also shows how the majority of response time is distributed between DB and CPU time.
8. Transaction - ST10 (Table Call Statistics)
This transaction is used to monitor the behaviour of "DB access to specific tables".
Every DB request is categorised under "non-buffered/single record buffered/generic area buffered/fully buffered".
If the Buffer state is categorised as "INVALID", this means that the table is modified and thus has invalidated the table content in buffer. Which implies that the read access takes place directly in the database.
9. Transaction - DB02 (Database performance)
This transaction is used to monitor the Database related performance metrics, which involves understanding the Tablespace size , missing indexes, DB growth rate and many more.
Below snapshot shows the "Space Statistics" , which describes the allocated and the free space.
Thus using these transaction in combination, could help in understanding "How BW is performing for different requests triggered from the the Lumira servers".
Performance tuning of "different BW profile parameters" , in accordance with the way the requests are being triggered from the Lumira side, could help in achieving better responses.
Labels:
2 Comments
You must be a registered user to add a comment. If you've already registered, sign in. Otherwise, register and sign in.
Labels in this area
-
ABAP CDS Views - CDC (Change Data Capture)
2 -
AI
1 -
Analyze Workload Data
1 -
BTP
1 -
Business and IT Integration
2 -
Business application stu
1 -
Business Technology Platform
1 -
Business Trends
1,661 -
Business Trends
85 -
CAP
1 -
cf
1 -
Cloud Foundry
1 -
Confluent
1 -
Customer COE Basics and Fundamentals
1 -
Customer COE Latest and Greatest
3 -
Customer Data Browser app
1 -
Data Analysis Tool
1 -
data migration
1 -
data transfer
1 -
Datasphere
2 -
Event Information
1,400 -
Event Information
64 -
Expert
1 -
Expert Insights
178 -
Expert Insights
269 -
General
1 -
Google cloud
1 -
Google Next'24
1 -
Kafka
1 -
Life at SAP
784 -
Life at SAP
10 -
Migrate your Data App
1 -
MTA
1 -
Network Performance Analysis
1 -
NodeJS
1 -
PDF
1 -
POC
1 -
Product Updates
4,578 -
Product Updates
317 -
Replication Flow
1 -
RisewithSAP
1 -
SAP BTP
1 -
SAP BTP Cloud Foundry
1 -
SAP Cloud ALM
1 -
SAP Cloud Application Programming Model
1 -
SAP Datasphere
2 -
SAP S4HANA Cloud
1 -
SAP S4HANA Migration Cockpit
1 -
Technology Updates
6,886 -
Technology Updates
389 -
Workload Fluctuations
1
Related Content
- Value Unlocked! How customers benefit from SAP HANA Cloud in Technology Blogs by SAP
- SAP Build Code - Speed up your development with Generative AI Assistant - Joule in Technology Blogs by SAP
- Workload Analysis for HANA Platform Series - 3. Identify the Memory Consumption in Technology Blogs by SAP
- Streamline the updates for SAP HANA Cloud with SAP Automation Pilot in Technology Blogs by SAP
- Analytic privilige issue in Embedded SAC in Technology Q&A
Top kudoed authors
| User | Count |
|---|---|
| 12 | |
| 12 | |
| 11 | |
| 9 | |
| 9 | |
| 9 | |
| 8 | |
| 8 | |
| 8 | |
| 8 |