
- SAP Community
- Products and Technology
- Technology
- Technology Blogs by SAP
- What’s New in SAP Analytics Cloud and SAP Digital ...
Technology Blogs by SAP
Learn how to extend and personalize SAP applications. Follow the SAP technology blog for insights into SAP BTP, ABAP, SAP Analytics Cloud, SAP HANA, and more.
Turn on suggestions
Auto-suggest helps you quickly narrow down your search results by suggesting possible matches as you type.
Showing results for
Former Member
Options
- Subscribe to RSS Feed
- Mark as New
- Mark as Read
- Bookmark
- Subscribe
- Printer Friendly Page
- Report Inappropriate Content
10-30-2018
5:14 AM
Please note that we're moving!
Don't worry, it'll still be the same, amazing blog -- just found elsewhere! The What's New blog starting release 2018.21 will have its home in sapanalytics.cloud, so you can find the latest release notes, product plan, and other awesome learning resources all in one place!
This blog covers some of the latest new features and enhancements in SAP Analytics Cloud and SAP Digital Boardroom release 2018.20. Please note that the Analytics Cloud Help documentation is updated at the same time as the upgrade to this release, so the links here may not yet reflect what is described below until after the upgrade is complete.
Upgrade your SAP Analytics Cloud agent to the latest agent version 1.0.205 to take advantage of all the data acquisition types!
If you haven’t upgraded yet, here are the data acquisition minimum requirements:
- Version 1.0.109 for SAP Business Warehouse (BW)
- Version 1.0.99 for SAP ERP / SQL databases
- Version 1.0.91 for SAP Universe (UNX)
- Version 1.0.75 for all other data source types
For more information, see System Requirements and Technical Prerequisites.
Highlights of this release:
- Administration & Infrastructure: Teams and team folders
- Planning: Currency-enabled models
- Planning: Input task and story filter improvements
- Planning: Display the scaling factor in column or row headers
- Planning: Calendar and task improvements
- Planning: Inverse formula enhancements
- Intelligent Enterprise: BW dynamic filters
- Intelligent Enterprise: Data blending with live BW
- Data Integration: Schedule export jobs to SAP S/4HANA
- Data Integration: Modify new models from acquired data
- Data Integration: Calculated column enhancements
- Mobile: Chart hyperlink and filter improvements
- Data Visualizations: Display currency/unit and scale in numeric point charts
- Data Visualizations: Positioning of currency/scale based on corporate standards
- Data Visualizations: Waterfall charts: Two dimensions on the category axis
- Data Visualizations: Waterfall interim totals for import models
- Data Visualizations: More control over starting totals in waterfall charts
Learn with our latest video tutorials
- Create a model from SuccessFactors Workforce Analytics
- Apply filters to a chart in a story
- Apply filters to a geo map in a story
- Full tutorial playlist >
Administration & Infrastructure
Teams and team folders
Teamwork makes the dream work, so it’s no wonder that this new feature was heavily requested. Now, when you create a new team, choose whether a team-specific folder should be created! This feature works especially well for those who use teams to group users for security purposes and/or organize their analytic content in Public folders. With various teams needing access to various folders of content, this will help you stay organized.
Please note that if you don’t create the team folder, you won’t be able to add it later unless you delete and recreate the team.

Planning
Currency-enabled models
Since planning operations that affect multiple currencies are now enabled, we want to make sure you’re alerted when they happen! We send you these messages during these operations because they may have unexpected results when currency conversion is not applied.
You’ll see warnings like this for Copy & Paste, Data Entry, Spreading, Distribute, Assign, Data Actions, and Allocation Processes, but the action will still be successfully performed.

Input task and story filter improvements
Simplify what’s available to your eyes! For input tasks, story filters applied to a distribution dimension will affect the number and types of members shown on the Summary page. There are also performance improvements for displaying and managing the distribution dimension.

Display the scaling factor in column or row headers
In tables, you can now display the scaling factor in the column or row header instead of in every cell.

Calendar and task improvements
Clean up the clutter on your calendar! For calendar tasks and processes, you are now able to hide or display the full name of a task in the taskbar.

Inverse formula enhancements
Inverse formulas for accounts that use exception aggregation with dimensions now support data entry when these dimensions are filtered to a single leaf member.

Intelligent Enterprise
BW dynamic filter support
We now support SAP BW dynamic filters in charts and in tables! Meaning that when filter values are used for the initial view of the result set, you can choose to modify these filters in the result.
To avoid unwanted user changes, a variable submitted based on a dynamic filter doesn’t overwrite manually filtered widgets.
Please note that this feature is unique to BW.

Data blending with live BW
You are now able to blend live BW data models with imported data models!
Please note the supported SAP BW deployments:
- SAP BW on HANA (requires SAP BW 7.5 or higher)
- SAP BW/4HANA
The SAP HANA system your SAP BW deployment is running on must have a full use license. SAP HANA systems using a Runtime Edition (REAB) license will be supported in the near future, so stay tuned!
Please note that this is only supported for blending live SAP BW data models with imported data models.

Data Integration
Schedule export jobs to SAP S/4HANA
Exporting your data just got easier now that you can define reoccurring jobs for exporting transactional data to SAP S/4HANA. The feature can be accessed in the data source panel of the Modeler. This full integration includes a history of your exports, a new “export data” section as well as the ability to view which rows have been rejected during the export.

Modify new models from imported data
Need to make a change to your model after it’s been created? Don’t fret! For models based on imported data, you’re now able to go back to the original wrangling session and rebuild models from that step. This allows you to fix any issues during the model creation phase, though changes on productive models should be managed differently.
Also, you’ll be alerted twice on the impact of the change. Upon these alerts, you may have to adjust dependent stories if entities of a model were removed. As well, all data in the model will revert to the data coming from the original query. Scheduled jobs or manually imported data will need to be reloaded.
Please note that you won’t be able to rebuild a model that has currency conversion, Global Dimensions, or Private versions. Nor can you modify a model that’s being used by a value driver tree or allocations.
For the moment, this capability is only for new models and only the owner of the model can perform the change. Keep your eyes peeled for upcoming improvements to this area!

Calculated column enhancements
In data wrangling, there is now a formula editor to create calculations on columns. The formula will create a new column and results will be persisted in the model. Formulas can be edited at any time and the UI is the same one used in stories and the Modeler.
The resulting column refers to the original values in the dependent columns. Changes of the original values are cascaded and you’re still able to delete dependent columns.

Mobile
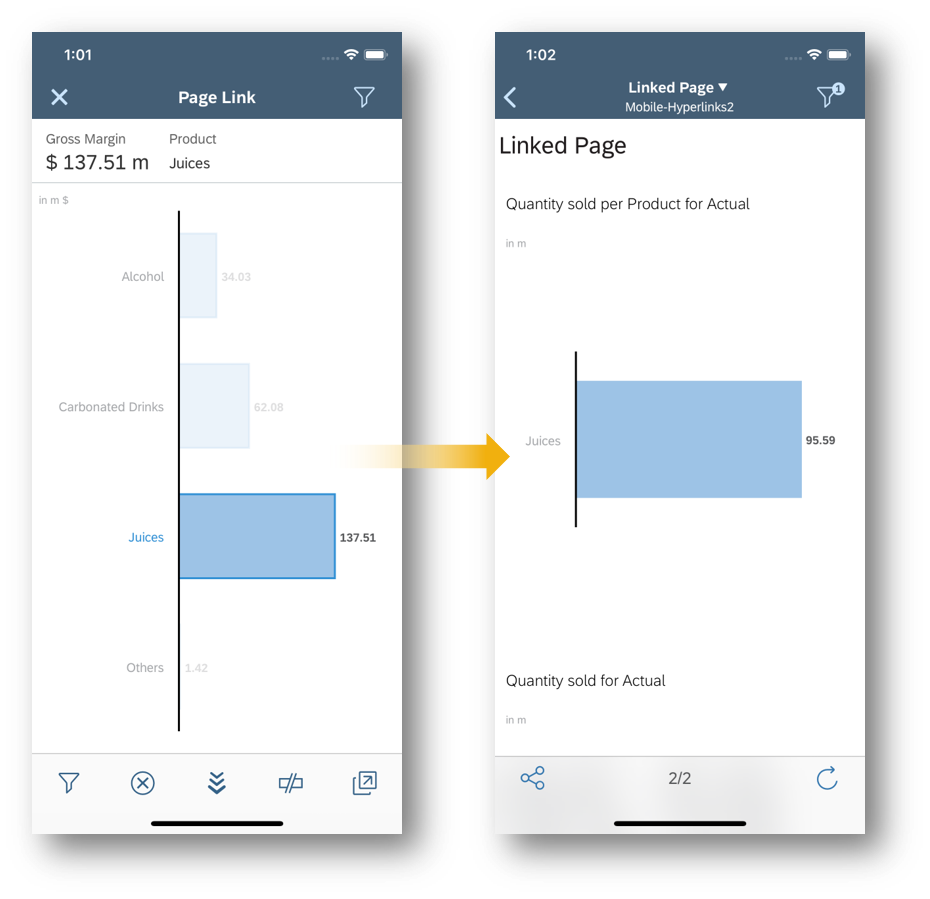
Chart hyperlink and filter improvements
Tap tap! That’s what you’ll be hearing once you get your hands on this new mobile-focused feature. The SAP Analytics Cloud app now supports chart hyperlinks that act as dimension filters, so you’ll see a cascading effect to other filters on the destination page. This allows you to link story pages, other stories, and external URLs.
Data Visualizations
Display currency/unit and scale in Numeric Point charts
We know how important it is to follow corporate standards! Story Designers now have the option to show the currency/unit and scale alongside the data in Numeric Point charts rather than just in the subtitle.

Positioning of currency/scale based on corporate standards
There are many dividing questions in the world: pancakes or waffles? Chocolate or candy? Currency symbols on the left or right?
With this update, you can now select how you want to position your currency (i.e. 30€ vs. €30) in charts, tables and tooltips. Your subscription configuration offers additional options to display currency as symbols or ISO Codes. Keep in mind that your personal Profile Settings can override your organization’s subscription configuration.
Please note that:
- The support of this feature with live BW requires an implementation of SAP Note 2700031
- This feature does not yet support live HANA

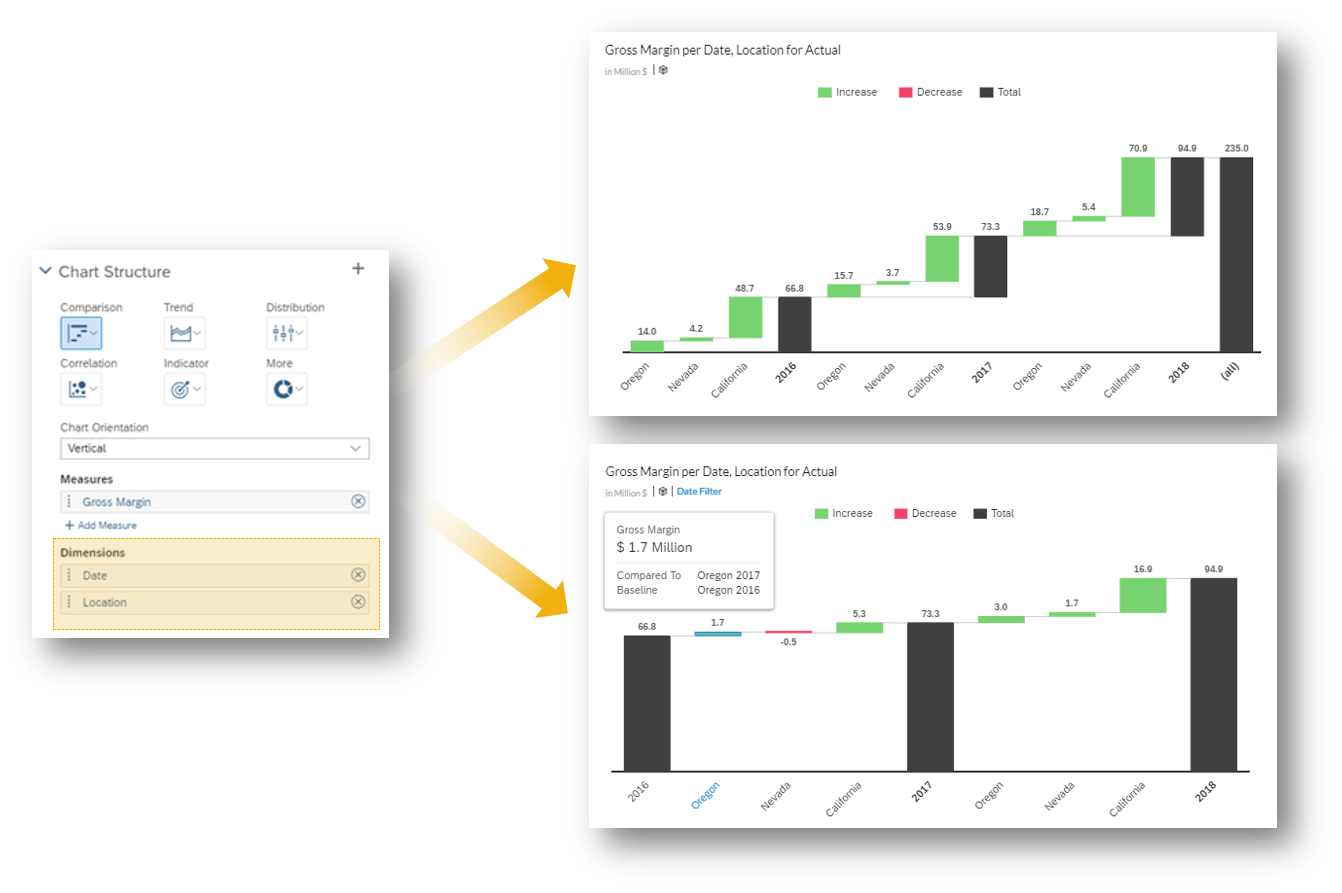
Waterfall charts: Two dimensions on the category axis
Story designers can now include two dimensions in the dimension axis for waterfall charts.
The primary dimensions, also referred to the first or inner dimensions, acts as interim total, and allows you to drill up/down for both Primary and Breakdown dimensions.
The breakdown dimensions, also known as the second or outer dimensions, break the chart down into further details. You can only drill up/down on breakdown dimensions. For example, drilling down on “water” will only break it down to sub-categories of water products.
If the primary dimensions don’t have a root node, then the breakdown dimensions will show the delta between the primary dimension members.
Please note that this is not yet supported for live BW.
Waterfall interim totals for import models
No need to be jealous of live HANA’s abilities to select interim totals because now you can do it with imported models too!

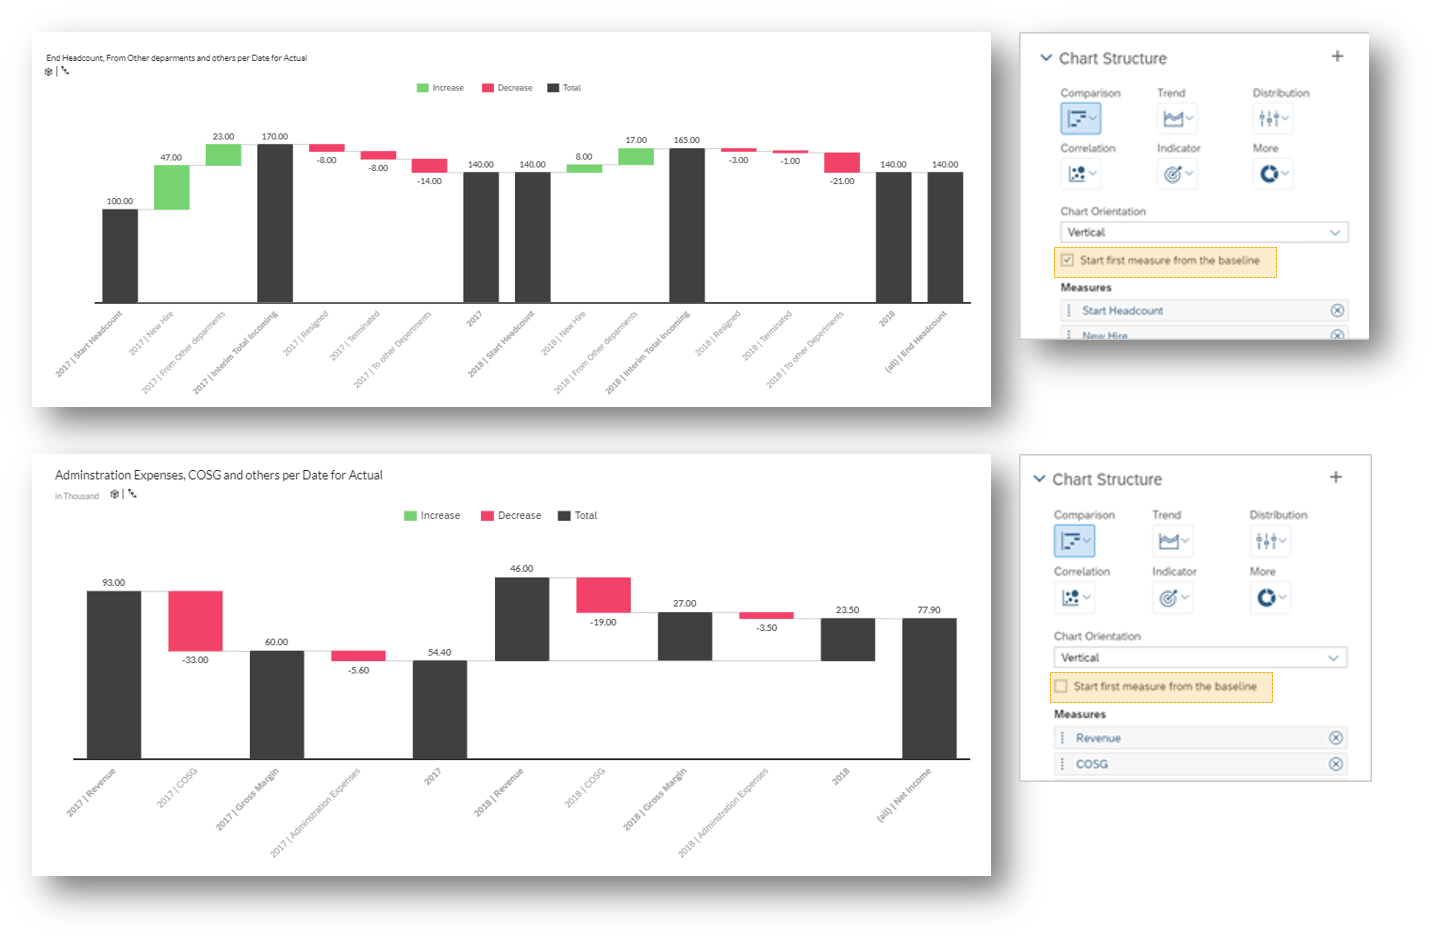
More control over starting totals in waterfall charts
Have a specific chart orientation in mind? When using the dimension axis and multiple measures, you can choose whether you want your first measure to start from the baseline or have it aggregated on top of the last total.
For example, you can start the measure from the baseline for non-cumulative measures such as Headcount and Inventory.
Additional resources:
- Video tutorials
- Guided learning
- Events and recordings
- SAP Analytics Cloud help resources
- Official roadmap contains more info on future plans, subject to change.
Previous feature summary blogs:
- SAP Analytics Cloud release 2018.19
- SAP Analytics Cloud release 2018.18
- SAP Analytics Cloud release 2018.17
- SAP Analytics Cloud release 2018.16
- SAP Analytics Cloud release 2018.15
- SAP Analytics Cloud release 2018.14
- SAP Analytics Cloud release 2018.13
- SAP Analytics Cloud release 2018.12
- SAP Analytics Cloud release 2018.11
- SAP Analytics Cloud release 2018.10
- SAP Analytics Cloud release 2018.09
- SAP Analytics Cloud release 2018.08
- SAP Analytics Cloud release 2018.07
- SAP Analytics Cloud release 2018.06
- SAP Analytics Cloud release 2018.05
- SAP Analytics Cloud release 2018.04
- SAP Analytics Cloud release 2018.03
- SAP Analytics Cloud release 2018.02
- SAP Analytics Cloud release 2018.01
- More >
**Legal disclaimer
SAP has no obligation to pursue any course of business outlined in this blog or any related presentation, or to develop or release any functionality mentioned therein. This blog, or any related presentation and SAP’s possible future developments, products and or platforms directions and functionality are all subject to change and may be changed by SAP at any time for any reason without notice. The information in this blog is not a commitment, promise or legal obligation to deliver any material, code, or functionality. This blog is provided without a warranty of any kind, either express or implied, including but not limited to, the implied warranties of merchantability, fitness for a particular purpose, or non-infringement. This blog is for informational purposes and may not be incorporated into a contract. SAP assumes no responsibility for errors or omissions in this document, except if such damages were caused by SAP’s willful misconduct or gross negligence.
All forward-looking statements are subject to various risks and uncertainties that could cause actual results to differ materially from expectations. Readers are cautioned not to place undue reliance on these forward-looking statements, and should not be relied upon in making purchasing decisions.
- SAP Managed Tags:
- SAP Analytics Cloud
Labels:
3 Comments
You must be a registered user to add a comment. If you've already registered, sign in. Otherwise, register and sign in.
Labels in this area
-
ABAP CDS Views - CDC (Change Data Capture)
2 -
AI
1 -
Analyze Workload Data
1 -
BTP
1 -
Business and IT Integration
2 -
Business application stu
1 -
Business Technology Platform
1 -
Business Trends
1,661 -
Business Trends
87 -
CAP
1 -
cf
1 -
Cloud Foundry
1 -
Confluent
1 -
Customer COE Basics and Fundamentals
1 -
Customer COE Latest and Greatest
3 -
Customer Data Browser app
1 -
Data Analysis Tool
1 -
data migration
1 -
data transfer
1 -
Datasphere
2 -
Event Information
1,400 -
Event Information
64 -
Expert
1 -
Expert Insights
178 -
Expert Insights
273 -
General
1 -
Google cloud
1 -
Google Next'24
1 -
Kafka
1 -
Life at SAP
784 -
Life at SAP
11 -
Migrate your Data App
1 -
MTA
1 -
Network Performance Analysis
1 -
NodeJS
1 -
PDF
1 -
POC
1 -
Product Updates
4,577 -
Product Updates
324 -
Replication Flow
1 -
RisewithSAP
1 -
SAP BTP
1 -
SAP BTP Cloud Foundry
1 -
SAP Cloud ALM
1 -
SAP Cloud Application Programming Model
1 -
SAP Datasphere
2 -
SAP S4HANA Cloud
1 -
SAP S4HANA Migration Cockpit
1 -
Technology Updates
6,886 -
Technology Updates
401 -
Workload Fluctuations
1
Related Content
- Top Picks: Innovations Highlights from SAP Business Technology Platform (Q1/2024) in Technology Blogs by SAP
- What’s New in SAP Analytics Cloud Release 2024.08 in Technology Blogs by SAP
- Sneak Peek in to SAP Analytics Cloud release for Q2 2024 in Technology Blogs by SAP
- Deep dive into Q4 2023, What’s New in SAP Cloud ALM for Implementation Blog Series in Technology Blogs by SAP
- SAP Sustainability Footprint Management: Q1-24 Updates & Highlights in Technology Blogs by SAP
Top kudoed authors
| User | Count |
|---|---|
| 12 | |
| 9 | |
| 7 | |
| 7 | |
| 7 | |
| 7 | |
| 6 | |
| 6 | |
| 6 | |
| 4 |