
- SAP Community
- Products and Technology
- Technology
- Technology Blogs by SAP
- Forecast in SAP EarlyWatch Alert Workspace: How to...
Technology Blogs by SAP
Learn how to extend and personalize SAP applications. Follow the SAP technology blog for insights into SAP BTP, ABAP, SAP Analytics Cloud, SAP HANA, and more.
Turn on suggestions
Auto-suggest helps you quickly narrow down your search results by suggesting possible matches as you type.
Showing results for
Advisor
Options
- Subscribe to RSS Feed
- Mark as New
- Mark as Read
- Bookmark
- Subscribe
- Printer Friendly Page
- Report Inappropriate Content
10-29-2018
10:09 AM
SAP HANA Database is an impressive piece of software but it has also limitation where a table and partition cannot contain more than 2 billion records in the column store (more precisely 2.147.483.648 – 2 to the power of 31) – see also SAP Note 2044468 - FAQ: SAP HANA Partitioning.
Tables with a risk to reach the 2 billion record limit should be taken care of. To identify risky candidates and visualize the table/partition growth in a HANA DB we introduced the 2 Billion Record Limit in the SAP EarlyWatch Alert Workspace. The app monitors and forecasts the number of entries in SAP HANA tables.

Use this app to get an overview which tables are approaching the limit including a prediction when the limit is reached, broken down into a mean, best-case and worst-case scenario. By default, the forecast is based on all previous measurements. You can, however, restrict the measurements used for the forecast.
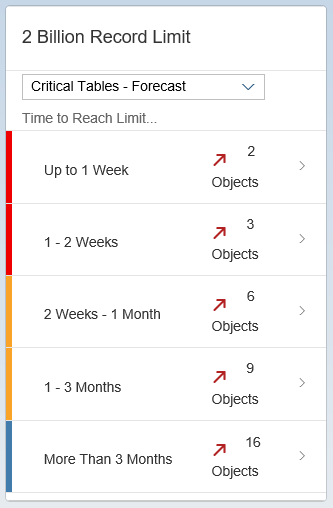
To start the app, click on the title area of the corresponding card, or one of the time limits displayed. These serve as a filter, just like the dropdown list box Time Range in the app itself: so only tables reaching the record limit in a certain time range according to the worst-case scenario are listed. It is obviously unknown when precisely this limit is reached in the future. Of the various possibilities, the worst-case scenario is an unfavorable, yet possible forecast - with a probability of 80% the limit is reached later.
After calling the app the critical tables of the managed SAP HANA databases are listed. These are the non-partitioned tables and partitions, which will probably reach the 2-billion-record-limit in the next 30 weeks. The historical data used for this prediction is based on the top 40 tables and top 40 partitions by number of entries.
By default, these tables are sorted by the date the limit will be reached in the worst-case scenario. Like in the other cross-system apps of the SAP EarlyWatch Alert service, you can use the global filter to restrict the data displayed to specific customers or systems.
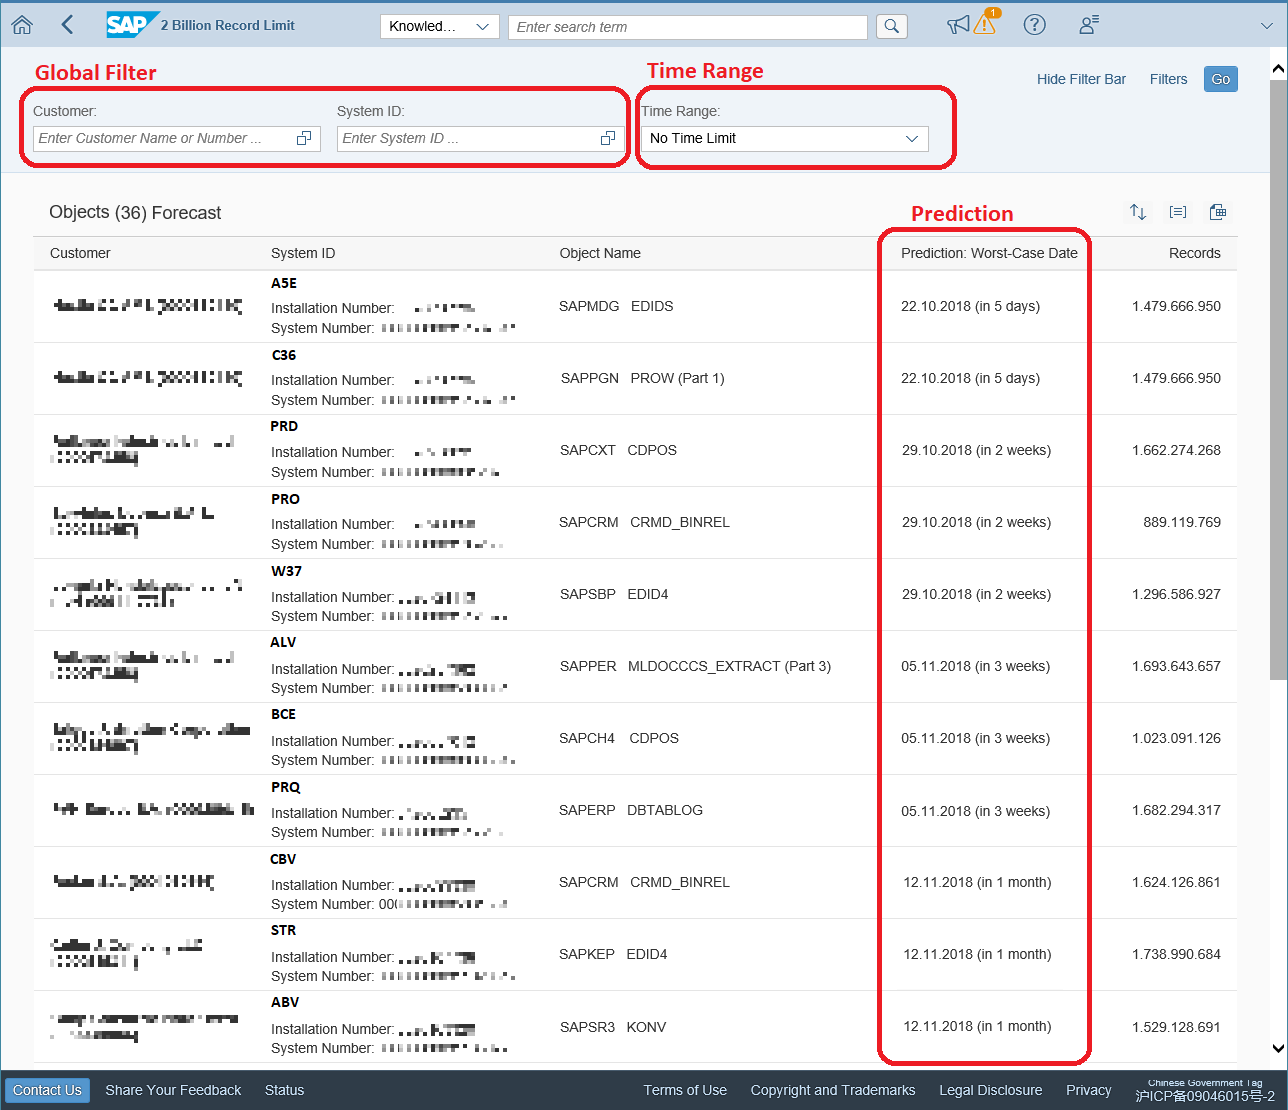
Choose an entry from the list to know more about the record forecast of the corresponding table. The measurement points of the record numbers in their temporal evolution are displayed. For the possible future trend, you can see three different dashed curves:

By default, all measurement points for the number of table records available in SAP EarlyWatch Alert are used for the forecast. If, however, some of the data points would disturb the calculation, e.g. because the boundary conditions during measurement time have changed, you can restrict the points used for the forecast. To do so, select the points in the diagram you want to use for the recalculation.
In the example above, the increase is largely uniform - except for the first measurement. Probably this was a unique effect, so I select only the subsequent measurements and choose Recalculation:

After the recalculation, these points are shown in orange - and you can see that the forecast is much more accurate:

When you choose this table the next time, all measurement points are used for the forecast again. To save the selection permanently, choose the icon Save Data Points.
Keep in mind that the forecast is based on the existing measurements only. Deviations from the forecast, e.g. by unforeseen events, are always possible. Therefore, reaching the technical limit may occur earlier in reality than predicted in the worst-case-scenario. So never rely on the prediction only, but remedy the situation as soon as possible.
In this context you are invited to have a look at the guided tour Monitoring Records Limit. Guided tours provide step-by-step contextual guidance to help you complete your process tasks. This guided tour in the 2 Billion Record Limit is the second one available in the workspace – others will follow (you can find the other guided tour in the SAP EarlyWatch Alert Solution Finder). In this guided tour you will identify and improve the forecast when the number of records in a table becomes critical, and respond to it.
To start the guided tour, activate the in-app help, choose Guided Tours and Monitoring Records Limit in the carousel.

The investment in this app paid off nicely. Over time we evaluated how the app has been used and even supported the most critical cases with an email based notification to SAP's technical key accounts to inform the customer teams additionally. Out of our observation in 2021 (until June 2021) we have seen more than 2000 cases becoming critical in the next 2 weeks. Many customers were additionally informed (more than 700 notifications have been sent out) and we have realized that more than 80% of the cases could be solved - the data growth in the table/partition was stopped or reduced. In each single solved case we saved the operations team sleepless nights with trouble shooting such an issue.
But with the new notification feature in the SAP EarlyWatch Alert Workspace (see Stay Informed About New SAP EarlyWatch Alerts You Are Interested In it is even more convenient to be notified automatically. With a couple of clicks you can configure an email notification in case a table grows faster than expected.
Tables with a risk to reach the 2 billion record limit should be taken care of. To identify risky candidates and visualize the table/partition growth in a HANA DB we introduced the 2 Billion Record Limit in the SAP EarlyWatch Alert Workspace. The app monitors and forecasts the number of entries in SAP HANA tables.
Use this app to get an overview which tables are approaching the limit including a prediction when the limit is reached, broken down into a mean, best-case and worst-case scenario. By default, the forecast is based on all previous measurements. You can, however, restrict the measurements used for the forecast.
To start the app, click on the title area of the corresponding card, or one of the time limits displayed. These serve as a filter, just like the dropdown list box Time Range in the app itself: so only tables reaching the record limit in a certain time range according to the worst-case scenario are listed. It is obviously unknown when precisely this limit is reached in the future. Of the various possibilities, the worst-case scenario is an unfavorable, yet possible forecast - with a probability of 80% the limit is reached later.
After calling the app the critical tables of the managed SAP HANA databases are listed. These are the non-partitioned tables and partitions, which will probably reach the 2-billion-record-limit in the next 30 weeks. The historical data used for this prediction is based on the top 40 tables and top 40 partitions by number of entries.
By default, these tables are sorted by the date the limit will be reached in the worst-case scenario. Like in the other cross-system apps of the SAP EarlyWatch Alert service, you can use the global filter to restrict the data displayed to specific customers or systems.
Choose an entry from the list to know more about the record forecast of the corresponding table. The measurement points of the record numbers in their temporal evolution are displayed. For the possible future trend, you can see three different dashed curves:
- Forecast Low 80%: The actual measurements will be above this curve with a probability of 80%.
- Forecast Mean: Based on the considered measurements, this curve represents the most probable future trend.
- Forecast High 80%: The actual measurements will be below this curve with a probability of 80%. This curve represents the Prediction: Worst-Case Date in the list.
By default, all measurement points for the number of table records available in SAP EarlyWatch Alert are used for the forecast. If, however, some of the data points would disturb the calculation, e.g. because the boundary conditions during measurement time have changed, you can restrict the points used for the forecast. To do so, select the points in the diagram you want to use for the recalculation.
In the example above, the increase is largely uniform - except for the first measurement. Probably this was a unique effect, so I select only the subsequent measurements and choose Recalculation:
After the recalculation, these points are shown in orange - and you can see that the forecast is much more accurate:
When you choose this table the next time, all measurement points are used for the forecast again. To save the selection permanently, choose the icon Save Data Points.
Keep in mind that the forecast is based on the existing measurements only. Deviations from the forecast, e.g. by unforeseen events, are always possible. Therefore, reaching the technical limit may occur earlier in reality than predicted in the worst-case-scenario. So never rely on the prediction only, but remedy the situation as soon as possible.
In this context you are invited to have a look at the guided tour Monitoring Records Limit. Guided tours provide step-by-step contextual guidance to help you complete your process tasks. This guided tour in the 2 Billion Record Limit is the second one available in the workspace – others will follow (you can find the other guided tour in the SAP EarlyWatch Alert Solution Finder). In this guided tour you will identify and improve the forecast when the number of records in a table becomes critical, and respond to it.
To start the guided tour, activate the in-app help, choose Guided Tours and Monitoring Records Limit in the carousel.
The investment in this app paid off nicely. Over time we evaluated how the app has been used and even supported the most critical cases with an email based notification to SAP's technical key accounts to inform the customer teams additionally. Out of our observation in 2021 (until June 2021) we have seen more than 2000 cases becoming critical in the next 2 weeks. Many customers were additionally informed (more than 700 notifications have been sent out) and we have realized that more than 80% of the cases could be solved - the data growth in the table/partition was stopped or reduced. In each single solved case we saved the operations team sleepless nights with trouble shooting such an issue.
But with the new notification feature in the SAP EarlyWatch Alert Workspace (see Stay Informed About New SAP EarlyWatch Alerts You Are Interested In it is even more convenient to be notified automatically. With a couple of clicks you can configure an email notification in case a table grows faster than expected.
- SAP Managed Tags:
- Support Services,
- SAP HANA,
- Cloud,
- SAP EarlyWatch Alert
Labels:
1 Comment
You must be a registered user to add a comment. If you've already registered, sign in. Otherwise, register and sign in.
Labels in this area
-
ABAP CDS Views - CDC (Change Data Capture)
2 -
AI
1 -
Analyze Workload Data
1 -
BTP
1 -
Business and IT Integration
2 -
Business application stu
1 -
Business Technology Platform
1 -
Business Trends
1,661 -
Business Trends
88 -
CAP
1 -
cf
1 -
Cloud Foundry
1 -
Confluent
1 -
Customer COE Basics and Fundamentals
1 -
Customer COE Latest and Greatest
3 -
Customer Data Browser app
1 -
Data Analysis Tool
1 -
data migration
1 -
data transfer
1 -
Datasphere
2 -
Event Information
1,400 -
Event Information
65 -
Expert
1 -
Expert Insights
178 -
Expert Insights
280 -
General
1 -
Google cloud
1 -
Google Next'24
1 -
Kafka
1 -
Life at SAP
784 -
Life at SAP
11 -
Migrate your Data App
1 -
MTA
1 -
Network Performance Analysis
1 -
NodeJS
1 -
PDF
1 -
POC
1 -
Product Updates
4,577 -
Product Updates
330 -
Replication Flow
1 -
RisewithSAP
1 -
SAP BTP
1 -
SAP BTP Cloud Foundry
1 -
SAP Cloud ALM
1 -
SAP Cloud Application Programming Model
1 -
SAP Datasphere
2 -
SAP S4HANA Cloud
1 -
SAP S4HANA Migration Cockpit
1 -
Technology Updates
6,886 -
Technology Updates
408 -
Workload Fluctuations
1
Related Content
- Supercharge Your SAP HANA Cloud Experience with SAP EarlyWatch Alert in Technology Blogs by SAP
- SAP Signavio Value Accelerators in Action: Reimagine the Way You Transform with Ready to Use Content and Best Practices in Technology Blogs by SAP
- Hide & Snooze SAP EarlyWatch Alerts in Technology Blogs by SAP
- Choose your SAP EarlyWatch Alerts in Technology Blogs by SAP
- [SAP BTP Onboarding Series] - Step-by-Step guide to activate your SAP Build Work Zone, Advanced Edition in Technology Blogs by SAP
Top kudoed authors
| User | Count |
|---|---|
| 13 | |
| 11 | |
| 10 | |
| 9 | |
| 9 | |
| 7 | |
| 6 | |
| 5 | |
| 5 | |
| 5 |