- SAP Community
- Products and Technology
- Technology
- Technology Blogs by SAP
- How to create and use data quality rules with SAP ...
Technology Blogs by SAP
Learn how to extend and personalize SAP applications. Follow the SAP technology blog for insights into SAP BTP, ABAP, SAP Analytics Cloud, SAP HANA, and more.
Turn on suggestions
Auto-suggest helps you quickly narrow down your search results by suggesting possible matches as you type.
Showing results for
Product and Topic Expert
Options
- Subscribe to RSS Feed
- Mark as New
- Mark as Read
- Bookmark
- Subscribe
- Printer Friendly Page
- Report Inappropriate Content
10-24-2018
10:41 AM
After part 1 and part 2 of this blog series your system has some results of data quality evaluations stored. You already had a look at those by starting with the rule that you have created. In reality there are of course many more rules and much more data that was evaluated. This part shows you how to analyze this evaluation result and take action on it.
Click on Follow at the top of this page to get informed when the next part is posted.
Part 3 - Analyzing the evaluation results
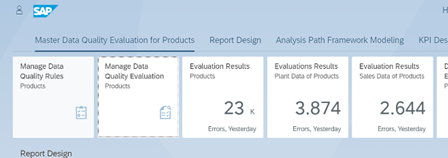
- You have already seen that you can see the evaluation result for each rule in the Manage Data Quality Rules app. However, the usual way to access the evaluation result is to use one of the Evaluation Results apps.

The app Evaluation Results - Products presents the results on product level.
The other apps Evaluation Results - Plant Data of Products and Evaluation Results - Sales Data of Products present the results on the respective level of plant or sales organization.Launch the app Evaluation Results – Products. - The app implements the Analytical List Page floorplan (ALP).
see https://experience.sap.com/fiori-design-web/analytical-list-page/
The page consists of 3 parts:
Header with the filter bar (here: displaying 3 visual filters)
Smart chart (here: with the title Evaluation Items)
Table (here: with the title Evaluation Items (19.788) )

- Whatever you define in the filter bar will influence the data displayed in the chart and in the table.

You can also switch to compact filters with the button:

- You can add more filters with the Adapt Filters
 button.

- The smart chart allows you to define your own chart type, choose dimensions from the product master data and drill-down to see the result by values of almost any field of the product basic data section.

- The table allows you to add almost any field of the product basic data section as a column.

This and further functions are available in the settings dialog:

Hint: double-click the separator between two columns to optimize the column width for the content.

- You can click on a product number to display a quick view of the product. You can add further navigation targets by choosing More Links.

- For example, to be able to create a change request for a product in order to fix the data quality issue, select the link Change Material - Governance.

- You can then use this link to directly create a change request.

- You can also select one or more products and click on Process Products to create a mass change process.

Follow this blog
Click on Follow at the top of this page to get informed when the next part is posted.
- SAP Managed Tags:
- SAP Master Data Governance,
- SAP S/4HANA
Labels:
6 Comments
You must be a registered user to add a comment. If you've already registered, sign in. Otherwise, register and sign in.
Labels in this area
-
ABAP CDS Views - CDC (Change Data Capture)
2 -
AI
1 -
Analyze Workload Data
1 -
BTP
1 -
Business and IT Integration
2 -
Business application stu
1 -
Business Technology Platform
1 -
Business Trends
1,658 -
Business Trends
91 -
CAP
1 -
cf
1 -
Cloud Foundry
1 -
Confluent
1 -
Customer COE Basics and Fundamentals
1 -
Customer COE Latest and Greatest
3 -
Customer Data Browser app
1 -
Data Analysis Tool
1 -
data migration
1 -
data transfer
1 -
Datasphere
2 -
Event Information
1,400 -
Event Information
66 -
Expert
1 -
Expert Insights
177 -
Expert Insights
294 -
General
1 -
Google cloud
1 -
Google Next'24
1 -
Kafka
1 -
Life at SAP
780 -
Life at SAP
13 -
Migrate your Data App
1 -
MTA
1 -
Network Performance Analysis
1 -
NodeJS
1 -
PDF
1 -
POC
1 -
Product Updates
4,577 -
Product Updates
341 -
Replication Flow
1 -
RisewithSAP
1 -
SAP BTP
1 -
SAP BTP Cloud Foundry
1 -
SAP Cloud ALM
1 -
SAP Cloud Application Programming Model
1 -
SAP Datasphere
2 -
SAP S4HANA Cloud
1 -
SAP S4HANA Migration Cockpit
1 -
Technology Updates
6,873 -
Technology Updates
420 -
Workload Fluctuations
1
Related Content
- Hack2Build on Business AI – Highlighted Use Cases in Technology Blogs by SAP
- Empowering Retail Business with a Seamless Data Migration to SAP S/4HANA in Technology Blogs by Members
- 10+ ways to reshape your SAP landscape with SAP Business Technology Platform - Blog 7 in Technology Blogs by SAP
- 10+ ways to reshape your SAP landscape with SAP BTP - Blog 4 Interview in Technology Blogs by SAP
- 10+ ways to reshape your SAP landscape with SAP Business Technology Platform – Blog 4 in Technology Blogs by SAP
Top kudoed authors
| User | Count |
|---|---|
| 35 | |
| 25 | |
| 14 | |
| 7 | |
| 7 | |
| 6 | |
| 6 | |
| 5 | |
| 4 | |
| 4 |