
- SAP Community
- Products and Technology
- Additional Blogs by SAP
- #EUREKA – Create Data Empathy Not Melancholy
Additional Blogs by SAP
Turn on suggestions
Auto-suggest helps you quickly narrow down your search results by suggesting possible matches as you type.
Showing results for
panagiotis_germ
Discoverer
Options
- Subscribe to RSS Feed
- Mark as New
- Mark as Read
- Bookmark
- Subscribe
- Printer Friendly Page
- Report Inappropriate Content
10-09-2018
3:20 PM

Authors: Panagiotis Germanakos and Ludwig Fichte
As an appetizer, check-out our cool video for a visual story. Enjoy!
You are back from long usability testing sessions. You managed to visit 2 customers and validate your native application with 9 end-users. It went well, and your booklets are full of notes. However, there is always the lingering question: what to do next? How should you analyze the data and get the best out of it?
This could be a typical experience of a product team during the usability evaluation of a solution, which initially takes place during the design phase of the design-led development process (see a related article by Carolin Flesch “Good Things Come in 3s – Intro to the DLD Process”). Attempting to evaluate a product’s usability entails a number of activities, extending from preparatory ones like the composition of usability scripts and scheduling of on-site (or remote) customer visits, to the actual execution that includes observation, measurement, and identification of the end-users’ behavior while interacting with the user interface, visual designs, and functionalities of the product. All these activities generate qualitative and quantitative data (captured either explicitly or implicitly) that need to be analyzed and interpreted in a collaborative manner. The main aim of the analysis is to understand the interaction challenges, cumbersome scenarios, needs or wishes that would improve the usability and user experience of the solution.
However, collecting, analyzing, sorting, and making sense of the collected information is a time-consuming task that requires a lot of effort. The data is often unstructured, incomplete, inaccurate, and gathered in various formats, creating an overwhelming situation for a team. Data sets that contain qualitative information present an inherent uncertainty and fuzziness. The possibility of drawing different understandings, explanations, or interpretations is high, since such qualitative data sets cannot be easily reduced to numbers and usually express opinions, experiences, feelings, and values. Often, it is not clear what to consider and how to start a data analysis, turning the preliminary excitement of the teams into melancholy about not knowing how to proceed.
For me, Ludwig, in dozens of studies and having tested with hundreds of users, I kept getting the same questions over and over again: Do you have some template we can use to analyse our data more thoroughly? How can we save time? How do we avoid losing too much data? How can we prioritize our findings? How can we compare our findings with prior or future studies? As user researcher, over the years I tried it all, going quick-and-dirty by just focusing on a handful of main insights, using post-it notes on print-out posters of the screens tested, and creating plenty of spreadsheets, trying to manually summarize findings. After all, the trade-off was obvious, I could either save time, risking losing important outcomes – or be thorough, risking my team not having enough time to wait for the results. Both ways didn’t seem acceptable to me. My Web research wasn’t successful, talking to other UX professionals from agencies to big corporations also wasn’t successful either. It just seems like everyone is rather manually and only semi-structurally analyzing their usability test studies although the demand for a more guided approach definitely was there.
As for me, Panagiotis, the situation was quite similar. It is a challenge that has been spinning in my head forever, but it has become clearer in the last 5 years. The advent of the technology has facilitated the collection of various types of data during usability studies, but, for me, there was always a gap in place, not being able to uncover the detail of the information that these data seeds hide in an acceptable time-frame that is useful for all: for the product teams to prioritize their decisions and backlog items, the UX designers to accurately develop interactions and visual designs, or management for more structured documentation and reporting. But, most importantly, it is unfair for all the efforts that product teams invest in the preparation and data collection, not have a way to reveal the corresponding outcome that the data dictates – to acquire a result that they deserve. During the years, I have tried many methods and created ad-hoc processes and spreadsheets and documents complying with the various project situations and data analysis requirements but there was always something missing. Something, that could not find in secondary market research or in discussions with UX professionals – colleagues internally or externally. We were exchanging useful insights and unique experiences, but every conversation was ending with one wish and a clear demand: a more guided approach to qualitative data analysis.
So, Ludwig and I decided to tackle the problem head on and to combine our forces to study, on the one hand, a methodological perspective to usability tests data analysis, and, on the other hand, a tool that could provide the features and functionalities to realize this method, in various situations, scenarios, and projects. In this respect, our number one priority was expressed through the phrase we coined, and it drove this endeavor from day one, to create: data empathy. We needed to come up with an approach that would allow teams to create data empathy and would guide them through the analysis of empirical information that they collect from their usability studies.

Fig. 1. EUREKA workshops
Many moons, meetings, and workshops later (see Fig. 1), eureka! We believe we came a step closer to a viable solution with EUREKA (Engineering Usability Research Empirical Knowledge and Artifacts). At this point, we would like to acknowledge our colleagues, UX Designers, Daphne Schimetschek and Timo Bess, for their contributions: their advice on visuals and the creation of the designs and promotional video of our solution. EUREKA is a methodology and tool that facilitates a structured yet flexible iterative process to qualitative data analysis. The theoretical building blocks of the EUREKA methodology (a.k.a., Discover, Learn, Act, and Monitor) and our quest to data empathy could be summarized in the following fundamental viewpoints:
Allow data to talk to you
Preparing data clusters that contain the same or similar feedback items (i.e., end-users’ comments) is a usual tactic during the initial exploration phase of data analysis. EUREKA brings the clusters discovered by the teams in the center of analysis, through a process of gradual refinement, from the abstract to the concrete, trying to maintain their originality. The secret here is to stay intact from external influences and constraints, and to avoid exercising any insufficient practices or biased interpretations. The main aim is to semantically reform, through the various iterations, an abstract feedback item or comment to convey a clear meaning and well-defined intent regarding an event or fact. In other words, to produce actionable information for immediate consumption by the team to the benefit of a product.
Maintain a balanced qualitative and quantitative perspective of a single piece of truth
Quantification of empirical data is always a big challenge in usability research data analysis due to the vague and subjective views they present. A highly beneficial approach for the interpretation of one piece of data would be to adopt a balanced approach that could, on the one hand, support feedback items with a calculated figure (e.g., frequency of references, percentage of importance, impact levels) and, on the other hand, would enable team members to cultivate its meaning and perspective (e.g., observations like emotional reactions, inferences, references to past experiences, guidelines alignment, positioning angles), thereby creating a more solid and inclusive understanding of its impact.
Diverse (business) roles create a shared understanding about the data at hand
Analyzing requirements and defining solutions for innovative and effective software evolve through the collaborative effort of self-organizing cross-functional teams that consist of different roles and expertise. Therefore, bridging the gap of various perceptions and roles over the same collaboration (digital) environment while analyzing and thinking together over specific data/feedback items is at the core of EUREKA. Creating and maintaining shared mental models among team members might minimize misunderstandings and errors while at the same time increase performance and success.
Experience-based approach for discovery, expansive learning for innovation
The ingredients of the EUREKA methodology reside in the fundamental principles of theoretical directions, like Kolb’s experiential learning theory, whereby knowledge is a result of a transformational experience (Kolb, 1984), and Engeström’s activity theory – learning by expanding, that the activity (i.e., data analysis) itself constitutes the medium for learning and development through active collaboration, reflection, and contradiction (Engeström, 2014). The aftermath is to build shared knowledge, meaning, and concepts liable to transform any goal-directed object (i.e., feedback item) to an actionable meaningful, semantically enriched item with purpose.
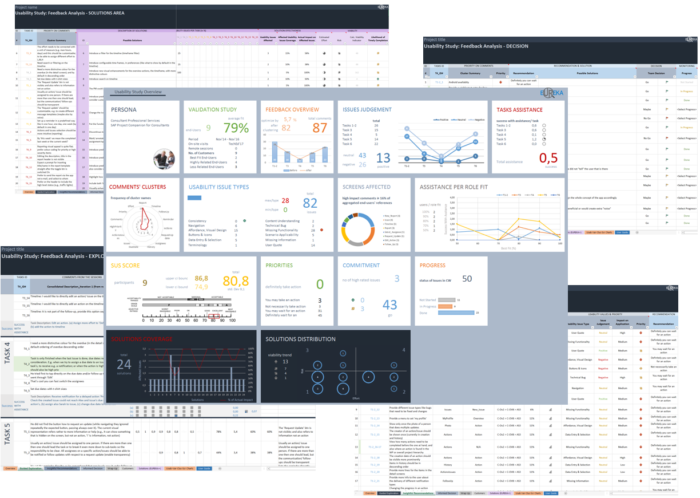
Fig. 2. EUREKA example views
The EUREKA tool is currently available as a prototype (see Fig. 2) and consists of 5 distinctive modules that allow a smooth and consistent application of the more theoretical perspectives discussed above: (i) to create understanding of customers (or end-users), data empathy & clustering through guided exploration (module 1 – the discover phase); (ii) to assign meaning and get insightful recommendations (module 2 – the learn phase); (iii) to meet the issues and expand on challenges by making informed decisions and inclusive wrap up (module 3 – the act phase); (iv) to deep dive in the solutions and spot the coverage and viability (module 4 EUREKA+ – the act phase); and (v) to keep track continuously and ease reporting with a smart overview (module 5 – the monitor phase). Please have a look to our recently published paper for more details in these modules as well as into the theoretical grounds of EUREKA (Germanakos and Fichte, 2018).
The EUREKA methodology and tool have been currently evaluated internally with SAP product teams but also with co-innovation customers in real-life business settings. A synopsis of the added value could be expressed in three points. First, there is indeed a starting point for qualitative data analysis, keeping all team members in the loop, who then collaborate to produce a structured semantically enriched outcome, which pays off the effort invested for acquiring it. Secondly, a solution that facilitates knowledge transfer and enables the necessary openness and flexibility, which allows each project team to analyze the collected usability data to the extent it wants and needs. Thirdly, a holistic perspective that maintains a strong relationship between tasks, feedback items, designs, use cases, usability issue types, and impact on a solution.
Of course, this is just the beginning. Our vision is to lead EUREKA to the next level. We would like to develop a product that will make the life of project teams even more easier. We want to enhance it with best-of-breed technologies and intelligent algorithms that will provide smart guidance to team members depending on the level of their UX expertise and will make sure to automate and provide support for key steps during the analysis process, e.g., clustering recommendation of feedback items, or sentiment analysis of the received comments. Also, we are eager to take advantage of the machine learning potential for suggesting further actions based on previous successful solutions to usability issues and teams’ decisions. But, for all these, you have to… wait for it!
To our knowledge, no other approach today provides such a return in relation to the effort invested for empirical data analysis of user studies. Our main concern for the teams is to develop usable and qualitative software, and, in this respect, EUREKA provides a holistic modular solution that as the great philosopher Aristotle once stated, “The whole is greater than the sum of its parts.”
References
Kolb, D. (1984). Experiential Learning: experience as the source of learning and development, Eng-lewood Cliffs, NJ: Prentice Hall, p. 21.
Engeström, Y. (2014). Learning by expanding. Cambridge University Press.
Germanakos P. & Fichte L. (2018). “EUREKA: Engineering Usability Research Empirical Knowledge and Artifacts – An Experience-based Expansive Learning Approach”, Proceedings of the 20th International Conference on Human-Computer Interaction (HCI 2018), Las Vegas, Nevada, July 15-20, 2018, Lecture Notes in Computer Science 10924, Springer, pp. 85-103.
- SAP Managed Tags:
- User Experience
Related Content
- A dive into the First 10 Partner Innovations on Generative AI Hub in Technology Blogs by SAP
- Leveraging SAP BTP and Generative AI for Peace: A Vision for Conflict Resolution To Prevent Wars and Post-War Support in Technology Blogs by Members
- Say hello to Joule - Your Digital Assistant for SuccessFactors and other SAP Cloud products in Human Capital Management Blogs by Members
- SAP Product Insights Summit 2023 Recap in Additional Blogs by SAP
- 5 ways User Experience Drives New Business in Technology Blogs by SAP