
- SAP Community
- Products and Technology
- Technology
- Technology Blogs by SAP
- What’s New in SAP Analytics Cloud and SAP Digital ...
Technology Blogs by SAP
Learn how to extend and personalize SAP applications. Follow the SAP technology blog for insights into SAP BTP, ABAP, SAP Analytics Cloud, SAP HANA, and more.
Turn on suggestions
Auto-suggest helps you quickly narrow down your search results by suggesting possible matches as you type.
Showing results for
Product and Topic Expert
Options
- Subscribe to RSS Feed
- Mark as New
- Mark as Read
- Bookmark
- Subscribe
- Printer Friendly Page
- Report Inappropriate Content
07-17-2018
12:38 AM
This blog covers some of the latest new features and enhancements in SAP Analytics Cloud and SAP Digital Boardroom release 2018.13. Please note that the Analytics Cloud Help documentation is updated at the same time as the upgrade to this release, so the links here may not yet reflect what is described below until after the upgrade is complete.
Upgrade your SAP Analytics Cloud agent to the latest agent version 1.0.111 to take advantage of all the data acquisition types!
If you haven’t upgraded yet, here are the data acquisition minimum requirements:
- Version 1.0.85 for SAP Business Warehouse (BW). However, we highly recommend that you update to 1.0.109 for the best results.
- Version 1.0.99 for SAP ERP / SQL databases
- Version 1.0.91 for SAP Universe (UNX)
- Version 1.0.75 for all other data source types
For more information, see System Requirements and Technical Prerequisites.
Highlights of this release:
- Planning: Search for assignees and members of distribution dimensions
- Planning: Define columns to display and create comments
- Planning: Hiding rows and columns
- Planning: Inversion for Grand Total
- Data Integration: Run quick actions and suggested transformations in card view
- Data Integration: Run multiple data import jobs in a sequence
- Data Integration: Notification for failed data refresh
- Data Integration: Per-user connection management for failed refresh
- Smart Assist: Create R-visualizations on live HANA models
- Administration & Infrastructure: Comment on restricted measures in tables
- Mobile: Stories support hyperlinks
- Mobile: Automatic refresh option
- Data Visualization: Configure input controls to apply to a sub-set of charts
- Data Visualization: Improved linked analysis for tables
- Data Visualization: Wrap text for input controls
Learn with our latest video tutorials
- Create a model from SuccessFactors Workforce Analytics
- Apply filters to a chart in a story
- Apply filters to a geo map in a story
- Full tutorial playlist >
Planning
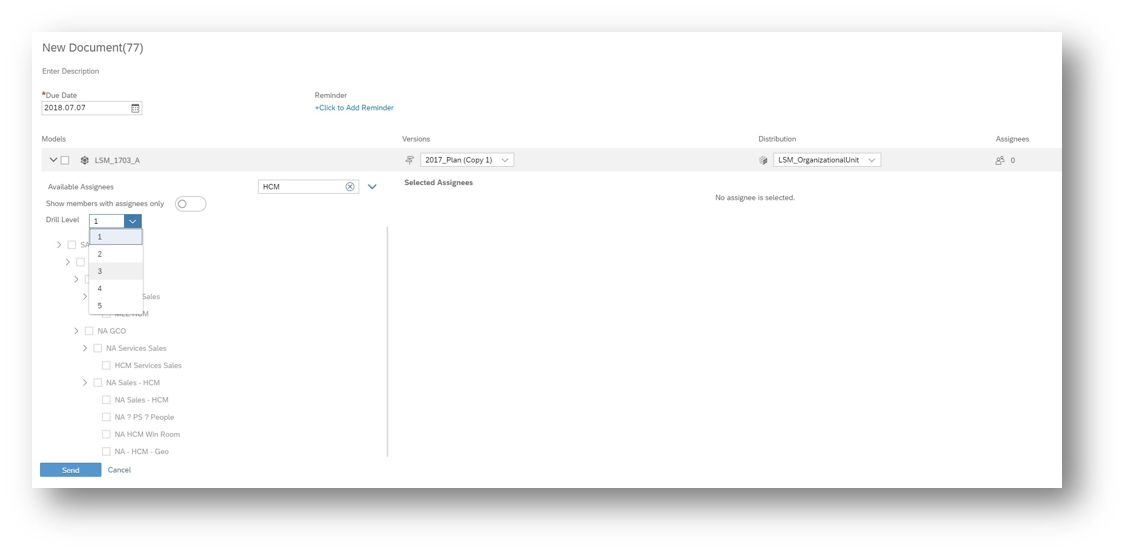
Search for assignees and members of distribution dimensions
Colleague gone missing again? Look no further! Now when you create input tasks you can search for assignees and members of the distribution dimension, or filter by level to easily identify responsibility owners.
Learn more about working with assigned input tasks
Define columns to display and create comments
Make important comments easily visible. In certain cases of plan input and variance reporting it is typical to surface visible commentary in-line about a given cell. Now we allow you to utilize our existing cell commenting capabilities to help satisfy this requirement. You can surface cell comments associated with a specific column in another column thus making these comments clearly visible to anyone opening the story. The most recent comment of the last thread will be the one shown in the grid.

Learn more about adding comments to a data cell
Hiding rows and columns
Controlling the information that you want your stakeholders to see just got easier. We added an effortless way for you to filter out unwanted members and create asymmetrical views in a table. On any given row or column, you can now hide members. These hidden members can include complex filters based on nested dimension elements.

Inversion on Grand Total
Financial planners and controllers rejoice! We have extended our inversion formula concept to include GrandTotal and %GrandTotal formulas. Inversion formulas against these functions now allow you to change the % weight of Grand Total for given cell, and have it update the underlying absolute value for that cell. The surrounding cells will change based on a redistribution of their historical % of Grand Total.

Learn more about inverse formulas
Data Integration
Run quick actions and suggested transformations in card view
The Card View has been further enhanced to allow data analysts to easily perform smart transformations, as well as delete and hide columns. Multi-selection can be enabled with (Ctrl + Click), making it seamless for you to perform multiple quick actions all in one go!

Run multiple data import jobs in a sequence
It’s never been easier to bring your data into SAP Analytics Cloud. You can now bundle multiple data import jobs in the sequence of your choice. If your job fails for whatever reason, you can choose to halt the import temporarily or skip the failed import and keep going. It’s up to you!

Notification for failed data refresh
Want to make sure that all your data is up to date? You can now choose to receive an e-mail notification if an issue occurs with any of your data import jobs.

Per-user connection management for failed refresh
Typed in the wrong password? No worries. Now if your data import refresh job fails due to missing credentials, you can now easily enter your login information within the same data source tab and resolve the issue on the spot!

Smart Assist
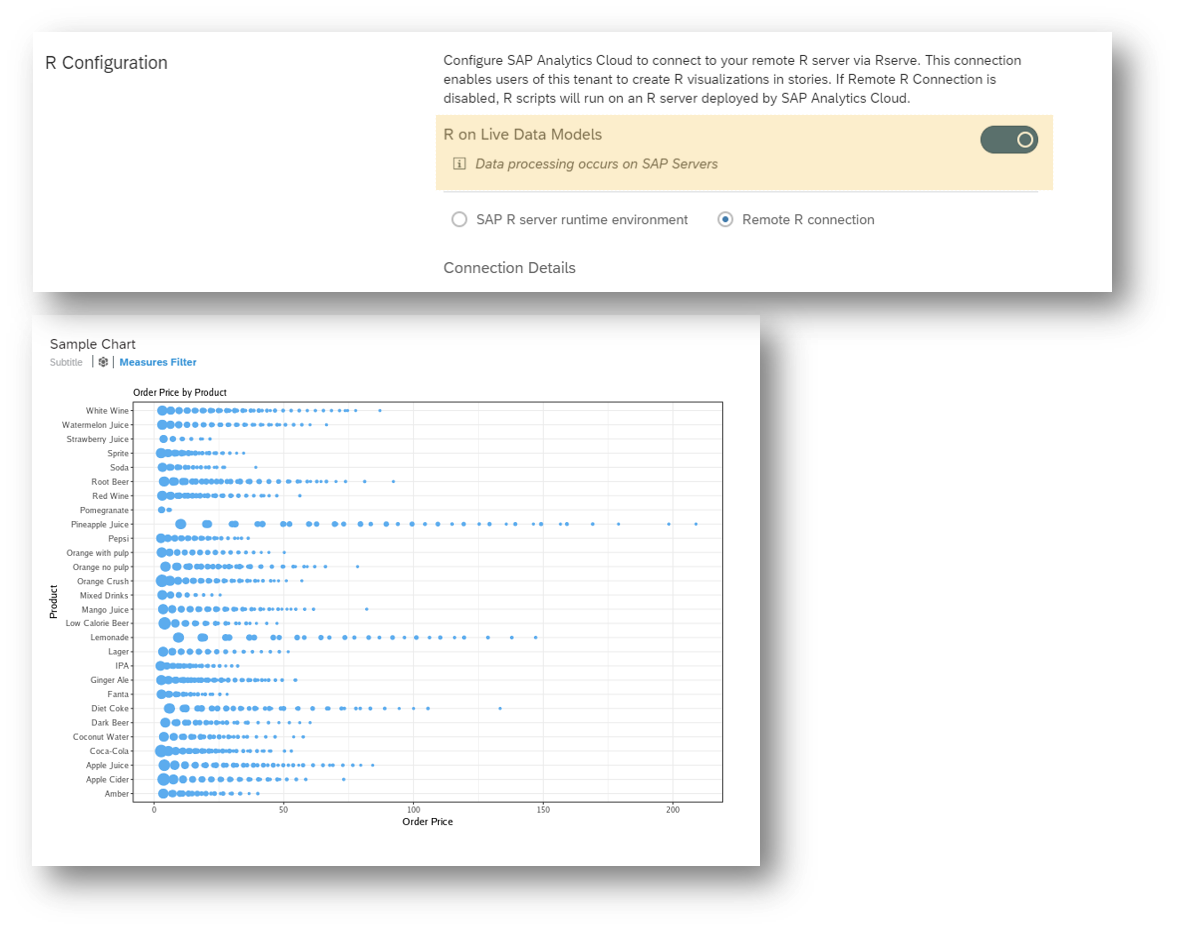
Create R-visualizations on live HANA models
Think big! Now you can put your R skills to the test and create R-visualizations based live HANA data. Setting this up is as easy as having your SAP Analytics Cloud system administrator toggle on R for live data models in the R configuration page. As the HANA data for R is cached in SAP Analytics Cloud we support the lesser of 5 million rows or 3 million data cells or 110 MB of source HANA data.
Learn more about creating R-visualizations
Administration & Infrastructure
Comment on restricted measures in tables
Work is always more fun when you can work together! Now you can collaborate with your colleagues and comment on restricted measures in your tables. Your restricted measure comments will still show up in other tables across your stories when the data context is maintained.

Mobile
Stories support hyperlinks
Sharing is caring! Now you can hyperlink other story pages, web pages and even include links to other iOS apps within your mobile stories. Titles, chart tiles, text widgets, header widgets, shapes and images within your story are all fair game. In Digital Boardroom presentations, you can link using boardroom hyperlinks. This feature opens the possibility to continue workflows in another app, or act based on something interesting you’ve found in your SAC story.

Learn more about hyperlinking in stories
Automatic refresh option
Tired of seeing old data? Now you can choose to have story pages automatically refresh when you open your app! Enabling or disabling this feature can be done in the settings tab and this option will override any pre-existing server settings.

Learn more about configuring auto refresh for stories
Data Visualization
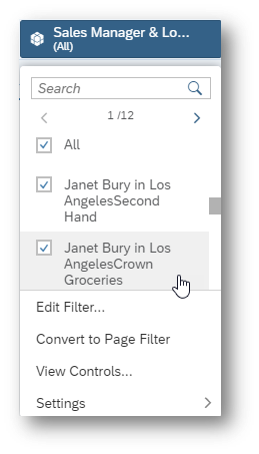
Configure input controls to apply to a sub-set of charts
Want to have more control over your charts? Analysts rejoice! As a story designer, you can configure the page input control to apply changes to a subset of selected widgets instead of an entire page. Through edit and view mode, you can see exactly which widgets are impacted by which input control.
Sneak peek: we’re working on expanding this capability into a new Smart Discovery experience coming soon.

Improved linked analysis for tables
You no longer need your reading glasses to view more data. You can now expand hierarchies without triggering linked analysis. Selected cells will be highlighted which allows you to easily read your data without influencing other widgets.

Learn more about linked analysis
Wrap text for input controls
Gone are the days of freaky formatting. Now you can easily apply wrap text for dimension input controls. Wrapped text now becomes the default for all new input controls, simplifying the way you view all your input control captions.
Additional resources:
- Video tutorials
- Guided learning
- Events and recordings
- SAP Analytics Cloud help resources
- Official roadmap contains more info on future plans, subject to change.
Previous feature summary blogs:
- SAP Analytics Cloud release 2018.12
- SAP Analytics Cloud release 2018.11
- SAP Analytics Cloud release 2018.10
- SAP Analytics Cloud release 2018.09
- SAP Analytics Cloud release 2018.08
- SAP Analytics Cloud release 2018.07
- SAP Analytics Cloud release 2018.06
- SAP Analytics Cloud release 2018.05
- SAP Analytics Cloud release 2018.04
- SAP Analytics Cloud release 2018.03
- SAP Analytics Cloud release 2018.02
- SAP Analytics Cloud release 2018.01
- More >
**Legal disclaimer
SAP has no obligation to pursue any course of business outlined in this blog or any related presentation, or to develop or release any functionality mentioned therein. This blog, or any related presentation and SAP’s possible future developments, products and or platforms directions and functionality are all subject to change and may be changed by SAP at any time for any reason without notice. The information in this blog is not a commitment, promise or legal obligation to deliver any material, code, or functionality. This blog is provided without a warranty of any kind, either express or implied, including but not limited to, the implied warranties of merchantability, fitness for a particular purpose, or non-infringement. This blog is for informational purposes and may not be incorporated into a contract. SAP assumes no responsibility for errors or omissions in this document, except if such damages were caused by SAP’s willful misconduct or gross negligence.
All forward-looking statements are subject to various risks and uncertainties that could cause actual results to differ materially from expectations. Readers are cautioned not to place undue reliance on these forward-looking statements, and should not be relied upon in making purchasing decisions.
- SAP Managed Tags:
- SAP Analytics Cloud
4 Comments
You must be a registered user to add a comment. If you've already registered, sign in. Otherwise, register and sign in.
Labels in this area
-
ABAP CDS Views - CDC (Change Data Capture)
2 -
AI
1 -
Analyze Workload Data
1 -
BTP
1 -
Business and IT Integration
2 -
Business application stu
1 -
Business Technology Platform
1 -
Business Trends
1,661 -
Business Trends
88 -
CAP
1 -
cf
1 -
Cloud Foundry
1 -
Confluent
1 -
Customer COE Basics and Fundamentals
1 -
Customer COE Latest and Greatest
3 -
Customer Data Browser app
1 -
Data Analysis Tool
1 -
data migration
1 -
data transfer
1 -
Datasphere
2 -
Event Information
1,400 -
Event Information
65 -
Expert
1 -
Expert Insights
178 -
Expert Insights
280 -
General
1 -
Google cloud
1 -
Google Next'24
1 -
Kafka
1 -
Life at SAP
784 -
Life at SAP
11 -
Migrate your Data App
1 -
MTA
1 -
Network Performance Analysis
1 -
NodeJS
1 -
PDF
1 -
POC
1 -
Product Updates
4,577 -
Product Updates
330 -
Replication Flow
1 -
RisewithSAP
1 -
SAP BTP
1 -
SAP BTP Cloud Foundry
1 -
SAP Cloud ALM
1 -
SAP Cloud Application Programming Model
1 -
SAP Datasphere
2 -
SAP S4HANA Cloud
1 -
SAP S4HANA Migration Cockpit
1 -
Technology Updates
6,886 -
Technology Updates
408 -
Workload Fluctuations
1
Related Content
- 体验更丝滑!SAP 分析云 2024.07 版功能更新 in Technology Blogs by SAP
- Top Picks: Innovations Highlights from SAP Business Technology Platform (Q1/2024) in Technology Blogs by SAP
- What’s New in SAP Analytics Cloud Release 2024.08 in Technology Blogs by SAP
- Sneak Peek in to SAP Analytics Cloud release for Q2 2024 in Technology Blogs by SAP
- Deep dive into Q4 2023, What’s New in SAP Cloud ALM for Implementation Blog Series in Technology Blogs by SAP
Top kudoed authors
| User | Count |
|---|---|
| 13 | |
| 11 | |
| 10 | |
| 9 | |
| 9 | |
| 7 | |
| 6 | |
| 5 | |
| 5 | |
| 5 |