
- SAP Community
- Products and Technology
- Technology
- Technology Blogs by Members
- Performance Analysis of Runtime Node in SAP Cloud ...
Technology Blogs by Members
Explore a vibrant mix of technical expertise, industry insights, and tech buzz in member blogs covering SAP products, technology, and events. Get in the mix!
Turn on suggestions
Auto-suggest helps you quickly narrow down your search results by suggesting possible matches as you type.
Showing results for
vadimklimov
Active Contributor
Options
- Subscribe to RSS Feed
- Mark as New
- Mark as Read
- Bookmark
- Subscribe
- Printer Friendly Page
- Report Inappropriate Content
06-20-2018
11:30 PM
Intro
SAP CPI provides certain tooling that is helpful when investigating some aspects of performance issues that can happen with an integration flow – in particular, verbose logging of integration flow steps, which is not only capable of collecting details of each step execution, but also visualizing the entire executed path and steps’ sequence on an integration flow diagram. This is useful, if we need to check steps that are the most time consuming, as log records contain information on start and end time of each step execution. In script steps, the developer can utilize Message Processing Log API and complement standard log entries with custom logs, where information on major milestones of script logic – including some insight into performance of those logical blocks, based on timestamp recording – can be provided.
There are cases when logging is not sufficient for an integration flow performance issues analysis and troubleshooting – such as when additional log entries cannot be added programmatically or when more precise investigation of runtime is required. Examples can be standard integration flow steps, or nested calls invoked from script steps.
What tools would be commonly used in such cases in on premise hosted Java applications? Collection of series of thread dumps, followed by inspection of snapshots of runtime behavior of the application and observation of how threads performed over time, is nice technique to start from. If more detailed information based on continuous runtime inspection is required, then sampling and profiling techniques become handy.
What about SAP CP hosted Java applications? Collection of thread dumps is possible there using JMX Console, profiling is possible using Java Profiling service in Neo environment. Then, what about CPI? Its core integration services are based on Java framework and are executed in JVM runtime, and it is deployed in Neo environment. Above techniques – collection of thread dumps and profiling – are not yet possible using Web UI of CPI. Let’s see how we can address this and mitigate to some extent, and get helpful insight into an integration flow at its runtime – namely, trigger thread dumps programmatically and inject this logic into an integration flow.
Overview
In context of CPI runtime nodes, we are limited in ways to access JVM native interfaces – in particular, we can execute custom code within JVM that will make use of them (for example, by means of custom scripts in integration flows), but we cannot attach to running JVM of a runtime node using management interface such as JMX or JVM Tool Interface. Taking this into account, in this blog, I will focus on demonstration of the way how to invoke thread dumps from within an integration flow. Following approach is going to be used and described: within an integration flow, a custom script is created and placed before the flow steps for which we need to inspect behavior and collect thread dumps that will include those steps’ execution – script implements logic to create a new thread which will trigger series of thread dumps with the given number of thread dumps in the series and interval between thread snapshots.
It is important that thread responsible for triggering thread dumps, is created as a separate thread and is decoupled from an integration flow – meaning that custom script in an integration flow only defines what logic needs to be executed to trigger and record thread dumps, and then creates and starts a new thread that will execute defined logic.
In the demo, I will use a simple integration flow that is started by an HTTP request. For the same of brevity, the integration flow is pass through scenario (it doesn’t contain any logic except the script we focus on) that calls a custom web-based application on receiver side. The called application intentionally implements delayed response, so that we can simulate end to end delay caused by long request execution on the called backend application. In real life scenarios, delay can originate from variety of flow steps – execution of complex script steps, execution of mapping steps against large messages, calls to remote systems, etc.
Collected thread dumps are recorded to runtime node’s log (don’t get confused – I’m not using message processing log here) in plain text.
To make usage of the integration flow more convenient, a router step has been added, so that based on custom header passed in the request call, it can be decided, if the integration flow shall be executed following normal path, or if it needs to follow route that invokes the script and triggers thread dumps. That can turn to be helpful, if you are testing the integration flow and need to make thread dump collection feature conditional:

As the demo is based on HTTP request as a flow trigger, I have chosen custom HTTP headers as a mechanism for passing number of thread dumps to be collected and interval between thread snapshots. For example, the below request invokes collection of series of 5 thread dumps, triggered every 2000 ms (2 seconds):

Depending on a particular use case and integration flow configuration, the way and form how these parameters are delivered to an integration flow and are utilized by the script, can vary. So can vary destination for storage of collected thread dumps – instead of the log, alternative options can be used, too.
Implementation and collection of thread dumps
ThreadMXBean (which is a part of management interface for JVM) is used to retrieve snapshot of all currently alive threads and information about each of them. Periodically repeated invocation of ThreadMXBean.dumpAllThreads() help us to retrieve series of such snapshots. In this way, we mimic logic that is be commonly called by externally attached JVM admin and monitoring tools – such as JMX Console.
Next, it is required to place this piece of logic into a separate thread and start that thread from the script. This is achieved by using generic Java approach: new thread is created, implementation of logic that needs to be executed by the thread (which is here – invocation of thread dumping and recording of thread dumps in the log), is inserted into its method run(), and finally new thread is started – which implicitly calls implementation of its method run().
import com.sap.gateway.ip.core.customdev.util.Message

import java.lang.management.ManagementFactory

import java.lang.management.ThreadInfo

import java.lang.management.ThreadMXBean


Message processData(Message message) {


    int threadDumpNumber = message.headers['X-ThreadDump-Number'] as int

    long threadDumpInterval = message.headers['X-ThreadDump-Interval'] as long


    Thread thread = new Thread() {


        @Override

		void run() {


			StringBuilder builder = new StringBuilder()

			ThreadMXBean threadMXBean = ManagementFactory.threadMXBean


			threadDumpNumber.times {

                println "Thread dump ${it}"


				builder.setLength(0)


                threadMXBean.dumpAllThreads(true, true).each {

                    builder.append(it)

                }


                println builder.toString()


			    sleep(threadDumpInterval)

		    }


		}


    }


    thread.name = 'Thread Dump Trigger'

	thread.start()


    return message


}
In the presented demo, I use implementation based on anonymous class embedded directly in the method processData() of the script, as logic is not complex and implementation is readable. In more complex and advanced scenarios, it is highly recommended to review and refactor this in such a way that Runnable implementations are decoupled and kept separate from script’s message processing core method.
Now it is time to navigate to CPI Monitoring view, go to System Log Files (this view can be also accessed via following URL path in the CPI tenant: /itspaces/shell/monitoring/SystemLogs) and retrieve generated log – which is essentially default trace:

After cleanup, the formatted log looks like the one below:
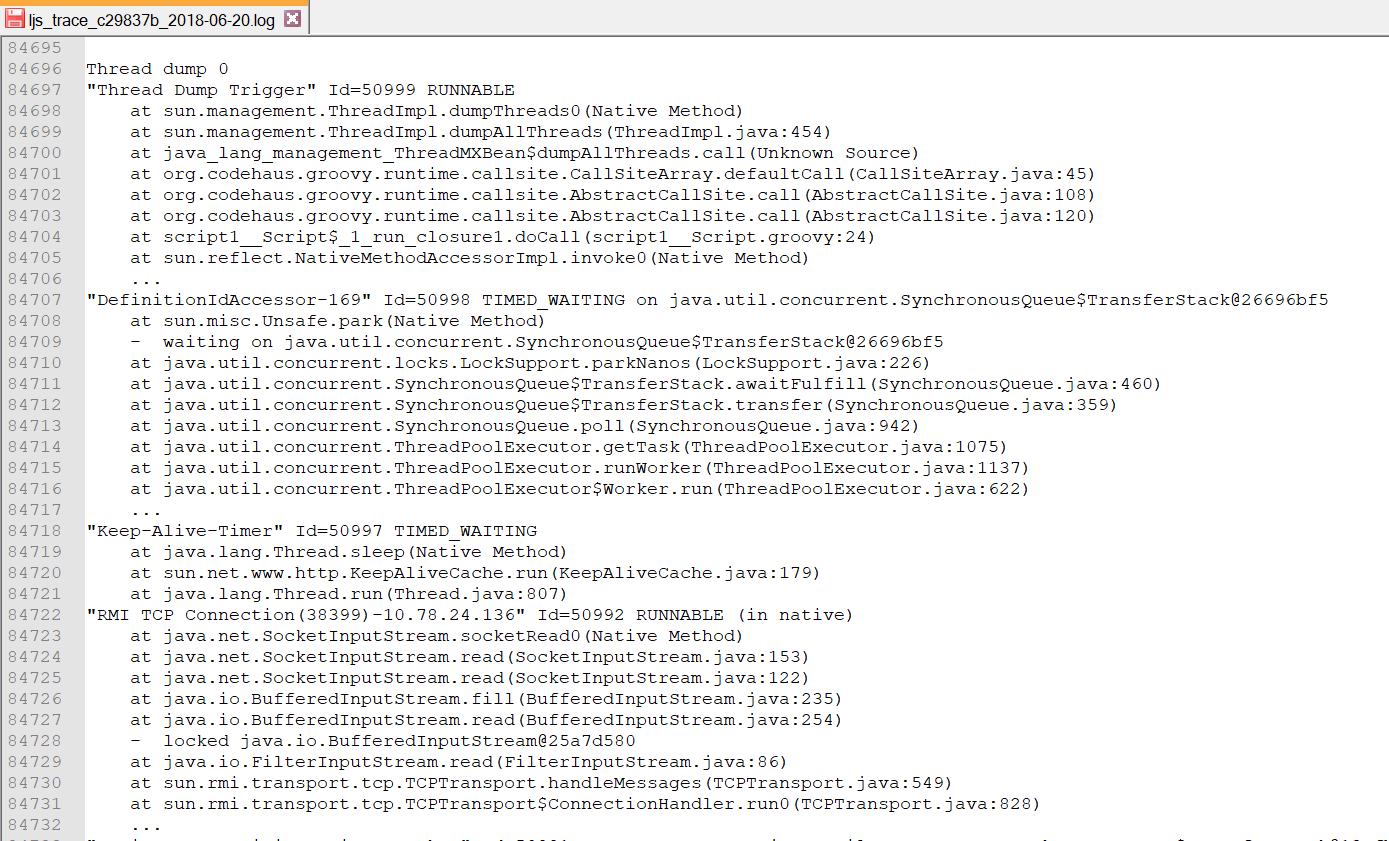
As it can be seen from the screenshot, we got thread dumps and are set to analyse them. Almost, but not completely yet. Note that stack traces of threads only show last 8 elements (stack frames) for each thread. While it might be negligible in some cases, there are cases where we need to explore the whole (or major part of) call stack of the thread, and not only most current frames that were put into thread’s stack – highly nested calls (driven by complex sequence of calls involving different layers of the application) and functions with deep level of recursion are few good reasons for this.
If your case is amongst those when you are satisfied with topmost 8 stack frames per thread call stack and this limitation doesn’t cause issues for thread dump interpretation and analysis, remaining part of the blog is unlikely to bring value, but will instead introduce unnecessary complexity. But, if full stack trace is required, then let’s look how we can address this issue and eliminate limitation.
The mentioned limitation comes from the attempt to stringify content of thread info when appending it to a string builder:
threadMXBean.dumpAllThreads(true, true).each {

   builder.append(it)

}
Method ThreadInfo.toString() in Java SDK is implemented in such a way that it sets hard limit of stack frames that are produced in an output, and this limit is defined by private constant that is equal to 8. To overcome this limit, we can create our own implementation of the method toString() that will be used for thread info stringification, where custom implementation will pass all available stack frames of the thread to output. Custom toString() implementations are fairly common in Java world, so I will not go into details of this approach – instead, I will replace initially used method with part of original implementation of ThreadInfo.toString() (full implementation of this method produces more verbose output – here, I only used part of it for illustration purposes), slightly modifying and adjusting it to utilize Groovy capabilities and making implementation more compact. As a result, code snippet provided above, becomes replaced with the one below:
threadMXBean.dumpAllThreads(true, true).each {

	builder.append("\"${it.threadName}\" Id=${it.threadId} ${it.threadState}")


	if (it.lockName) {

		builder.append(" on ${it.lockName}")

	}


	if (it.lockOwnerName) {

		builder.append(" owned by \"${it.lockOwnerName}\" Id=${it.lockOwnerId}")

	}


	if (it.suspended) {

		builder.append(' (suspended)')

	}


	if (it.inNative) {

		builder.append(' (in native)')

	}


	builder.append('\n')


	it.stackTrace.each {

		builder.append("\tat ${it}\n")

	}

}
Let’s trigger the integration flow once again, download log file, clean and format it, and check obtained output:

Now thread dumps contain full call stack for each alive thread – exactly what we were looking for!
Preparatory work – collection of thread dumps – is over by now and concludes the blog. In real life scenario, this is merely a starting point for analysis that shall give insight into what node’s JVM executed at a time of thread dumps collection and reveal any possible performance issues related to specific threads or applications that created them.
- SAP Managed Tags:
- SAP Integration Suite,
- Cloud Integration
4 Comments
You must be a registered user to add a comment. If you've already registered, sign in. Otherwise, register and sign in.
Labels in this area
-
"automatische backups"
1 -
"regelmäßige sicherung"
1 -
"TypeScript" "Development" "FeedBack"
1 -
505 Technology Updates 53
1 -
ABAP
14 -
ABAP API
1 -
ABAP CDS Views
2 -
ABAP CDS Views - BW Extraction
1 -
ABAP CDS Views - CDC (Change Data Capture)
1 -
ABAP class
2 -
ABAP Cloud
2 -
ABAP Development
5 -
ABAP in Eclipse
1 -
ABAP Platform Trial
1 -
ABAP Programming
2 -
abap technical
1 -
absl
2 -
access data from SAP Datasphere directly from Snowflake
1 -
Access data from SAP datasphere to Qliksense
1 -
Accrual
1 -
action
1 -
adapter modules
1 -
Addon
1 -
Adobe Document Services
1 -
ADS
1 -
ADS Config
1 -
ADS with ABAP
1 -
ADS with Java
1 -
ADT
2 -
Advance Shipping and Receiving
1 -
Advanced Event Mesh
3 -
AEM
1 -
AI
7 -
AI Launchpad
1 -
AI Projects
1 -
AIML
9 -
Alert in Sap analytical cloud
1 -
Amazon S3
1 -
Analytical Dataset
1 -
Analytical Model
1 -
Analytics
1 -
Analyze Workload Data
1 -
annotations
1 -
API
1 -
API and Integration
3 -
API Call
2 -
Application Architecture
1 -
Application Development
5 -
Application Development for SAP HANA Cloud
3 -
Applications and Business Processes (AP)
1 -
Artificial Intelligence
1 -
Artificial Intelligence (AI)
5 -
Artificial Intelligence (AI) 1 Business Trends 363 Business Trends 8 Digital Transformation with Cloud ERP (DT) 1 Event Information 462 Event Information 15 Expert Insights 114 Expert Insights 76 Life at SAP 418 Life at SAP 1 Product Updates 4
1 -
Artificial Intelligence (AI) blockchain Data & Analytics
1 -
Artificial Intelligence (AI) blockchain Data & Analytics Intelligent Enterprise
1 -
Artificial Intelligence (AI) blockchain Data & Analytics Intelligent Enterprise Oil Gas IoT Exploration Production
1 -
Artificial Intelligence (AI) blockchain Data & Analytics Intelligent Enterprise sustainability responsibility esg social compliance cybersecurity risk
1 -
ASE
1 -
ASR
2 -
ASUG
1 -
Attachments
1 -
Authorisations
1 -
Automating Processes
1 -
Automation
2 -
aws
2 -
Azure
1 -
Azure AI Studio
1 -
B2B Integration
1 -
Backorder Processing
1 -
Backup
1 -
Backup and Recovery
1 -
Backup schedule
1 -
BADI_MATERIAL_CHECK error message
1 -
Bank
1 -
BAS
1 -
basis
2 -
Basis Monitoring & Tcodes with Key notes
2 -
Batch Management
1 -
BDC
1 -
Best Practice
1 -
bitcoin
1 -
Blockchain
3 -
bodl
1 -
BOP in aATP
1 -
BOP Segments
1 -
BOP Strategies
1 -
BOP Variant
1 -
BPC
1 -
BPC LIVE
1 -
BTP
12 -
BTP Destination
2 -
Business AI
1 -
Business and IT Integration
1 -
Business application stu
1 -
Business Application Studio
1 -
Business Architecture
1 -
Business Communication Services
1 -
Business Continuity
1 -
Business Data Fabric
3 -
Business Partner
12 -
Business Partner Master Data
10 -
Business Technology Platform
2 -
Business Trends
4 -
CA
1 -
calculation view
1 -
CAP
3 -
Capgemini
1 -
CAPM
1 -
Catalyst for Efficiency: Revolutionizing SAP Integration Suite with Artificial Intelligence (AI) and
1 -
CCMS
2 -
CDQ
12 -
CDS
2 -
Cental Finance
1 -
Certificates
1 -
CFL
1 -
Change Management
1 -
chatbot
1 -
chatgpt
3 -
CL_SALV_TABLE
2 -
Class Runner
1 -
Classrunner
1 -
Cloud ALM Monitoring
1 -
Cloud ALM Operations
1 -
cloud connector
1 -
Cloud Extensibility
1 -
Cloud Foundry
4 -
Cloud Integration
6 -
Cloud Platform Integration
2 -
cloudalm
1 -
communication
1 -
Compensation Information Management
1 -
Compensation Management
1 -
Compliance
1 -
Compound Employee API
1 -
Configuration
1 -
Connectors
1 -
Consolidation Extension for SAP Analytics Cloud
2 -
Control Indicators.
1 -
Controller-Service-Repository pattern
1 -
Conversion
1 -
Cosine similarity
1 -
cryptocurrency
1 -
CSI
1 -
ctms
1 -
Custom chatbot
3 -
Custom Destination Service
1 -
custom fields
1 -
Customer Experience
1 -
Customer Journey
1 -
Customizing
1 -
cyber security
3 -
Data
1 -
Data & Analytics
1 -
Data Aging
1 -
Data Analytics
2 -
Data and Analytics (DA)
1 -
Data Archiving
1 -
Data Back-up
1 -
Data Governance
5 -
Data Integration
2 -
Data Quality
12 -
Data Quality Management
12 -
Data Synchronization
1 -
data transfer
1 -
Data Unleashed
1 -
Data Value
8 -
database tables
1 -
Datasphere
2 -
datenbanksicherung
1 -
dba cockpit
1 -
dbacockpit
1 -
Debugging
2 -
Delimiting Pay Components
1 -
Delta Integrations
1 -
Destination
3 -
Destination Service
1 -
Developer extensibility
1 -
Developing with SAP Integration Suite
1 -
Devops
1 -
digital transformation
1 -
Documentation
1 -
Dot Product
1 -
DQM
1 -
dump database
1 -
dump transaction
1 -
e-Invoice
1 -
E4H Conversion
1 -
Eclipse ADT ABAP Development Tools
2 -
edoc
1 -
edocument
1 -
ELA
1 -
Embedded Consolidation
1 -
Embedding
1 -
Embeddings
1 -
Employee Central
1 -
Employee Central Payroll
1 -
Employee Central Time Off
1 -
Employee Information
1 -
Employee Rehires
1 -
Enable Now
1 -
Enable now manager
1 -
endpoint
1 -
Enhancement Request
1 -
Enterprise Architecture
1 -
ETL Business Analytics with SAP Signavio
1 -
Euclidean distance
1 -
Event Dates
1 -
Event Driven Architecture
1 -
Event Mesh
2 -
Event Reason
1 -
EventBasedIntegration
1 -
EWM
1 -
EWM Outbound configuration
1 -
EWM-TM-Integration
1 -
Existing Event Changes
1 -
Expand
1 -
Expert
2 -
Expert Insights
2 -
Fiori
14 -
Fiori Elements
2 -
Fiori SAPUI5
12 -
Flask
1 -
Full Stack
8 -
Funds Management
1 -
General
1 -
Generative AI
1 -
Getting Started
1 -
GitHub
8 -
Grants Management
1 -
groovy
1 -
GTP
1 -
HANA
6 -
HANA Cloud
2 -
Hana Cloud Database Integration
2 -
HANA DB
2 -
HANA XS Advanced
1 -
Historical Events
1 -
home labs
1 -
HowTo
1 -
HR Data Management
1 -
html5
8 -
HTML5 Application
1 -
Identity cards validation
1 -
idm
1 -
Implementation
1 -
input parameter
1 -
instant payments
1 -
Integration
3 -
Integration Advisor
1 -
Integration Architecture
1 -
Integration Center
1 -
Integration Suite
1 -
intelligent enterprise
1 -
iot
1 -
Java
1 -
job
1 -
Job Information Changes
1 -
Job-Related Events
1 -
Job_Event_Information
1 -
joule
4 -
Journal Entries
1 -
Just Ask
1 -
Kerberos for ABAP
8 -
Kerberos for JAVA
8 -
KNN
1 -
Launch Wizard
1 -
learning content
2 -
Life at SAP
4 -
lightning
1 -
Linear Regression SAP HANA Cloud
1 -
local tax regulations
1 -
LP
1 -
Machine Learning
2 -
Marketing
1 -
Master Data
3 -
Master Data Management
14 -
Maxdb
2 -
MDG
1 -
MDGM
1 -
MDM
1 -
Message box.
1 -
Messages on RF Device
1 -
Microservices Architecture
1 -
Microsoft Universal Print
1 -
Middleware Solutions
1 -
Migration
5 -
ML Model Development
1 -
Modeling in SAP HANA Cloud
8 -
Monitoring
3 -
MTA
1 -
Multi-Record Scenarios
1 -
Multiple Event Triggers
1 -
Neo
1 -
New Event Creation
1 -
New Feature
1 -
Newcomer
1 -
NodeJS
2 -
ODATA
2 -
OData APIs
1 -
odatav2
1 -
ODATAV4
1 -
ODBC
1 -
ODBC Connection
1 -
Onpremise
1 -
open source
2 -
OpenAI API
1 -
Oracle
1 -
PaPM
1 -
PaPM Dynamic Data Copy through Writer function
1 -
PaPM Remote Call
1 -
PAS-C01
1 -
Pay Component Management
1 -
PGP
1 -
Pickle
1 -
PLANNING ARCHITECTURE
1 -
Popup in Sap analytical cloud
1 -
PostgrSQL
1 -
POSTMAN
1 -
Process Automation
2 -
Product Updates
4 -
PSM
1 -
Public Cloud
1 -
Python
4 -
Qlik
1 -
Qualtrics
1 -
RAP
3 -
RAP BO
2 -
Record Deletion
1 -
Recovery
1 -
recurring payments
1 -
redeply
1 -
Release
1 -
Remote Consumption Model
1 -
Replication Flows
1 -
research
1 -
Resilience
1 -
REST
1 -
REST API
1 -
Retagging Required
1 -
Risk
1 -
Rolling Kernel Switch
1 -
route
1 -
rules
1 -
S4 HANA
1 -
S4 HANA Cloud
1 -
S4 HANA On-Premise
1 -
S4HANA
3 -
S4HANA_OP_2023
2 -
SAC
10 -
SAC PLANNING
9 -
SAP
4 -
SAP ABAP
1 -
SAP Advanced Event Mesh
1 -
SAP AI Core
8 -
SAP AI Launchpad
8 -
SAP Analytic Cloud Compass
1 -
Sap Analytical Cloud
1 -
SAP Analytics Cloud
4 -
SAP Analytics Cloud for Consolidation
3 -
SAP Analytics Cloud Story
1 -
SAP analytics clouds
1 -
SAP BAS
1 -
SAP Basis
6 -
SAP BODS
1 -
SAP BODS certification.
1 -
SAP BTP
21 -
SAP BTP Build Work Zone
2 -
SAP BTP Cloud Foundry
6 -
SAP BTP Costing
1 -
SAP BTP CTMS
1 -
SAP BTP Innovation
1 -
SAP BTP Migration Tool
1 -
SAP BTP SDK IOS
1 -
SAP Build
11 -
SAP Build App
1 -
SAP Build apps
1 -
SAP Build CodeJam
1 -
SAP Build Process Automation
3 -
SAP Build work zone
10 -
SAP Business Objects Platform
1 -
SAP Business Technology
2 -
SAP Business Technology Platform (XP)
1 -
sap bw
1 -
SAP CAP
2 -
SAP CDC
1 -
SAP CDP
1 -
SAP CDS VIEW
1 -
SAP Certification
1 -
SAP Cloud ALM
4 -
SAP Cloud Application Programming Model
1 -
SAP Cloud Integration for Data Services
1 -
SAP cloud platform
8 -
SAP Companion
1 -
SAP CPI
3 -
SAP CPI (Cloud Platform Integration)
2 -
SAP CPI Discover tab
1 -
sap credential store
1 -
SAP Customer Data Cloud
1 -
SAP Customer Data Platform
1 -
SAP Data Intelligence
1 -
SAP Data Migration in Retail Industry
1 -
SAP Data Services
1 -
SAP DATABASE
1 -
SAP Dataspher to Non SAP BI tools
1 -
SAP Datasphere
10 -
SAP DRC
1 -
SAP EWM
1 -
SAP Fiori
2 -
SAP Fiori App Embedding
1 -
Sap Fiori Extension Project Using BAS
1 -
SAP GRC
1 -
SAP HANA
1 -
SAP HCM (Human Capital Management)
1 -
SAP HR Solutions
1 -
SAP IDM
1 -
SAP Integration Suite
9 -
SAP Integrations
4 -
SAP iRPA
2 -
SAP Learning Class
1 -
SAP Learning Hub
1 -
SAP Odata
2 -
SAP on Azure
1 -
SAP PartnerEdge
1 -
sap partners
1 -
SAP Password Reset
1 -
SAP PO Migration
1 -
SAP Prepackaged Content
1 -
SAP Process Automation
2 -
SAP Process Integration
2 -
SAP Process Orchestration
1 -
SAP S4HANA
2 -
SAP S4HANA Cloud
1 -
SAP S4HANA Cloud for Finance
1 -
SAP S4HANA Cloud private edition
1 -
SAP Sandbox
1 -
SAP STMS
1 -
SAP successfactors
3 -
SAP SuccessFactors HXM Core
1 -
SAP Time
1 -
SAP TM
2 -
SAP Trading Partner Management
1 -
SAP UI5
1 -
SAP Upgrade
1 -
SAP Utilities
1 -
SAP-GUI
8 -
SAP_COM_0276
1 -
SAPBTP
1 -
SAPCPI
1 -
SAPEWM
1 -
sapmentors
1 -
saponaws
2 -
SAPS4HANA
1 -
SAPUI5
4 -
schedule
1 -
Secure Login Client Setup
8 -
security
9 -
Selenium Testing
1 -
SEN
1 -
SEN Manager
1 -
service
1 -
SET_CELL_TYPE
1 -
SET_CELL_TYPE_COLUMN
1 -
SFTP scenario
2 -
Simplex
1 -
Single Sign On
8 -
Singlesource
1 -
SKLearn
1 -
soap
1 -
Software Development
1 -
SOLMAN
1 -
solman 7.2
2 -
Solution Manager
3 -
sp_dumpdb
1 -
sp_dumptrans
1 -
SQL
1 -
sql script
1 -
SSL
8 -
SSO
8 -
Substring function
1 -
SuccessFactors
1 -
SuccessFactors Platform
1 -
SuccessFactors Time Tracking
1 -
Sybase
1 -
system copy method
1 -
System owner
1 -
Table splitting
1 -
Tax Integration
1 -
Technical article
1 -
Technical articles
1 -
Technology Updates
14 -
Technology Updates
1 -
Technology_Updates
1 -
terraform
1 -
Threats
1 -
Time Collectors
1 -
Time Off
2 -
Time Sheet
1 -
Time Sheet SAP SuccessFactors Time Tracking
1 -
Tips and tricks
2 -
toggle button
1 -
Tools
1 -
Trainings & Certifications
1 -
Transport in SAP BODS
1 -
Transport Management
1 -
TypeScript
2 -
ui designer
1 -
unbind
1 -
Unified Customer Profile
1 -
UPB
1 -
Use of Parameters for Data Copy in PaPM
1 -
User Unlock
1 -
VA02
1 -
Validations
1 -
Vector Database
2 -
Vector Engine
1 -
Visual Studio Code
1 -
VSCode
1 -
Web SDK
1 -
work zone
1 -
workload
1 -
xsa
1 -
XSA Refresh
1
- « Previous
- Next »
Related Content
- IoT - Ultimate Data Cyber Security - with Enterprise Blockchain and SAP BTP 🚀 in Technology Blogs by Members
- Analyze Expensive ABAP Workload in the Cloud with Work Process Sampling in Technology Blogs by SAP
- Introducing Blog Series of SAP Signavio Process Insights, discovery edition – An in-depth exploratio in Technology Blogs by SAP
- Unify your process and task mining insights: How SAP UEM by Knoa integrates with SAP Signavio in Technology Blogs by SAP
- SAP HANA Cloud Vector Engine: Quick FAQ Reference in Technology Blogs by SAP
Top kudoed authors
| User | Count |
|---|---|
| 12 | |
| 12 | |
| 5 | |
| 5 | |
| 5 | |
| 4 | |
| 4 | |
| 3 | |
| 3 | |
| 3 |