
- SAP Community
- Products and Technology
- Technology
- Technology Blogs by SAP
- SAP BI 4.2 SP6: What’s New In Web Intelligence and...
Technology Blogs by SAP
Learn how to extend and personalize SAP applications. Follow the SAP technology blog for insights into SAP BTP, ABAP, SAP Analytics Cloud, SAP HANA, and more.
Turn on suggestions
Auto-suggest helps you quickly narrow down your search results by suggesting possible matches as you type.
Showing results for
Advisor
Options
- Subscribe to RSS Feed
- Mark as New
- Mark as Read
- Bookmark
- Subscribe
- Printer Friendly Page
- Report Inappropriate Content
06-19-2018
2:53 AM
This document summarizes the enhancements in the SAP BI 4.2 Support Package 6 for Web Intelligence and Semantic Layer.
Following the enhancements brought in SAP BI 4.2 and its Support Packages (see here for more details), SAP keeps investing in the most popular and used Analytics tool in the SAP Portfolio.
SAP BI 4.2 SP6 delivers many awaited features and incremental enhancements so as to create the foundation for all follow-up releases and meeting the high expectations of our large customer base.
These new features focus on:
This document also gives a quick overview of some other enhancements in the BI Platform tools.
The new Web Intelligence Interactive Viewer based on SAP FIORI has been released in SAP BI 4.2 SP4 and was improved in SAP BI 4.2 SP5. In SAP BI 4.2 SP6, the following enhancements were added.
In Web Intelligence Interactive Viewer, you can refresh your document regularly and automatically, without having to click the Refresh button yourself (request 110164). This capability has been implemented in Web Intelligence Interactive Viewer only and is not available in the DHTML client, the Java Applet nor in the Rich Client.
To enable the auto-refresh mode, open a document in Web Intelligence Interactive Viewer. In the toolbar, click the Advanced button and then select the Auto Refresh… command.

Enter the auto-refresh frequency; between 1 minute and 1440 minutes (corresponding to one day). In case you save your document, this frequency is saved, too.

If your document contains prompts, you are asked to answer them. These values will then be kept for the next refresh actions. This means that in case of dynamic default values for your prompts, they are not updated during the next refresh actions.
Your document is now in auto-refresh mode: it will be automatically refreshed according to the frequency you have defined.
This mode is intended for viewing only:

To exit the auto-refresh mode, click the Turn Off Auto Refresh button in the toolbar.
A new menu in the toolbar replaces the previous Advanced toggle-button. Now, when you click the Advanced button, a menu opens enabling you to:

When you open a document the dataset of which is filtered through an input control, element linking or drill, the Filters Bar is opened so as to be able to immediately view these filters (request 107547).
You can add some dynamic effect to your chart by animating them (request 127771).
Thanks to these animations charts are progressively displayed, when you open your document.
For example, for bar charts this means that their bars grow progressively, for line charts, the line is being displayed little by little or fade out,…

These animations are disabled by default and can be enabled for a given document through the Chart animations toggle button located in the Document Summary side panel.
As an administrator, you can define via the CM/Customization which Web Intelligence features and UI components (buttons, menus…) your users can view in Web Intelligence.
In SAP BI 4.2 SP6, Web Intelligence supports customizations, at feature level and not at user interface elements level.
If you disable the:
If disabled, Reading Mode, Data Mode and Shared Elements features have no impact in Web Intelligence Interactive Viewer.
The following table compares Web Intelligence Interactive Viewer capabilities in SAP BI 4.2 SP5 and SAP BI 4.2 SP6 with the Web Intelligence HTML or Java reader.
(*) Schedule: in classic BI launch pad for Web Intelligence HTML/Applet; in new BI launch pad for Web Intelligence Interactive Viewer
One of the major enhancements in Web Intelligence 4.2 SP6 is the support of the time dimension to better analyze time in datasets. Authoring is available only in DHTML, but it is supported for viewing in all Web Intelligence clients (Interactive Viewer, DHTML, Java Applet and Rich Client).
If the data type of a dimension or detail is Date or Date Time, you can enforce the date it returns by defining a time dimension.
In the Available Objects side panel, right-click the dimension or detail and select the Edit as a Time dimension command.

In the Time Dimension dialog box that opens, you can define a time dimension for this object:

Once your dimension is defined, it appears in the Available Objects side panel, under the original object.
You may define several time dimensions for the same object.

You can drag and drop a time level or one of its attributes to feed a table or a chart in your report (request 100657) and take advantage of the time dimension capabilities, i.e.:
Non-existing data in the calendar is automatically added with no value. This can be useful to display time series on charts.


Time levels can also be used for drilling, filtering and input controls.
Time dimension is saved in the Web Intelligence document. For the moment, it cannot be defined at universe level or saved in shared elements.
View time filtering (requests 101311 and 109693) applies to Web Intelligence documents based on relational universes (mono-source or multi-source) created in the Information Design Tool. The View Time Filtering is based on a Business Security Profile created for this universe and assigned to users and groups. These Business Security Profiles already apply when you refresh the query:
Before SAP BI 4.2 SP6, the only way to force these security profiles to get applied was to use the Refresh on open checkbox.
With the View Time Filtering, this database refresh is no longer necessary; which improves opening time.
In Design mode, you can enable the view time filtering by selecting the Apply security filtering on open checkbox in the document property.
It is not possible to select both the Refresh on open and Apply security filtering on open options.

When you open a document and this checkbox is selected, the security filter is applied to the dataset contained in the document in case a Business Security Profile applies to the user:
If this checkbox is not selected, Web Intelligence does not connect to the CMS repository to retrieve a Business Security Profile (if any) and View Time Filtering is not applied.
In the following example, a power user creates a document on a universe (UNX) and query the objects Company Name, Country Name, Margin and Cost. No Security Profile has been assigned to him and he can see the complete dataset.

A Business Security Profile has been created and assigned to another user:

When this user opens the document, if the view time filtering has been enabled, then the Margin column is obfuscated and only rows for "France" are displayed.

If the Business Security Profile is based on an object that is not available in the source document, then an error message is displayed and the dataset is purged when the user opens the document. In our example, this may happen if the Business Security Profile has a filter City Name = "Paris" since the City Name object is not part of the query.
Web Intelligence allows you to create intra-document links (request 143633). This functionality can be used to provide guided analysis in a document for example in which the first report could contain high-level measures associated to intra document links. Clicking these links switches to other reports containing details about these measures.
In Web Intelligence Interactive Viewer, intra-document links can also be an alternate way of navigation from one report to another in a document, rather than using the reports drop-down menu.
Intra-document links can only be created in Web Intelligence DHTML; but they can be used in the DHTML client, the Java Applet, the Rich Client and the Interactive Viewer.
To create an intra-document link in Design mode, right-click a cell and select the Linking > Add Intra-Document Link command.

In the Intra-Document link tab of the Create Hyperlink dialog box, select the target report in the Report name dropdown menu.
In the Tooltip dropdown menu, you can define the tooltip to display when you hover with your mouse over the link. It can consist of simple text or it can be based on a formula.

Click OK to validate your link. In the cell, the link is displayed as an HTML expression containing the code to switch to the selected report.
When you click this link, the code is run and you are directed to the corresponding report.
This capability is based on HTML code. As an administrator, you consequently need to go to the CMC to enable it. For security reasons, the list of HTML elements is restricted by default since SAP BI 4.2 SP4.
To do so, select the Enable only HTML elements defined in Authorized HTML Elements page option in the Web Intelligence application’s properties page of the CMC, and in the Authorized HTML elements page, authorize the onclick and title attributes for the <a> tag.

You may also simply select the Enable hyperlinks, JavaScript, and all HTML elements option in the Web Intelligence application’s properties.

When adding a break to a table, measures for which an aggregation was defined are automatically added to the break footer (request 133654).

The method PageInSection, available in Desktop Intelligence, is now available in Web Intelligence formula language (request 100916). When used in a section, this formula returns the current section’s page number. This page number is reset to 1 for each section.
The Report Conversion Tool has been updated to also support this method when converting Desktop Intelligence documents.
When exporting a document to PDF, you can select a new checkbox Display Bookmarks to have the bookmarks displayed by default when you open the PDF file (request 117202). This option is available in all Web Intelligence clients.
Charts and tables have new default styles and parameters for a more modern and simplified look and feel. This will not affect existing documents but new documents will apply these updated default parameters.
Default look of a newly created table:
The autofit columns property is disabled.

Following the table example, the default style of charts has also been simplified. Hence:
A new palette called Belize was introduced to provide better color contrast.


The simplification of these styles does also slightly improve the performance when you open a document.
In addition to the date support (request 100657) and the animations in Web Intelligence Interactive Viewer described previously, other enhancements have been made in the Web Intelligence charts engine.
New built-in charts types are now available:

For Bar Charts, you can have overlapping columns by using negative values in the Spacing within Groups parameter (request 142085).

For Waterfall Charts, you can use formula to define value axis (request 203847).

In Web Intelligence DHTML, you can use a text file (TXT or CSV) that was previously uploaded in the CMS repository as a data source (request 129303). This support is similar to the Excel file support.
When creating a document or adding a new data source, you have the option to select a text file.

You can select the text file in the CMS repository and define the parameters to interpret the text file (data separator, text delimiter…)

Once the file is open, you can select the objects from the text file to retrieve in the Query Panel. Click Refresh or Run Query to close the Query Panel and retrieve the dataset to the document.

You can select the queries you want to be refreshed or not when the document is refreshed (request 106185).
This can typically be useful for documents based on multiple queries some of which retrieve data that does not evolve very often (warehouse geographical data, list of products). You can refresh these queries a first time to fill the Web Intelligence micro-cube, and then disable them for the next refresh actions. These queries will not refresh, but their datasets will be retrieved from the micro-cube containing the values of first refresh.
This option was already available for Excel data sources; it is now also available for universes (UNV and UNX), text files, Free-Hand SQL, SAP BW Direct Access and SAP HANA Direct Access data providers.
You can disable the query refresh in Design mode by unselecting the Refreshable checkbox of the Query Properties dialog box.

When this option is not selected, you can no longer preview the dataset in the Query Panel.
In the formula language, the QuerySummary method has been updated to return this option’s value.
The Web Intelligence Opendoc URL was optimized to ease the integration of Web Intelligence content in other interfaces or portals.
In addition to the sOutputFormat=P option, the opendoc URL now supports the sOutputFormat=E option to export a Web Intelligence document as an Excel file (request 102141).
These two options are also supported in Web Intelligence Interactive Viewer (request 206701). If you retrieve your document as PDF or Excel via the sViewer=fiori option, a window opens while the output files are downloaded to your local folder. If the document requires you to answer a few prompts, they are also displayed in this window.

We added the option sReportMode=Light so that a document can be opened in a simplified interface that contains only the selected document or report. This mode is supported for Web Intelligence DHTML, Java Applet and Interactive Viewer.
In Web Intelligence DHTML client and the Java applet, the side panel and the toolbars are not displayed.

In Web Intelligence Interactive Viewer, the toolbar and the Web Intelligence side panel are not displayed. You can only access the fading toolbar and the report selector.

When you open a document with the sViewer=fiori option, it is displayed full screen without the BI Launch Pad header. If you also use the browser’s full screen capability (for example with F11 on Chrome) and the previously described Auto-Refresh mode, you can optimize the document display through an auto-refresh on a large screen.
SAP BW and SAP HANA Parameters support in the opendoc URL was released in SAP BI 4.2 SP5 through a hot fix. They are also supported in SAP BI 4.2 SP6. The parameters and the values are passed through the lsM option. This option can take most SAP BW or SAP HANA operators, as described in the table below.
Operators can be combined with the ; character to propose complex conditions. For example: &lsMprompt=>12;<20;!15;30
The same Web Intelligence document can be refreshed in the same browser in a session opened by the same user in BI Launch Pad and via OpenDoc. The session is no longer shared; which prevents errors in case of concurrent actions.
When scheduling or publishing a document, the Date placeholder (%SI_DATE%) can be used instead of the DateTime placeholder, so as to return only the date.
In the Information Design Tool, you can create a universe based on stored procedures (request 101311) or convert a universe created in the Universe Design Tool (UNV) and based on a stored procedure.


The stored procedure result set is exposed as one or more tables in the data foundation. You can then create a business layer on top of this data foundation and publish it as a universe in the CMS repository. Such universes can be secured by Business Security Profiles only, and not by Data Security Profiles.
The refresh structure does not yet support stored procedure tables.
As for the Universe Design Tool, there are the following limitations:
Several enhancements have been performed in the Information Design Tool to ease the designer’s work.
In the Universe Design Tool, it is possible to refresh only the structure of a list of selected tables. This capability is now offered in Information Design Tool. This avoids refreshing the whole data foundation, when updates on only some tables are required (request 140548).
From the main menu bar, select Actions, then Refresh Structure. In the Refresh Data Foundation Structure dialog box, the Selected Tables pane lists all database and derived tables (at this time, stored procedures cannot be refreshed).
If some tables are selected in the data foundation, only these tables are selected in this list; otherwise all tables are selected.
You can also open this dialog box by picking and right-clicking some tables in the data foundation and selecting the Refresh Structure command. Only the selected tables are selected in the Selected Tables pane.

Select the tables to refresh, then click Next to enter the other options to refresh the data foundation structure.
You can perfectly align selected tables in your data foundation (request 127304). By right-clicking them, you now have access to the following commands in the Arrange Tables sub-menu:
These commands can also be found in the data foundation toolbar.

As in the Universe Design Tool, you can use the Ctrl+T shortcut to change all selected tables display from Collapsed to Joins Only to Expanded (request 109987). If no table is selected, then this applies to all tables in the data foundation. This command can also be selected from the right-click menu.

In the data foundation, when right-clicking a column on a table, the contextual menu has been extended and now includes the Create calculated column command (request 133372). There is no need to explicitly right-click the table header to reach this command.
Other commands that are not supported for columns (Check Integrity, Cut, Copy, Paste) have been removed from this contextual menu.

When you create alias table(s), you can select the Duplicate Joins checkbox in the Insert Alias Tables to create the same joins for the alias table(s) as for the source table(s).

To simplify the management of data foundations containing many views (request 204025), there are new commands on the right-click menu:

When the data foundation view is displayed for reading purposes in the business layer, the contextual menu only displays the command to go to a specific view.

Several behaviors in the object’s extra tables implementation have been reviewed and corrected:
In the data foundation editor, you can click the Filters icon in the toolbar to open a non-modal dialog box where you can filter the tables displayed in the data foundation side panel. You can filter these tables by:
The number of filters you have selected is displayed in the toolbar so you can see at a glance that the list of tables is filtered.

Likewise, you can filter the business layer objects by clicking the Filters button in the business layer toolbar. The objects in the business layer can be filtered by:

The Aggregate Navigation dialog box in which you define incompatible objects has been enhanced as follows:

The Find / Replace dialog box has been improved:
When you replace a table name used in an object definition, it is also replaced in the Tables list (request 130697).

Since SAP BI 4.2 SP5, it is possible to use derived tables when creating a list of SQL-based values (request 141699). Such derived tables must be referenced through the method @DerivedTable.
In SAP BI 4.2 SP6, this list of derived tables is displayed in the SQL Expression Editor used to write this SQL. When you drag and drop this table, the method is automatically added to the SQL.
To improve the usability of the Static List of Values panel, a new column is added in front of the table. This column contains the row number. When creating a new static list of values, there is by default one column (named Column 1) and one row. When adding a new row, cells of type String now contain the empty string.

Selecting columns and rows has been made easier:


It is still possible to double-click a column header to open the LOV Column Properties dialog box to set its name, its data type and whether it should be hidden or not.
The Detect button has been removed since it is useless for a static list of values.
In the business layer, you can right-click an object or a folder and select the Duplicate command to duplicate the selected object or folder. This can be used as a shortcut for the combination of the two commands Copy and Paste.

In the Repository Resources toolbar, you can click the Search icon to open the Search in CMS dialog box. In the Searching String, you may enter a text string and click Search to find the resources (connection, universes or BI Sets) in the CMS repository that match this string (request 106208). This search is fast since it leverages the BI Platform search and its index.
The results are displayed in a non-modal dialog box. You may double-click a result to move the focus on this resource in the Repository Resources pane.

When you hover with your mouse over a universe in the Repository Resources panel, a tooltip opens providing additional details:
When you retrieve a universe, you can click the New Project button in the Select Project dialog box to create a local project.
No need to close the Select Project dialog box, create your project and re-open the Select Project dialog box.

In Preferences > Information Design Tool, you can select the font used in script editors. This can be used to select monospace font, such as Courier and to better identify space characters in SQL scripts.
SQL scripts are used for example in Data Security Profiles, SQL list of values or object definitions.

Two options introduced in previous support packages are now enabled by default:

The following data sources are now supported by Connection Server / universes:
The complete list of supported data sources can be found in the Product Availability Matrix.
In SAP BI 4.2 SP6, the Database tab of the Set Containers Management dialog box displays the tables used to store materialized sets. It especially displays calendars and periods that are now also materialized in the database along with the sets. All tables are now created after the first publish, so a missing table is now considered to be a system inconsistency during the startup check.

When defining a set based on a Visual Data step, you are no longer limited to the objects coming from the same table as the subject. You may use any objects of the universe, except the ones for which an incompatibility with the table containing the subject was defined.

When defining a set based on Query Panel steps, you may start your step with all your subject’s members. You do not need to add a filter in the query, as you had to in previous releases.
You may also use custom SQL in your query panel step instead of using the SQL that is automatically generated through the universe:

Right-click a set that has been materialized and click:

Scoring a set allows you to differentiate its members instead of considering them as identical. For example, in your set of premium customers, you may identify sub-groups defined on a criterion the value of which is linked to this score.
In the Information Design Tool, a new field named Score is available in each step used to define the set (both static and temporal): visual data step, query panel step and sets-on-sets step. In this field, you may define an integer: positive or negative or null (by default). With temporal sets, scoring is only meaningful for the last built period.
Each set member is assigned a score, which is the sum of all scores of the steps defining this member.
Scores are saved during materialization in a new column of the table where the sets are saved. At this time, the only way to get this score is to directly access the column value or create new universe objects to query it.
The filters in set editor toolbar takes advantages of the same look and feel than the filters in the data foundation and business layer editors. Identically, when you define sets on sets, you can now use the Filters non-modal dialog box to filters the displayed sets.

BI Sets are now supported for the following databases:
In SAP BI 4.2 SP6, SAP Live Office leverages Web Intelligence comments:
In the Web Intelligence viewer, you may click the Import cells and tables as pictures checkbox to import selected report elements as pictures. This can be used to keep a report element formatting and keep both its text and background picture. Without activating this checkbox, if the report element contains both text and a background picture, then only the text is imported.
In the query panel, different icons are used to distinguish universes created with the Universe Design Tool and the ones created with the Information Design Tool. The query panel header has a maximize icon to display it full screen.
To improve the user interface performance, the number of calls to the server was reduced. The list of values is no longer displayed when you open the Prompts dialog box, i.e. you must explicitly click Refresh to get this list of values.
In the CMC, the Visual Difference tool has been rewritten to use the SAP FIORI HTML5 graphical library and replace Flash. It was extended to also support Web Intelligence documents’ metadata (request 106360).
Visual Difference can be used to find the following differences in Web Intelligence documents:
Once Visual Difference is started in the CMC, click the New Comparison button to select the objects to compare.
The New comparison wizard opens. In the Select System pane, you can define the repository containing the source and target content to compare. In the dropdown menu, you can select the Use Current System choice to use the current repository to which you are connected.
You can click the Use same system as target checkbox to select the source and target objects in the same system. Click Next.

In the Objects Selection pane, select the objects to compare in the Reference and Target tree list. You may also select folders to compare folder content. Click Next.

In the Summary pane, you may change the name for this comparison job to better identify it and re-use it later. Click Compare to create the comparison job.
Once the job is complete, click > to see the comparison results or select the checkbox and click View differences to view the result details.

The comparison is processed and the results are progressively displayed . The differences are listed by categories in the different tabs.

Lateron you can relaunch the same comparison job by selecting it in the Visual Difference home page and click the Rerun button.
As an administrator, you can disable the GDPR message that displays for every user in BI Launch Pad and the CMC. This capability has been released as part of an SAP BI 4.2 SP5 patch (see KBA 2604727) and it is now also available in SAP BI 4.2 SP6.
In the new BI Launch Pad, the Search has also been improved:
Following the enhancements brought in SAP BI 4.2 and its Support Packages (see here for more details), SAP keeps investing in the most popular and used Analytics tool in the SAP Portfolio.
SAP BI 4.2 SP6 delivers many awaited features and incremental enhancements so as to create the foundation for all follow-up releases and meeting the high expectations of our large customer base.
These new features focus on:
- Web Intelligence Interactive Viewer: Auto-refresh mode, Enable Drill, Filter Bar, Charts Animation, ...
- Web Intelligence Analysis and Reporting: Time Dimension, View-Time Security Filtering, Intra Documen...
- Web Intelligence Query: Text File Data Source, Refreshable Option
- Web Intelligence Opendoc URL: Simplified Mode, Export to PDF, SAP BW and SAP HANA Complex Parameters
- Web Intelligence Server
- Universe Stored Procedure
- Information Design Tool Usability Enhancements
- Supported Databases of Connection Server
- BI Sets: Calendars Materialization, Enhancement in Visual and Query Panels Steps, Scoring, Newly Sup...
- SAP Live Office Enhancements
- Visual Difference: New HTML User Interface, Web Intelligence Metadata Comparison
- BI Launch Pad
This document also gives a quick overview of some other enhancements in the BI Platform tools.
Web Intelligence Interactive Viewer ⤒
The new Web Intelligence Interactive Viewer based on SAP FIORI has been released in SAP BI 4.2 SP4 and was improved in SAP BI 4.2 SP5. In SAP BI 4.2 SP6, the following enhancements were added.
Automatic Refresh
In Web Intelligence Interactive Viewer, you can refresh your document regularly and automatically, without having to click the Refresh button yourself (request 110164). This capability has been implemented in Web Intelligence Interactive Viewer only and is not available in the DHTML client, the Java Applet nor in the Rich Client.
To enable the auto-refresh mode, open a document in Web Intelligence Interactive Viewer. In the toolbar, click the Advanced button and then select the Auto Refresh… command.
Auto-Refresh Command in Advanced Menu
Enter the auto-refresh frequency; between 1 minute and 1440 minutes (corresponding to one day). In case you save your document, this frequency is saved, too.
Auto-Refresh Frequency
If your document contains prompts, you are asked to answer them. These values will then be kept for the next refresh actions. This means that in case of dynamic default values for your prompts, they are not updated during the next refresh actions.
Your document is now in auto-refresh mode: it will be automatically refreshed according to the frequency you have defined.
This mode is intended for viewing only:
- You can only navigate in the document but not modify it: folding/unfolding, ranking, sorting, filtering and commenting capabilities are disabled.
- The toolbar simply displays the last refresh time and the report selector.
- The time out is disabled: the document remains displayed without being disconnected.
Auto-Refresh Mode
To exit the auto-refresh mode, click the Turn Off Auto Refresh button in the toolbar.
Enable/Disable Drill
A new menu in the toolbar replaces the previous Advanced toggle-button. Now, when you click the Advanced button, a menu opens enabling you to:
- Sort and rank,
- Drill (a new capability of this Support Package),
- Fold and unfold,
- Select print or quick layout,
- Switch to previously-described auto-refresh mode.
Web Intelligence Interactive Viewer Advanced Menu
Filters Bar Open When Filters Exist
When you open a document the dataset of which is filtered through an input control, element linking or drill, the Filters Bar is opened so as to be able to immediately view these filters (request 107547).
Filters Bar Opened When Document is Filtered
Charts Animation
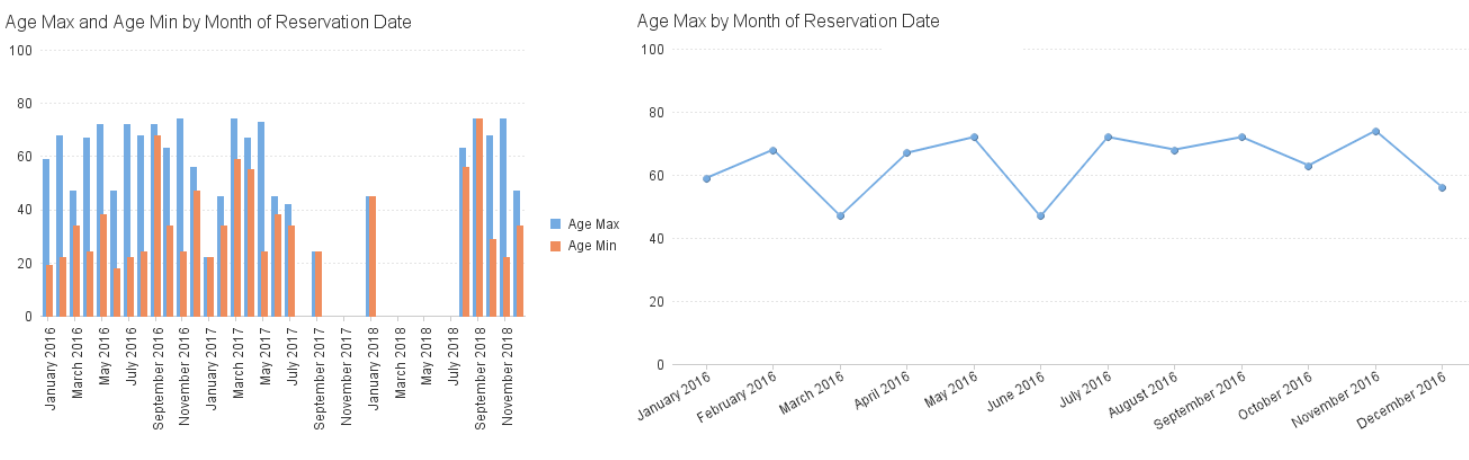
You can add some dynamic effect to your chart by animating them (request 127771).
Thanks to these animations charts are progressively displayed, when you open your document.
For example, for bar charts this means that their bars grow progressively, for line charts, the line is being displayed little by little or fade out,…
Animated Charts
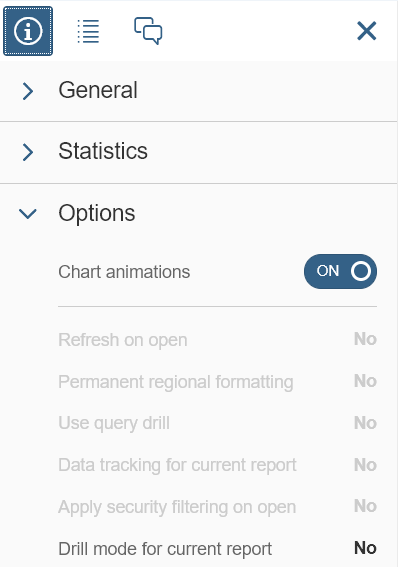
These animations are disabled by default and can be enabled for a given document through the Chart animations toggle button located in the Document Summary side panel.
Chart Animation Toggle Button in Document Summary
Customization
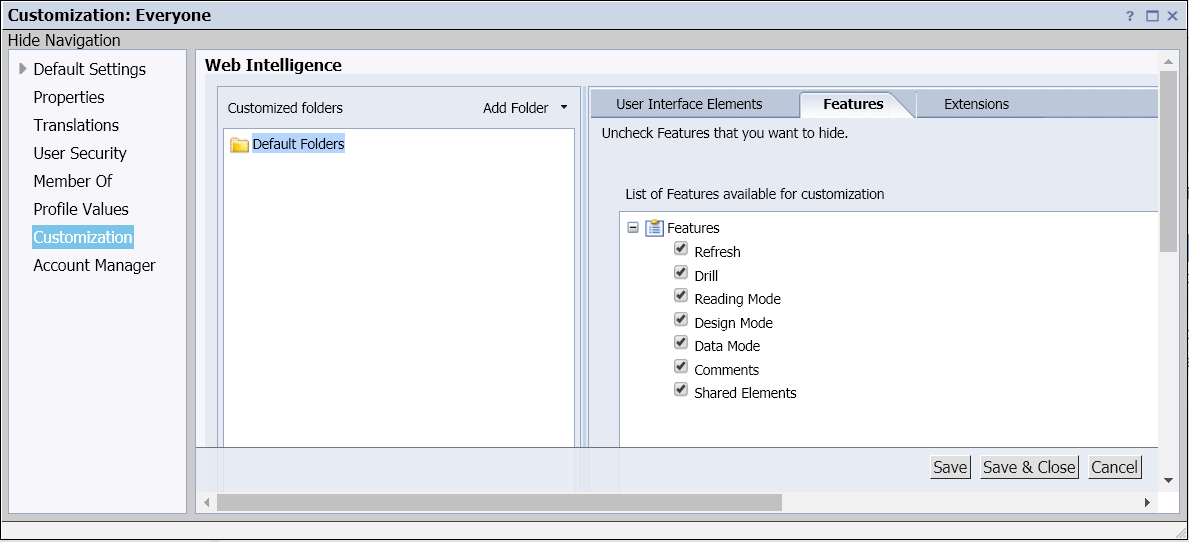
As an administrator, you can define via the CM/Customization which Web Intelligence features and UI components (buttons, menus…) your users can view in Web Intelligence.
Customization Features
In SAP BI 4.2 SP6, Web Intelligence supports customizations, at feature level and not at user interface elements level.
If you disable the:
- Refresh feature, the Refresh and Auto Refresh commands are no longer displayed.
- Drill feature, drilling and enabling/disabling of drilling is not possible.
- Design Mode feature, then it is no longer possible to switch into Design mode from Web Intelligence Interactive Viewer.
- Comments feature, then it is no longer possible to display, add, edit or delete a comment in Web Intelligence Interactive Viewer.
If disabled, Reading Mode, Data Mode and Shared Elements features have no impact in Web Intelligence Interactive Viewer.
Comparison Table
The following table compares Web Intelligence Interactive Viewer capabilities in SAP BI 4.2 SP5 and SAP BI 4.2 SP6 with the Web Intelligence HTML or Java reader.
| Features | HTML/Java Reader 4.2 SP5 | Interactive Viewer 4.2 SP5 | Interactive Viewer 4.2 SP6 |
| Report selection | Yes, via tabs | Yes, via drop-down menu | Yes, via drop-down menu |
| Section navigation | Yes | Yes | Yes |
| Document summary | Yes | Yes, only parameters related to reading | Yes, only parameters related to reading |
| Print document summary | Yes | No | No |
| Status Bar | Yes | No | No |
| Charts | Yes | Yes, displayed as HTML | Yes, displayed as HTML |
| Charts animation | No | No | Yes |
| Custom elements | Yes | Yes, HTML and pictures format supported | Yes, HTML and pictures format supported |
| Freeze headers | Yes | No | No |
| Undo/Redo | Yes | Yes | Yes |
| Expand/collapse hierarchies | Yes | Yes, only for current child | Yes, only for current child |
| Fold/Unfold breaks, sections and tables | Yes | Yes | Yes |
| Input controls and groups of input controls | Yes | Yes, in Filter Bar | Yes, in Filter Bar |
| User Prompt Input | Yes | Yes, in Filter Bar | Yes, in Filter Bar |
| Drill Filters | Yes | Yes (in Filter Bar) if already enabled | Yes |
| Enable drill | Yes | No | Yes |
| Element Linking | Yes | Yes | Yes |
| Ranking | No | Yes | Yes |
| Sorting | No | Yes | Yes |
| Go to Page/ Previous Page/Next Page | Yes | Yes | Yes |
| First Page/Last Page | Yes | Yes | Yes |
| Zoom | Yes | Yes | Yes |
| Quick Display Mode/Page Mode | Yes | Yes | Yes |
| Find | Yes | Via browser’s Find only | Via browser’s Find only |
| Refresh all data providers | Yes | Yes | Yes |
| Refresh one data provider | Yes | No | No, but new Refreshable option |
| Auto-refresh mode | No | No | Yes |
| Prompts | Yes | Yes | Yes |
| BI Variants | Yes | Yes | Yes |
| Track changes | Yes | Yes, if already enabled | Yes, if already enabled |
| Change “Track Changes” parameters | Yes | No | No |
| Save, Save As | Yes | Yes | Yes |
| Export XLS | Yes | No | No |
| Export XLSX | Yes | Yes | Yes |
| Export PDF | Yes | Yes | Yes |
| Export TXT, CSV | Yes | No | No |
| Export HTML | No | Yes | Yes |
| Yes, in Java Applet | No, but you can export to PDF | No, but you can export to PDF | |
| Send to | Yes | Yes | Yes |
| Customization Support | Yes | No | Yes, at feature level |
| Extension Support | Yes | No | No |
| Schedule (*): Recurrence, Events, Scheduling, Server Group, Destinations | Yes | Yes | Yes |
| Schedule: Formats | WID, XLSX, PDF, CSV (data), TXT | WID, XLSX, PDF, CSV (data), CSV (reports), TXT, HTML | WID, XLSX, PDF, CSV (data), CSV (reports), TXT, HTML |
| Schedule: Prompts | Yes | Yes | Yes |
| Schedule: Caching | Yes | No | No |
| Schedule: Delivery Rules | Yes | Yes | Yes |
| Publication | Yes | No | No |
| Touch Compatible | No | Yes | Yes |
(*) Schedule: in classic BI launch pad for Web Intelligence HTML/Applet; in new BI launch pad for Web Intelligence Interactive Viewer
Web Intelligence Analysis and Reporting ⤒
Time Dimension
One of the major enhancements in Web Intelligence 4.2 SP6 is the support of the time dimension to better analyze time in datasets. Authoring is available only in DHTML, but it is supported for viewing in all Web Intelligence clients (Interactive Viewer, DHTML, Java Applet and Rich Client).
If the data type of a dimension or detail is Date or Date Time, you can enforce the date it returns by defining a time dimension.
In the Available Objects side panel, right-click the dimension or detail and select the Edit as a Time dimension command.
Edit as a Time dimension command
In the Time Dimension dialog box that opens, you can define a time dimension for this object:
- Give a name to your dimension and add a description to it.
- Select the levels to expose. For the moment, you can select Year, Semester, Quarter, Month, Week and Day. Week cannot be selected with Semester, Quarter and Month. You may change their default name used to identify them.
- Select the Display the additional attributes for Time Levels checkbox to expose additional attributes for the selected levels.
- You may optionally define the month to start the fiscal year and the day to start the week.
- You may optionally define a start date and end date for your calendar.
Time Dimension Dialog Box
Once your dimension is defined, it appears in the Available Objects side panel, under the original object.
You may define several time dimensions for the same object.
Two Time Dimensions and Their Exposed Level in Available Objects
You can drag and drop a time level or one of its attributes to feed a table or a chart in your report (request 100657) and take advantage of the time dimension capabilities, i.e.:
- The chronological sorting of the dataset.
- You can change the time level displayed in a table by right-clicking the level and selecting Change Level from the context menu and the new level among the ones defined in your time dimension. You cannot select a level that is already displayed on the table. This is available in the Web Intelligence Interactive Viewer and the DHTML client.
Non-existing data in the calendar is automatically added with no value. This can be useful to display time series on charts.
Change Level in a Time Dimension
Rows Added for Non-Existing Data
Time Dimension in a Table and a Chart
Time levels can also be used for drilling, filtering and input controls.
Time dimension is saved in the Web Intelligence document. For the moment, it cannot be defined at universe level or saved in shared elements.
View Time Filtering
View time filtering (requests 101311 and 109693) applies to Web Intelligence documents based on relational universes (mono-source or multi-source) created in the Information Design Tool. The View Time Filtering is based on a Business Security Profile created for this universe and assigned to users and groups. These Business Security Profiles already apply when you refresh the query:
- Display Data: Define objects that are denied to users and that do not return data
- Filters: Define filters used for row level filtering
Before SAP BI 4.2 SP6, the only way to force these security profiles to get applied was to use the Refresh on open checkbox.
With the View Time Filtering, this database refresh is no longer necessary; which improves opening time.
In Design mode, you can enable the view time filtering by selecting the Apply security filtering on open checkbox in the document property.
It is not possible to select both the Refresh on open and Apply security filtering on open options.
Apply Security Filtering on Open Option
When you open a document and this checkbox is selected, the security filter is applied to the dataset contained in the document in case a Business Security Profile applies to the user:
- Values coming from objects that are denied with Display Data Business Security Profiles are obfuscated;
- Filters defined in Filters Business Security Profiles are applied to the dataset.
If this checkbox is not selected, Web Intelligence does not connect to the CMS repository to retrieve a Business Security Profile (if any) and View Time Filtering is not applied.
In the following example, a power user creates a document on a universe (UNX) and query the objects Company Name, Country Name, Margin and Cost. No Security Profile has been assigned to him and he can see the complete dataset.
Initial Table
A Business Security Profile has been created and assigned to another user:
- He is not allowed to see the Margin object, through a Display Data Business Security Profile
- He can only see data for country "France", through a Filters Business Security Profile
Business Security Profile Assigned to User: Display Data and Filters
When this user opens the document, if the view time filtering has been enabled, then the Margin column is obfuscated and only rows for "France" are displayed.
Displayed Table After Applying View Time Filtering
If the Business Security Profile is based on an object that is not available in the source document, then an error message is displayed and the dataset is purged when the user opens the document. In our example, this may happen if the Business Security Profile has a filter City Name = "Paris" since the City Name object is not part of the query.
Intra-Document Linking
Web Intelligence allows you to create intra-document links (request 143633). This functionality can be used to provide guided analysis in a document for example in which the first report could contain high-level measures associated to intra document links. Clicking these links switches to other reports containing details about these measures.
In Web Intelligence Interactive Viewer, intra-document links can also be an alternate way of navigation from one report to another in a document, rather than using the reports drop-down menu.
Intra-document links can only be created in Web Intelligence DHTML; but they can be used in the DHTML client, the Java Applet, the Rich Client and the Interactive Viewer.
To create an intra-document link in Design mode, right-click a cell and select the Linking > Add Intra-Document Link command.
Intra-Document Link Tab in Create Hyperlink Dialog Box
In the Intra-Document link tab of the Create Hyperlink dialog box, select the target report in the Report name dropdown menu.
In the Tooltip dropdown menu, you can define the tooltip to display when you hover with your mouse over the link. It can consist of simple text or it can be based on a formula.
Tooltip Definition in Intra-Document Link
Click OK to validate your link. In the cell, the link is displayed as an HTML expression containing the code to switch to the selected report.
When you click this link, the code is run and you are directed to the corresponding report.
This capability is based on HTML code. As an administrator, you consequently need to go to the CMC to enable it. For security reasons, the list of HTML elements is restricted by default since SAP BI 4.2 SP4.
To do so, select the Enable only HTML elements defined in Authorized HTML Elements page option in the Web Intelligence application’s properties page of the CMC, and in the Authorized HTML elements page, authorize the onclick and title attributes for the <a> tag.
Authorized HTML Elements Page
You may also simply select the Enable hyperlinks, JavaScript, and all HTML elements option in the Web Intelligence application’s properties.
Web Intelligence Application Properties
Automatically Add Measure
When adding a break to a table, measures for which an aggregation was defined are automatically added to the break footer (request 133654).
Measure Automatically Added in Break Footer
Page Number Formula per Section
The method PageInSection, available in Desktop Intelligence, is now available in Web Intelligence formula language (request 100916). When used in a section, this formula returns the current section’s page number. This page number is reset to 1 for each section.
The Report Conversion Tool has been updated to also support this method when converting Desktop Intelligence documents.
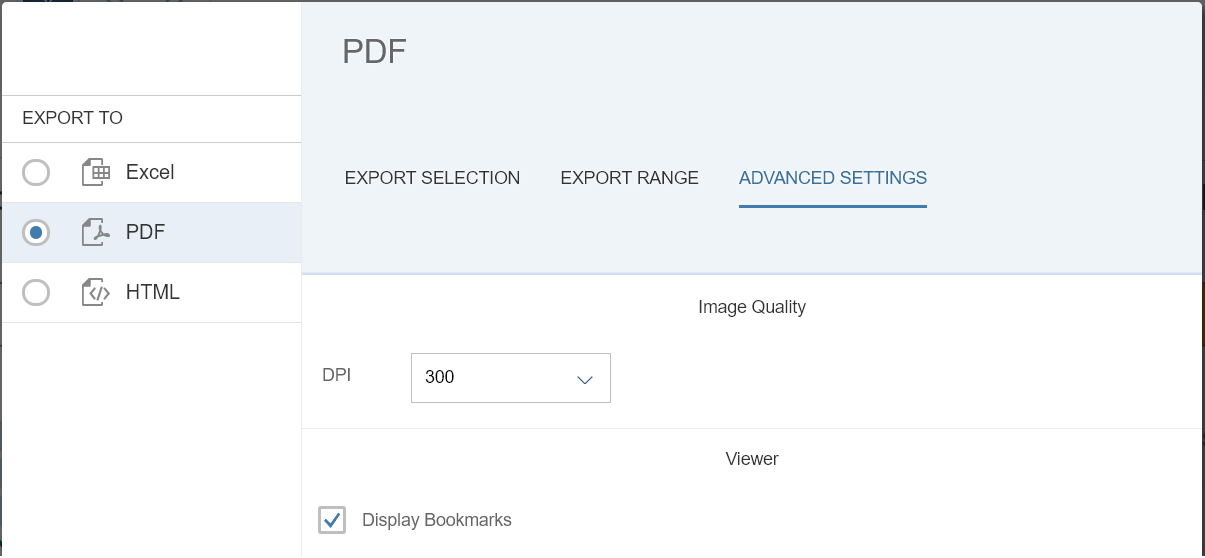
Export PDF Bookmark
When exporting a document to PDF, you can select a new checkbox Display Bookmarks to have the bookmarks displayed by default when you open the PDF file (request 117202). This option is available in all Web Intelligence clients.
Display Bookmarks Checkbox
Modernized Styles
Charts and tables have new default styles and parameters for a more modern and simplified look and feel. This will not affect existing documents but new documents will apply these updated default parameters.
Default look of a newly created table:
- It has a grey background header instead of the previous blue header picture;
- The alternate colors property is disabled for rows;
The autofit columns property is disabled.
New Default Style of a Table
Following the table example, the default style of charts has also been simplified. Hence:
- A default title is automatically generated. It is based on the objects used in the chart.
- Legends are no longer added for simple charts (i.e. charts with one dimension and one measure).
- The axis is lighter and the font is more readable. There are no more axis titles and ticks on the value axis.
A new palette called Belize was introduced to provide better color contrast.
New Default Style of Charts
New Belize Palette
The simplification of these styles does also slightly improve the performance when you open a document.
New Charts Options
In addition to the date support (request 100657) and the animations in Web Intelligence Interactive Viewer described previously, other enhancements have been made in the Web Intelligence charts engine.
New built-in charts types are now available:
- Funnel (request 103493😞 to display different stages of a process and show the measure for each stage.
- Pyramid: to display both the hierarchical structure and quantity of the data in a pyramid-like structure.
New Built-In Charts: Funnel, Pyramid
For Bar Charts, you can have overlapping columns by using negative values in the Spacing within Groups parameter (request 142085).
Overlapping Columns in Bar Chart
For Waterfall Charts, you can use formula to define value axis (request 203847).
Waterfall Chart Value Axis Properties
Web Intelligence Query ⤒
Text File Data Source
In Web Intelligence DHTML, you can use a text file (TXT or CSV) that was previously uploaded in the CMS repository as a data source (request 129303). This support is similar to the Excel file support.
When creating a document or adding a new data source, you have the option to select a text file.
Create a Document Dialog Box
You can select the text file in the CMS repository and define the parameters to interpret the text file (data separator, text delimiter…)
Text File Interpretation Parameters
Once the file is open, you can select the objects from the text file to retrieve in the Query Panel. Click Refresh or Run Query to close the Query Panel and retrieve the dataset to the document.
Text File Query Panel
Refreshable Option
You can select the queries you want to be refreshed or not when the document is refreshed (request 106185).
This can typically be useful for documents based on multiple queries some of which retrieve data that does not evolve very often (warehouse geographical data, list of products). You can refresh these queries a first time to fill the Web Intelligence micro-cube, and then disable them for the next refresh actions. These queries will not refresh, but their datasets will be retrieved from the micro-cube containing the values of first refresh.
This option was already available for Excel data sources; it is now also available for universes (UNV and UNX), text files, Free-Hand SQL, SAP BW Direct Access and SAP HANA Direct Access data providers.
You can disable the query refresh in Design mode by unselecting the Refreshable checkbox of the Query Properties dialog box.
Refreshable Options in Universe Query Panel Properties
When this option is not selected, you can no longer preview the dataset in the Query Panel.
In the formula language, the QuerySummary method has been updated to return this option’s value.

QuerySummary Result
Web Intelligence OpenDoc URL ⤒
The Web Intelligence Opendoc URL was optimized to ease the integration of Web Intelligence content in other interfaces or portals.
Excel and PDF Format
In addition to the sOutputFormat=P option, the opendoc URL now supports the sOutputFormat=E option to export a Web Intelligence document as an Excel file (request 102141).
These two options are also supported in Web Intelligence Interactive Viewer (request 206701). If you retrieve your document as PDF or Excel via the sViewer=fiori option, a window opens while the output files are downloaded to your local folder. If the document requires you to answer a few prompts, they are also displayed in this window.
Downloading Excel Through OpenDoc in Web Intelligence Interactive Viewer
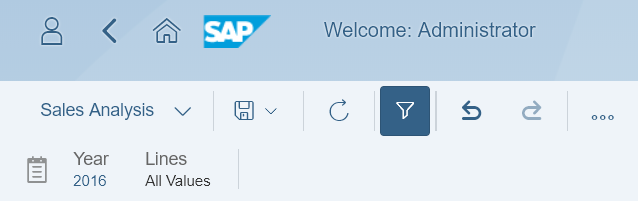
Simplified Mode
We added the option sReportMode=Light so that a document can be opened in a simplified interface that contains only the selected document or report. This mode is supported for Web Intelligence DHTML, Java Applet and Interactive Viewer.
In Web Intelligence DHTML client and the Java applet, the side panel and the toolbars are not displayed.
OpenDoc in DHTML and Simplified Mode
In Web Intelligence Interactive Viewer, the toolbar and the Web Intelligence side panel are not displayed. You can only access the fading toolbar and the report selector.
OpenDoc in Interactive Viewer and Simplified Mode
When you open a document with the sViewer=fiori option, it is displayed full screen without the BI Launch Pad header. If you also use the browser’s full screen capability (for example with F11 on Chrome) and the previously described Auto-Refresh mode, you can optimize the document display through an auto-refresh on a large screen.
SAP HANA and SAP BW Parameters
SAP BW and SAP HANA Parameters support in the opendoc URL was released in SAP BI 4.2 SP5 through a hot fix. They are also supported in SAP BI 4.2 SP6. The parameters and the values are passed through the lsM option. This option can take most SAP BW or SAP HANA operators, as described in the table below.
| Syntax | Operator | Example |
| Arg1 | Equal | &lsMSelectKey=12 |
| !Arg1 | Not Equal | &lsMSelectKey=!I12 |
| Arg1 - Arg2 | Interval Between | &lsMSelectKey=12 – 18 |
| !Arg1 - Arg2 | Not Between | &lsMSelectKey=!12 – 18 |
| >Arg | Greater than | &lsMSelectKey=>12 |
| <Arg | Lower than | &lsMSelectKey=<12 |
| >=Arg | Greater or equal to | &lsMSelectKey=>=12 |
| <=Arg | Lower or equal to | &lsMSelectKey=<=12 |
Operators can be combined with the ; character to propose complex conditions. For example: &lsMprompt=>12;<20;!15;30
Web Intelligence Server ⤒
The same Web Intelligence document can be refreshed in the same browser in a session opened by the same user in BI Launch Pad and via OpenDoc. The session is no longer shared; which prevents errors in case of concurrent actions.
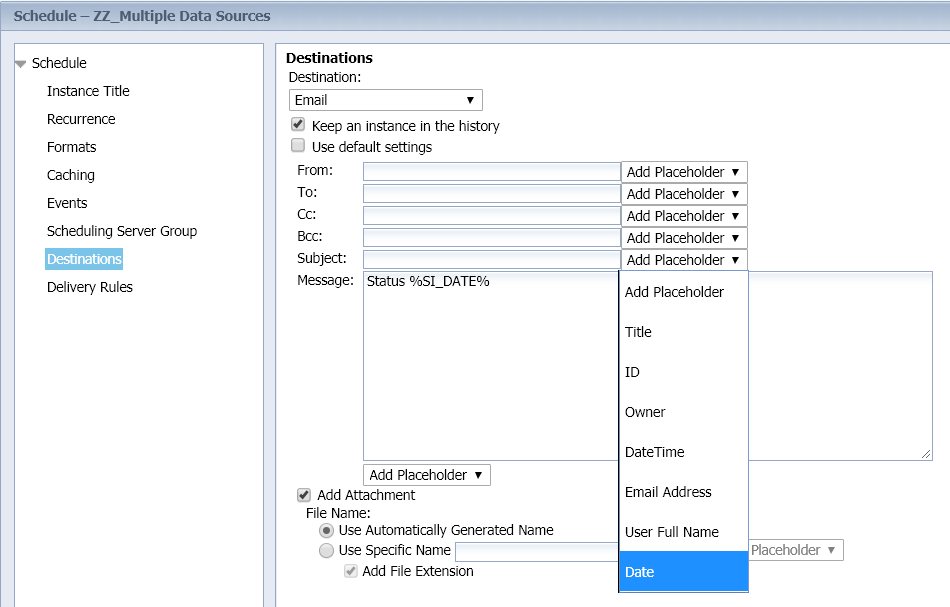
When scheduling or publishing a document, the Date placeholder (%SI_DATE%) can be used instead of the DateTime placeholder, so as to return only the date.
Date Placeholder in Schedule
Universe Stored Procedure ⤒
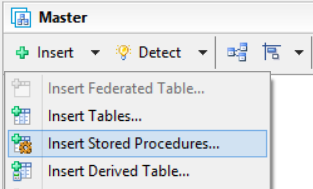
In the Information Design Tool, you can create a universe based on stored procedures (request 101311) or convert a universe created in the Universe Design Tool (UNV) and based on a stored procedure.
Insert Menu
Selecting Stored Procedure
Answering Stored Procedure Parameters
The stored procedure result set is exposed as one or more tables in the data foundation. You can then create a business layer on top of this data foundation and publish it as a universe in the CMS repository. Such universes can be secured by Business Security Profiles only, and not by Data Security Profiles.
The refresh structure does not yet support stored procedure tables.
As for the Universe Design Tool, there are the following limitations:
- It is not possible to mix database tables with stored procedure tables.
- It is possible to add several stored procedure tables in the same data foundation but not to create joins between them.
- It is not possible to edit the SQL bindings of business objects, or to create new ones (only drag and drop is allowed)
Information Design Tool Usability Enhancements ⤒
Several enhancements have been performed in the Information Design Tool to ease the designer’s work.
Refresh Structure for Selected Tables
In the Universe Design Tool, it is possible to refresh only the structure of a list of selected tables. This capability is now offered in Information Design Tool. This avoids refreshing the whole data foundation, when updates on only some tables are required (request 140548).
From the main menu bar, select Actions, then Refresh Structure. In the Refresh Data Foundation Structure dialog box, the Selected Tables pane lists all database and derived tables (at this time, stored procedures cannot be refreshed).
If some tables are selected in the data foundation, only these tables are selected in this list; otherwise all tables are selected.
You can also open this dialog box by picking and right-clicking some tables in the data foundation and selecting the Refresh Structure command. Only the selected tables are selected in the Selected Tables pane.
Selected Tables for Refresh Structure
Select the tables to refresh, then click Next to enter the other options to refresh the data foundation structure.
Align Data Foundation Tables
You can perfectly align selected tables in your data foundation (request 127304). By right-clicking them, you now have access to the following commands in the Arrange Tables sub-menu:
- Align Left: to align their left edges with the one located at the furthest left.
- Align Center: to horizontally center them at the center of these tables’ furthest right and left edges.
- Align Right: to align all selected tables’ right edges with all the one located at the furthest right.
- Align Top: to align all selected tables’ top edges with all the one located at the furthest top.
- Align Middle: to vertically center all selected tables at the center of these tables’ furthest top and bottom edges.
- Align Bottom: to align all selected tables’ bottom edges with all the one located at the furthest bottom.
- Distribute Horizontally: to horizontally move them so they have an equal horizontal distance from one another. The tables at the furthest left and right sides are used as limits and are not moved.
- Distribute Vertically: to vertically move them so they have an equal vertical distance from one another. The tables at the furthest top and bottom sides are used as limits and are not moved.
- Set Width to Max: to set all selected tables’ width to the largest one.
- Set Width to Min: to set all selected tables’ width to the smallest one.
These commands can also be found in the data foundation toolbar.
Align Tables Commands
Toggle Data Foundation Tables Display
As in the Universe Design Tool, you can use the Ctrl+T shortcut to change all selected tables display from Collapsed to Joins Only to Expanded (request 109987). If no table is selected, then this applies to all tables in the data foundation. This command can also be selected from the right-click menu.
Toggle Display Command in Tables Contextual Menu
Column Contextual Menu
In the data foundation, when right-clicking a column on a table, the contextual menu has been extended and now includes the Create calculated column command (request 133372). There is no need to explicitly right-click the table header to reach this command.
Other commands that are not supported for columns (Check Integrity, Cut, Copy, Paste) have been removed from this contextual menu.
Column Contextual Menu
Duplicate Joins for Alias Tables
When you create alias table(s), you can select the Duplicate Joins checkbox in the Insert Alias Tables to create the same joins for the alias table(s) as for the source table(s).
Duplicate Joins in Insert Alias Tables
Manage Data Foundation Views
To simplify the management of data foundations containing many views (request 204025), there are new commands on the right-click menu:
- Go to: to go to the view selected in the sub-menu;
- Duplicate: to copy and paste the selected view in one click instead of two clicks;
- Insert View: to insert a view after the selected view.
Data Foundation View’s Contextual Menu
When the data foundation view is displayed for reading purposes in the business layer, the contextual menu only displays the command to go to a specific view.
Data Foundation View’s Contextual Menu in Business Layer Editor
Improve Extra Tables Management
Several behaviors in the object’s extra tables implementation have been reviewed and corrected:
- When the SELECT or WHERE clauses in the object’s definition are modified, extra tables that have been explicitly added are kept.
- A find and replace on the extra table does not rename the table in the data foundation any longer.
- When a universe created in the Universe Design Tool (UNV) is converted, the objects’ implicit extra tables are kept.
Filtering Objects in Data Foundation and Business Layer Editors
In the data foundation editor, you can click the Filters icon in the toolbar to open a non-modal dialog box where you can filter the tables displayed in the data foundation side panel. You can filter these tables by:
- Their names, by typing a text string in the Name text field.
- Their type (request 135609), by selecting the corresponding checkboxes in the Table
- By selecting the checkboxes in the Table with section (whether they have joins, filters, calculated columns or input controls).
- The data foundations (core or derived) they are coming from in case of a linked data foundation.
The number of filters you have selected is displayed in the toolbar so you can see at a glance that the list of tables is filtered.
Data Foundation Filters Dialog Box
Likewise, you can filter the business layer objects by clicking the Filters button in the business layer toolbar. The objects in the business layer can be filtered by:
- Their names, by typing a text string in the Name text field.
- Their type (dimension, measure, hierarchy…), through the checkboxes in the Type
- Their data type (string/long text, numeric, date/date-time, Boolean, Blob), through the checkboxes in the Data Type
- Their status (active, hidden, deprecated), through the checkboxes in the Status
- Their access level (public, controlled, restricted, confidential, private), through the checkboxes in the Security
- The business layer (core or derived) they are coming from in case of a linked business layer.
Business Layer Filters Dialog Box
Improve Incompatible Objects Management
The Aggregate Navigation dialog box in which you define incompatible objects has been enhanced as follows:
- You can filter the list of tables by clicking the Filters icon on top of the Data Foundation Tables This opens a non-modal dialog box that is similar to the new one in the data foundation editor and which we described previously. Tables can be filtered by name, type, or by having compatible objects associated to it or not.
- If a table has incompatible associated objects, their number is displayed in parenthesis, after the table name.
- You can filter the list of business layer objects by clicking the Filters icon on top of the Associated Incompatible Objects This opens a non-modal dialog box that is similar to the new one in the business layer editor and which we described previously. Objects can be filtered by name, type, or by being compatible or not with the selected table.
Aggregate Navigation Dialog Box
Find and Replace
The Find / Replace dialog box has been improved:
- As in the Universe Design Tool, new options allow you to select where the string pattern is searched (request 132795😞
- in the object’s name
- in the object’s description
- in the object’s scripts or other objects used to define it
- In the data foundation, the string pattern is searched in derived tables, alias tables, contexts, parameters (aka prompts) and lists of values (request 104695), in addition to tables and joins.
- In the business layer, the string pattern is searched in navigation paths, parameters (aka prompts) and lists of values (request 104695) in addition to objects and folders.
- Double-clicking a line in the result list selects this object in the data foundation or business layer editor. You may click the Previous and Next buttons to move to the previous or next line and select the corresponding object.
When you replace a table name used in an object definition, it is also replaced in the Tables list (request 130697).
Find / Replace Dialog Box
Derived Tables Support in LOV Based on SQL
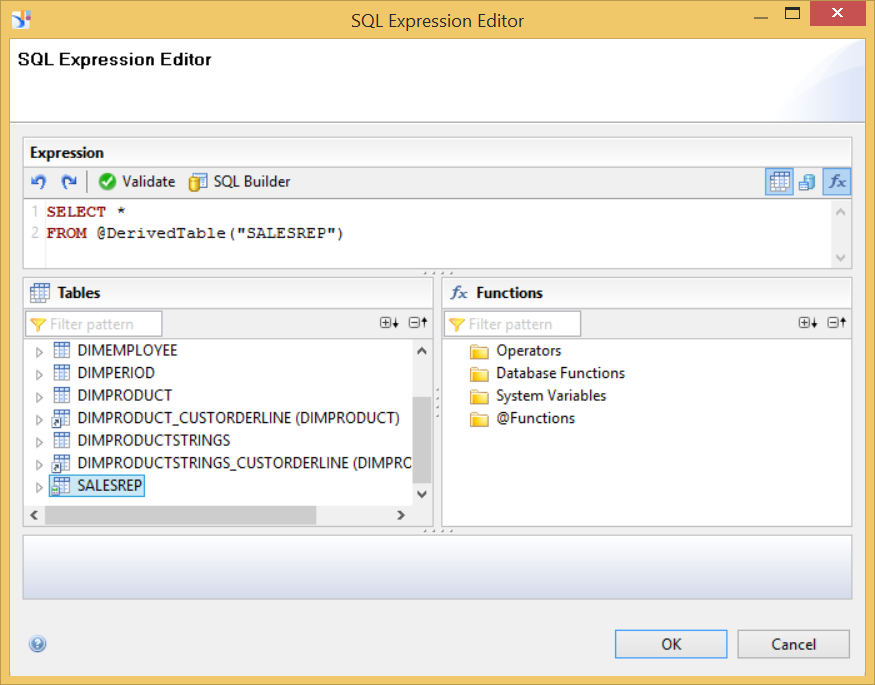
Since SAP BI 4.2 SP5, it is possible to use derived tables when creating a list of SQL-based values (request 141699). Such derived tables must be referenced through the method @DerivedTable.
In SAP BI 4.2 SP6, this list of derived tables is displayed in the SQL Expression Editor used to write this SQL. When you drag and drop this table, the method is automatically added to the SQL.
SQL Expression Dialog Box for List of Values
Improve Static List of Values Panel
To improve the usability of the Static List of Values panel, a new column is added in front of the table. This column contains the row number. When creating a new static list of values, there is by default one column (named Column 1) and one row. When adding a new row, cells of type String now contain the empty string.
New Static List of Values
Selecting columns and rows has been made easier:
- You can select a column by clicking its header. The column and its cells are highlighted. You can use the arrow buttons to move the column on the left or on the right (request 133413).
- You can select one or several row(s) by clicking the rows’ numbers. Selected row(s) and corresponding cells are highlighted.
- Click a cell to modify its content. The corresponding row and column is no longer selected.
Selected Column
Selected Rows
Editing a Cell’s Value
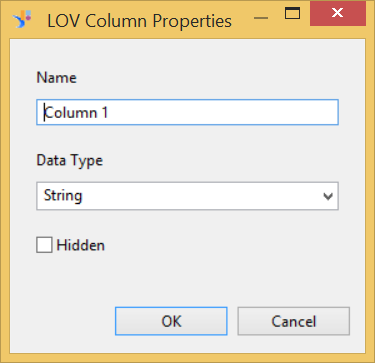
It is still possible to double-click a column header to open the LOV Column Properties dialog box to set its name, its data type and whether it should be hidden or not.
LOV Column Properties Dialog Box
The Detect button has been removed since it is useless for a static list of values.
Duplicate Business Layer Objects
In the business layer, you can right-click an object or a folder and select the Duplicate command to duplicate the selected object or folder. This can be used as a shortcut for the combination of the two commands Copy and Paste.
Duplicate Command
Search Repository Resources
In the Repository Resources toolbar, you can click the Search icon to open the Search in CMS dialog box. In the Searching String, you may enter a text string and click Search to find the resources (connection, universes or BI Sets) in the CMS repository that match this string (request 106208). This search is fast since it leverages the BI Platform search and its index.
The results are displayed in a non-modal dialog box. You may double-click a result to move the focus on this resource in the Repository Resources pane.
Search Repository Resources
Universe Details in Repository Resources
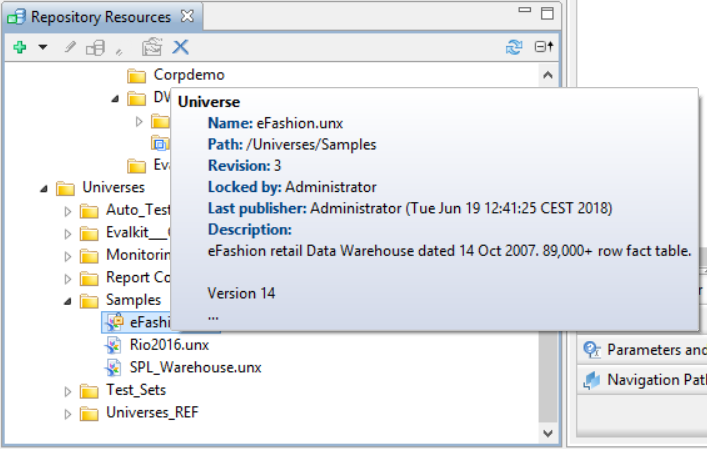
When you hover with your mouse over a universe in the Repository Resources panel, a tooltip opens providing additional details:
- the universe name, path, revision and description (if any)
- the user who locked this universe (possible since SAP BI 4.2 SP5)
- the date when the universe was last published
Universe Details
Creating Project When Retrieving Universe
When you retrieve a universe, you can click the New Project button in the Select Project dialog box to create a local project.
No need to close the Select Project dialog box, create your project and re-open the Select Project dialog box.
Select a Local Project
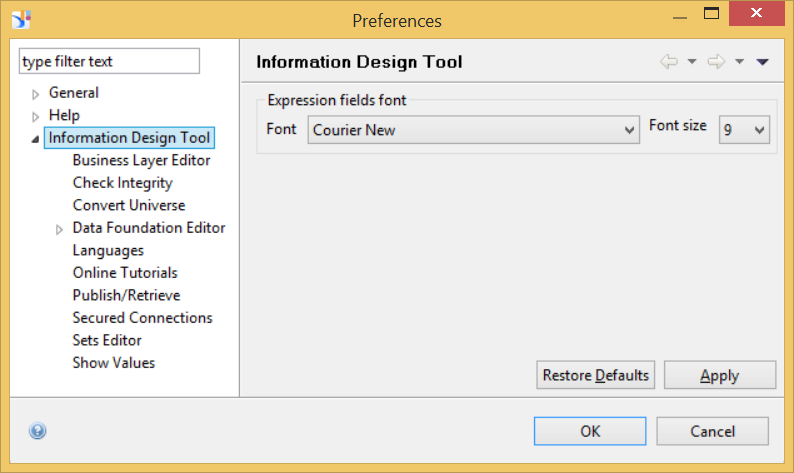
Information Design Tool Preferences
In Preferences > Information Design Tool, you can select the font used in script editors. This can be used to select monospace font, such as Courier and to better identify space characters in SQL scripts.
Font Preference
SQL scripts are used for example in Data Security Profiles, SQL list of values or object definitions.
Courier Font in SQL Editor
Two options introduced in previous support packages are now enabled by default:
- Publish/Retrieve > Retrieve options > Prefix folder with Universe name. With this option, introduced in SAP BI 4.2 SP5, universes are retrieved locally in a folder the name of which is <universe_name>_<datestamp>.
- Data Foundation Editor > Appearance > Select last edited View on editor startup. When a data foundation is opened, it displays the view that is opened when the data foundation was saved. No need to open the default Master view, which may take long if it contains a large number of tables if the Summary tab is not displayed.
Data Foundation Preferences
Data Sources Supported by Connection Server ⤒
The following data sources are now supported by Connection Server / universes:
- SAP HANA 2.0 SP2;
- SQL Server 2017;
- SQL Server Azure;
- IQ 16.1;
- Teradata 16.x;
- Hive 2.3.
The complete list of supported data sources can be found in the Product Availability Matrix.
BI Sets ⤒
Manage Set Containers
In SAP BI 4.2 SP6, the Database tab of the Set Containers Management dialog box displays the tables used to store materialized sets. It especially displays calendars and periods that are now also materialized in the database along with the sets. All tables are now created after the first publish, so a missing table is now considered to be a system inconsistency during the startup check.
Database Tab in Set Containers Management
Visual Data Steps
When defining a set based on a Visual Data step, you are no longer limited to the objects coming from the same table as the subject. You may use any objects of the universe, except the ones for which an incompatibility with the table containing the subject was defined.
Visual Data Stepg
Query Panel Steps
When defining a set based on Query Panel steps, you may start your step with all your subject’s members. You do not need to add a filter in the query, as you had to in previous releases.
You may also use custom SQL in your query panel step instead of using the SQL that is automatically generated through the universe:
- In the Query Panel toolbar, click the View script button to open the Query Script Viewer dialog box.
- Click the Use custom query script radio-button and in the text field, enter your new SQL script to generate the set.
Query Script Viewer
Sets Data Explorer
Right-click a set that has been materialized and click:
- the Show Materialization Script command to open the Materialization SQL dialog box. This dialog box contains the SQL scripts used to materialize the sets in the database.
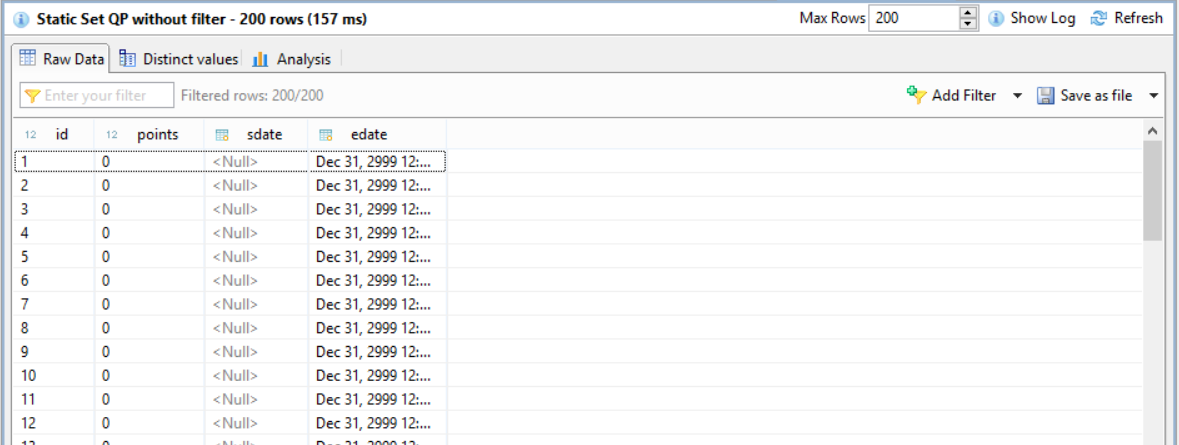
- the Show Set Values command to open and analyze the dataset that has been materialized for this set.
View Materialization SQL
Show Set Values
Scoring
Scoring a set allows you to differentiate its members instead of considering them as identical. For example, in your set of premium customers, you may identify sub-groups defined on a criterion the value of which is linked to this score.
In the Information Design Tool, a new field named Score is available in each step used to define the set (both static and temporal): visual data step, query panel step and sets-on-sets step. In this field, you may define an integer: positive or negative or null (by default). With temporal sets, scoring is only meaningful for the last built period.
Each set member is assigned a score, which is the sum of all scores of the steps defining this member.
Scores are saved during materialization in a new column of the table where the sets are saved. At this time, the only way to get this score is to directly access the column value or create new universe objects to query it.
Filtering Objects in Set Editors
The filters in set editor toolbar takes advantages of the same look and feel than the filters in the data foundation and business layer editors. Identically, when you define sets on sets, you can now use the Filters non-modal dialog box to filters the displayed sets.
Sets on Sets Filters Dialog Box
New Supported Data Sources
BI Sets are now supported for the following databases:
- Sybase IQ;
- Sybase SQL Anywhere;
- IBM DB2;
- Teradata;
- HP Vertica.
SAP Live Office ⤒
In SAP BI 4.2 SP6, SAP Live Office leverages Web Intelligence comments:
- In the Web Intelligence viewer, icons are displayed on the cells, tables or charts in case they have associated comments. Hovering over the icon with the mouse opens a tooltip with the corresponding comment.
- If you run Live Office in Microsoft Excel, click the Import comments checkbox to import comments into the Excel spreadsheet. Only comments on tables and free cells are imported. Comments on sections, cells in a table or chart are not imported.
In the Web Intelligence viewer, you may click the Import cells and tables as pictures checkbox to import selected report elements as pictures. This can be used to keep a report element formatting and keep both its text and background picture. Without activating this checkbox, if the report element contains both text and a background picture, then only the text is imported.
In the query panel, different icons are used to distinguish universes created with the Universe Design Tool and the ones created with the Information Design Tool. The query panel header has a maximize icon to display it full screen.
To improve the user interface performance, the number of calls to the server was reduced. The list of values is no longer displayed when you open the Prompts dialog box, i.e. you must explicitly click Refresh to get this list of values.
Visual Difference ⤒
In the CMC, the Visual Difference tool has been rewritten to use the SAP FIORI HTML5 graphical library and replace Flash. It was extended to also support Web Intelligence documents’ metadata (request 106360).
Visual Difference can be used to find the following differences in Web Intelligence documents:
- Document property (name, CUID, description…);
- Report names;
- Data providers;
- Query definitions;
- Variables definitions.
Once Visual Difference is started in the CMC, click the New Comparison button to select the objects to compare.
The New comparison wizard opens. In the Select System pane, you can define the repository containing the source and target content to compare. In the dropdown menu, you can select the Use Current System choice to use the current repository to which you are connected.
You can click the Use same system as target checkbox to select the source and target objects in the same system. Click Next.
New Comparison: Select System
In the Objects Selection pane, select the objects to compare in the Reference and Target tree list. You may also select folders to compare folder content. Click Next.
New Comparison: Objects Selection
In the Summary pane, you may change the name for this comparison job to better identify it and re-use it later. Click Compare to create the comparison job.
Once the job is complete, click > to see the comparison results or select the checkbox and click View differences to view the result details.
Differences Between Reports
The comparison is processed and the results are progressively displayed . The differences are listed by categories in the different tabs.
- Metatadata: to display the difference in InfoObjects’ properties;
- Document Info: to display the difference in Web Intelligence documents;
- Reports: to display the difference in document reports;
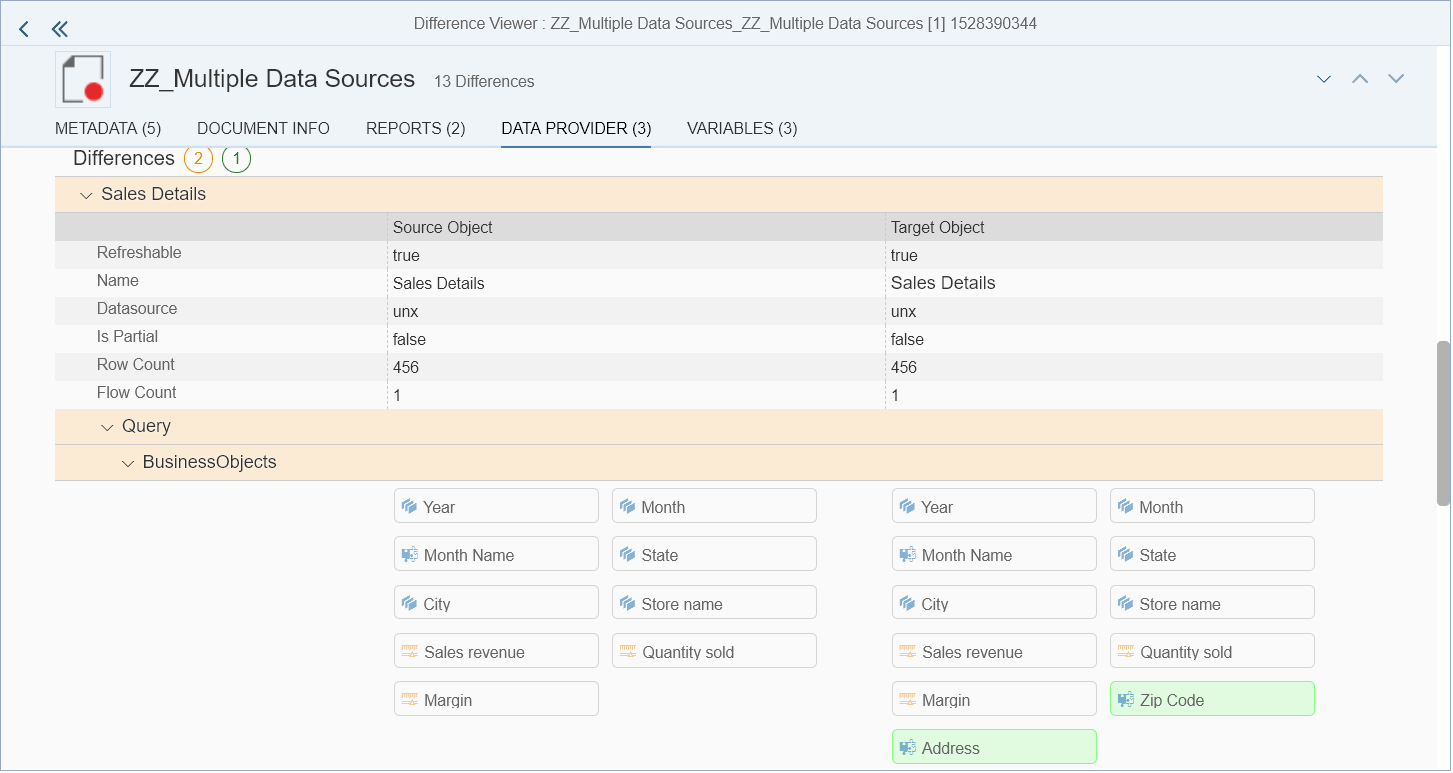
- Data Provider: to display the difference in queries properties and the objects of these queries;
- Variables: to display the difference between the variables defined in the documents.
Differences Between Data Providers
Differences Between Variables
Lateron you can relaunch the same comparison job by selecting it in the Visual Difference home page and click the Rerun button.
BI Launch Pad ⤒
As an administrator, you can disable the GDPR message that displays for every user in BI Launch Pad and the CMC. This capability has been released as part of an SAP BI 4.2 SP5 patch (see KBA 2604727) and it is now also available in SAP BI 4.2 SP6.
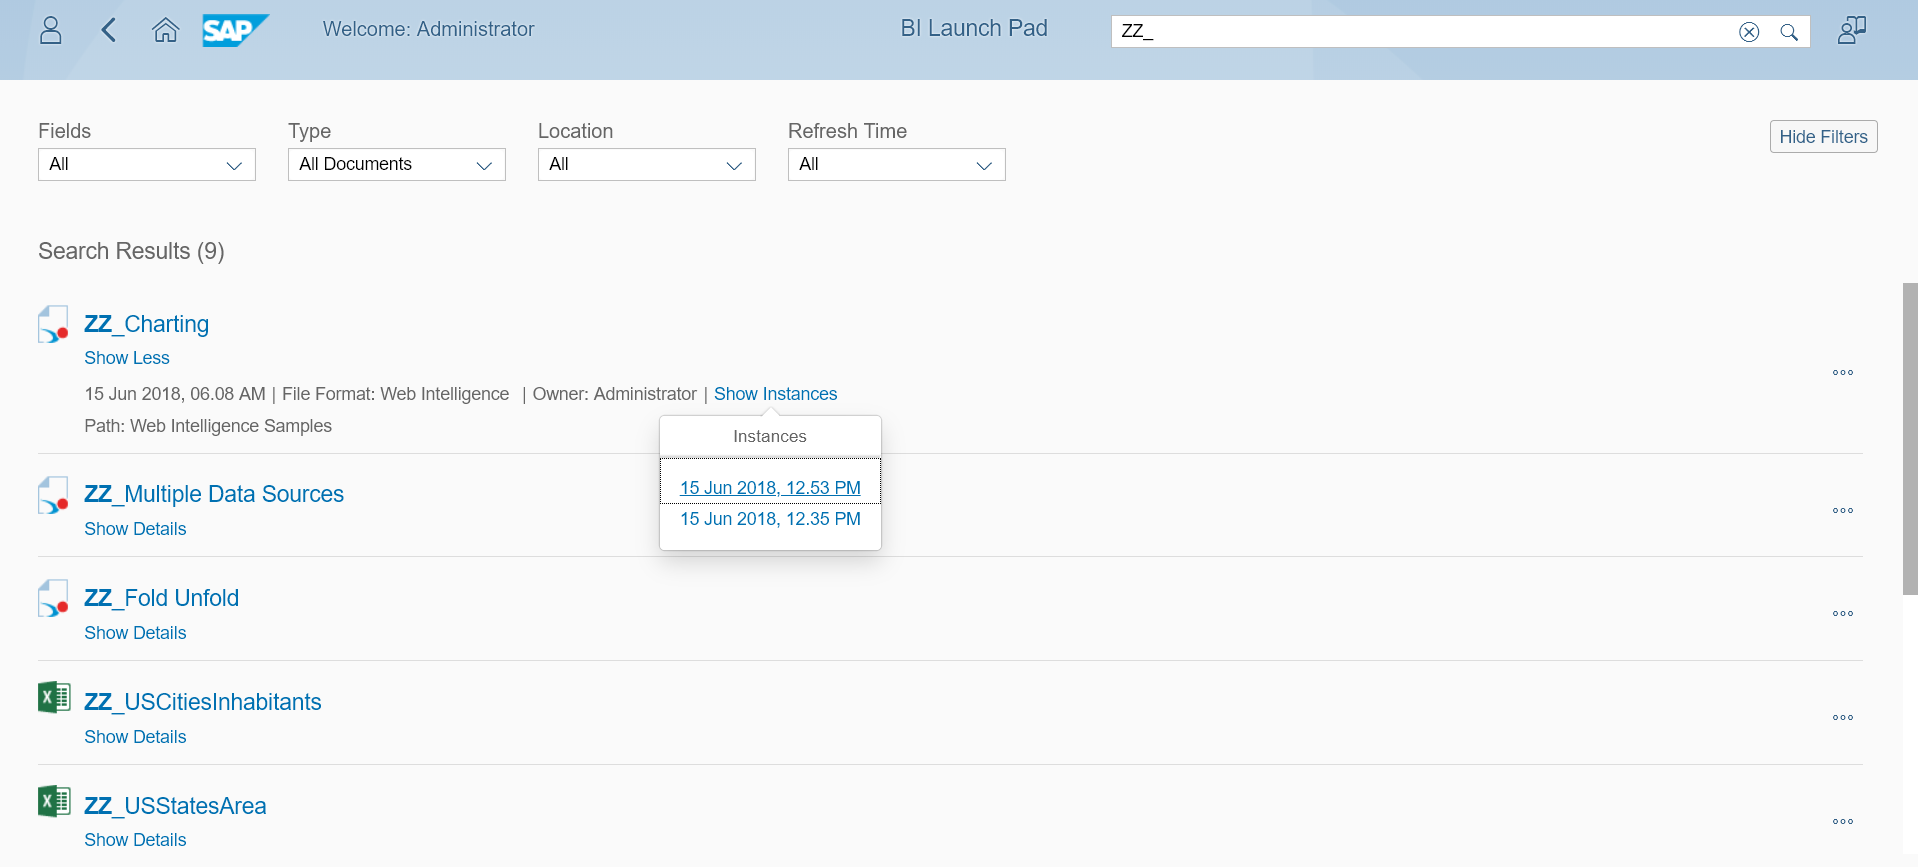
In the new BI Launch Pad, the Search has also been improved:
- The path of result objects in the CMS repository is displayed;
- Search results are displayed in a compacted list. You may click Show Details to disclose additional details;
- From the result list, you can list and open object instances, if any.
Search Results in New BI Launch Pad
Labels:
36 Comments
You must be a registered user to add a comment. If you've already registered, sign in. Otherwise, register and sign in.
Labels in this area
-
ABAP CDS Views - CDC (Change Data Capture)
2 -
AI
1 -
Analyze Workload Data
1 -
BTP
1 -
Business and IT Integration
2 -
Business application stu
1 -
Business Technology Platform
1 -
Business Trends
1,661 -
Business Trends
88 -
CAP
1 -
cf
1 -
Cloud Foundry
1 -
Confluent
1 -
Customer COE Basics and Fundamentals
1 -
Customer COE Latest and Greatest
3 -
Customer Data Browser app
1 -
Data Analysis Tool
1 -
data migration
1 -
data transfer
1 -
Datasphere
2 -
Event Information
1,400 -
Event Information
65 -
Expert
1 -
Expert Insights
178 -
Expert Insights
280 -
General
1 -
Google cloud
1 -
Google Next'24
1 -
Kafka
1 -
Life at SAP
784 -
Life at SAP
11 -
Migrate your Data App
1 -
MTA
1 -
Network Performance Analysis
1 -
NodeJS
1 -
PDF
1 -
POC
1 -
Product Updates
4,577 -
Product Updates
330 -
Replication Flow
1 -
RisewithSAP
1 -
SAP BTP
1 -
SAP BTP Cloud Foundry
1 -
SAP Cloud ALM
1 -
SAP Cloud Application Programming Model
1 -
SAP Datasphere
2 -
SAP S4HANA Cloud
1 -
SAP S4HANA Migration Cockpit
1 -
Technology Updates
6,886 -
Technology Updates
408 -
Workload Fluctuations
1
Related Content
- Unify your process and task mining insights: How SAP UEM by Knoa integrates with SAP Signavio in Technology Blogs by SAP
- 10+ ways to reshape your SAP landscape with SAP BTP - Blog 4 Interview in Technology Blogs by SAP
- 10+ ways to reshape your SAP landscape with SAP Business Technology Platform – Blog 4 in Technology Blogs by SAP
- Experiencing Embeddings with the First Baby Step in Technology Blogs by Members
- Harnessing the Power of SAP HANA Cloud Vector Engine for Context-Aware LLM Architecture in Technology Blogs by SAP
Top kudoed authors
| User | Count |
|---|---|
| 13 | |
| 10 | |
| 10 | |
| 9 | |
| 7 | |
| 6 | |
| 5 | |
| 5 | |
| 5 | |
| 4 |