

- SAP Community
- Products and Technology
- Technology
- Technology Blogs by SAP
- What’s New in SAP Analytics Cloud and SAP Digital ...
Technology Blogs by SAP
Learn how to extend and personalize SAP applications. Follow the SAP technology blog for insights into SAP BTP, ABAP, SAP Analytics Cloud, SAP HANA, and more.
Turn on suggestions
Auto-suggest helps you quickly narrow down your search results by suggesting possible matches as you type.
Showing results for
Former Member
Options
- Subscribe to RSS Feed
- Mark as New
- Mark as Read
- Bookmark
- Subscribe
- Printer Friendly Page
- Report Inappropriate Content
06-12-2018
8:20 PM
This blog covers some of the latest new features and enhancements in SAP Analytics Cloud and SAP Digital Boardroom release 2018.10. Please note that the Analytics Cloud Help documentation is updated at the same time as the upgrade to this release, so the links here may not yet reflect what is described below until after the upgrade is complete.
SAP Analytics Cloud agent version required for data acquisition with this release:
For more information, see System Requirements and Technical Prerequisites.
Highlights of this release:
Please note that we have updated a few of the feature group names. Check out our product plan for more information!
Learn with our latest video tutorials
Starting this release, you can create private nodes and hide hierarchy nodes from authorized users. If a higher-level node is hidden, orphaned nodes are now listed as direct children of the root node.

During wrangling and modeling, you can define level-based hierarchies! These levels are properties of the dimension and this can be part of multiple hierarchies. If leaf nodes have ambiguous values, you have the option to generate unique ideas for the dimension.
Here’s an example: You can use this feature to distinguish the Vancouver in Canada from the Vancouver in the USA.
Furthermore, level-based hierarchies can be used in charts and explorer with a drilling or expand experience.

When updating data in a model, the scope of the replacement is defined by the combination of all the dimensions values in the source. With scope replace, you can define which dimensions will define the scope of the replacement.
Conditions defined in a BW BEx query are now supported with SAP Analytic Cloud chart and table visualizations. In addition, information about the conditions are now exposed as part of a visualization. This gives end users better insights into the data which are influenced by BEx conditions.
Level-based hierarchies are now supported for SAP Analytics Cloud data import models. These hierarchies can be defined as part of the data preparation/data modeling step for data import models. Easily leverage defined level based hierarchies within SAP Analytics Cloud chart and table visualizations.
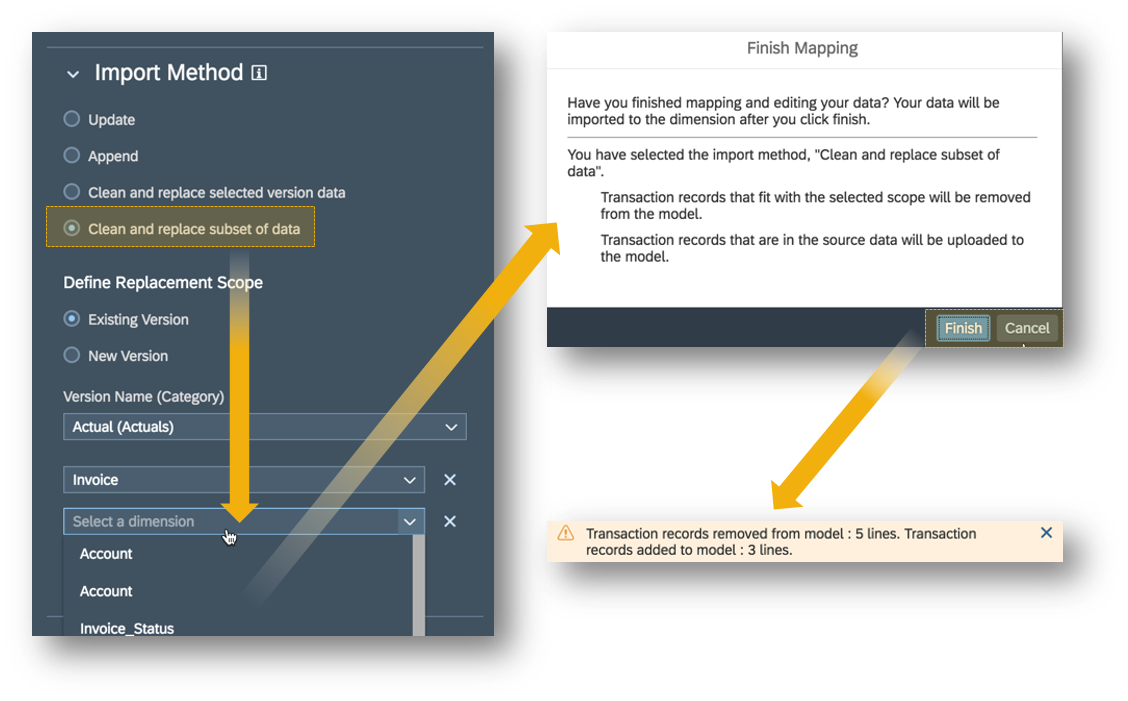
Also, administrators now have the option to update a subset of data with import models, using the concept of scope replacement for selected dimensions.
For more information, check out this blog post.

Find the best answers to your business questions! If your SAP Analytics Cloud subscription is through our partner, Amazon Web Services (AWS), you’ll be able to take advantage of our new Smart Predict capabilities.
Explore the opportunity to create and compare several versions of the same model, apply your model immediately on new data, and consume the generated predictions in your story. Smart Predict lets you create classification, regression and time series models directly. You can also debrief, understand, and fine-tune your model.
Check out the SAP Analytics Cloud help page to determine if your SAP Analytics Cloud tenant subscription is through AWS.

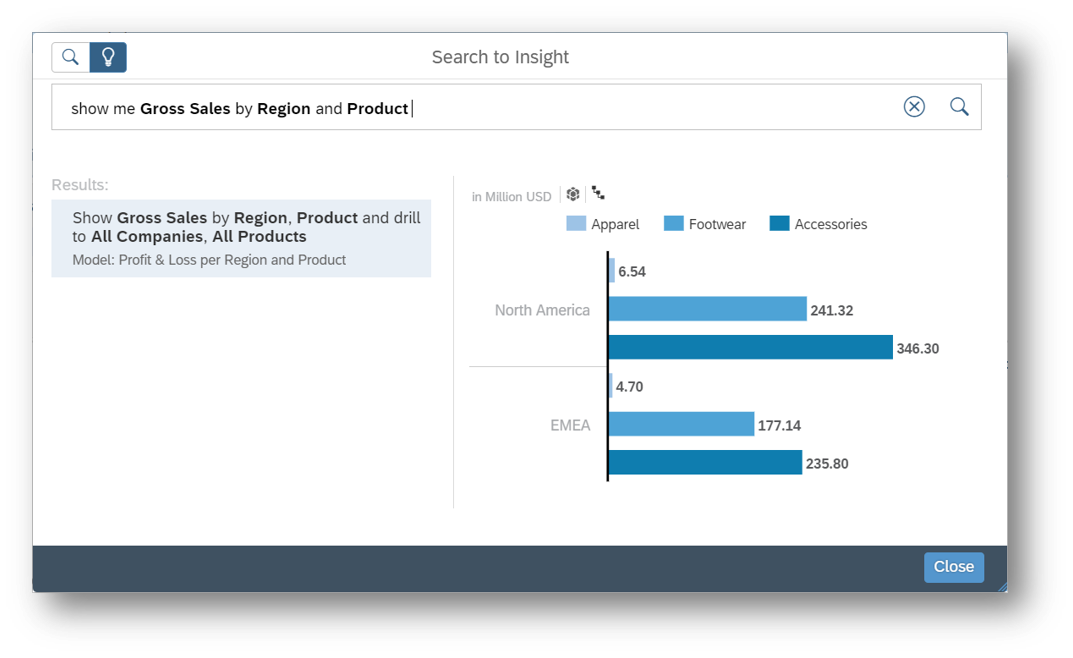
With our new natural language query capability, Search to Insight, you can now get the quick answers you need and seamlessly add them to your story!
For example, simply type or say, “Show me gross sales by region and product” and see this:
These improvements are perfect for Digital Boardroom designers who maintain a larger number of stories within a Boardroom. These enhancements allow designers to quickly find where in the Boardroom presentation a story is used, so that they can update their content as needed in a jiffy!

SAC Administrators can save time and easily configure the HANA Cloud Connector required for data import scenarios. Customers are no longer required to open a SAP support ticket as part of the simplified configuration steps.
Directly enter the S-User account in the System > Administration > Datasource Configuration page. The system will then automatically assign the S-USER.

In some cases, an application may need an access token to act on behalf of itself rather than a user. For example, a service may provide a way for an application to update its own information or get information about the users of the app. In this case, the application will need a way to access a token for its own account, outside the context of any specific user. OAuth provides the client credentials grant type for this purpose.
With Client Credentials Grant a Non-Interactive Client (a CLI, daemon, or backend service, etc.), can directly ask the Authentication Server for an access token. The Authentication Server validates this information and returns an access token. In this case, the token represents the Non-Interactive Client itself instead of an end user. Then, the application can use the access token to call APIs on behalf of itself.
We’re excited to say that our mobile app now supports using MobileIron Cloud for setting iOS managed configuration capabilities!

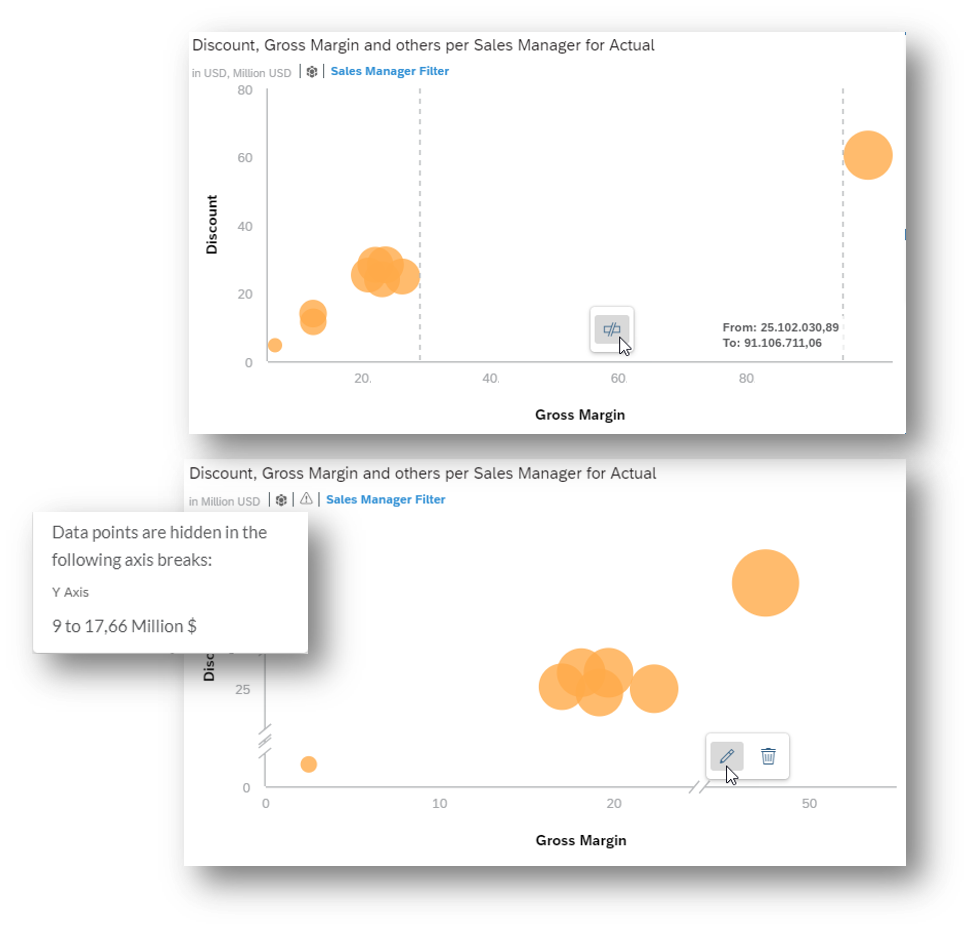
Optimize spacing for bubble and scatterplot charts! Now, you can add axis breaks on the x-axis and y-axis. With this feature, the line indicator will show users exactly where the axis breaks will be applied. Users will be able to apply more than one axis break, be able to edit and delete existing breaks, and hide data points by applying axis breaks in which an information message will be shown.
Bonus: this is also available in view and edit mode!
For all the story designers out there, you’ll be able to show choropleth layers for custom shapes in your geo map! These shapes can be hierarchal or flat and you can also create others layers on top of the custom choropleth layer.
Check out the step-by-step guide here.
Please note: this is only available for live HANA for polygons with a maximum custom shape size of 8M characters.

Now, you can drill down to data points in a hierarchical choropleth layer in a geo map! You can also drill into missing shapes to see the underlying data.
Please note: no more than 20,000 data points can be shown at the data level.

Quickly export data from BW and S/4HANA live connections to CSV for both charts and tables! You can also disable the option to export in the modeler.

Additional resources:
Previous feature summary blogs:
**Legal disclaimer
SAP has no obligation to pursue any course of business outlined in this blog or any related presentation, or to develop or release any functionality mentioned therein. This blog, or any related presentation and SAP’s possible future developments, products and or platforms directions and functionality are all subject to change and may be changed by SAP at any time for any reason without notice. The information in this blog is not a commitment, promise or legal obligation to deliver any material, code, or functionality. This blog is provided without a warranty of any kind, either express or implied, including but not limited to, the implied warranties of merchantability, fitness for a particular purpose, or non-infringement. This blog is for informational purposes and may not be incorporated into a contract. SAP assumes no responsibility for errors or omissions in this document, except if such damages were caused by SAP’s willful misconduct or gross negligence.
All forward-looking statements are subject to various risks and uncertainties that could cause actual results to differ materially from expectations. Readers are cautioned not to place undue reliance on these forward-looking statements, and should not be relied upon in making purchasing decisions.
SAP Analytics Cloud agent version required for data acquisition with this release:
- Version 1.0.85 for SAP Business Warehouse (BW)
- Version 1.0.99 for SAP ERP / SQL databases
- Version 1.0.91 for SAP Universe (UNX)
- Version 1.0.75 for all other data source types
- Note: Although it is not required, you can upgrade to the new agent version 1.0.105, no matter what data acquisition type you use. Do this to take advantage of updates made to SAP Analytics Cloud agent.
For more information, see System Requirements and Technical Prerequisites.
Highlights of this release:
- Planning: View hierarchy nodes and hide private nodes
- Data Integration: Define level-based hierarchies on imported data
- Data Integration: Specify dimensions for scope replace during data imports
- Predictive: Smart Predict
- Smart Assist: Search to Insight
- Digital Boardroom: Story panel improvements
- Intelligent Enterprise: BW BEx conditions appear in chart and table header
- APIs: Simplified OAuth client authentication for API access
- APIs: Configure data acquisition via Cloud Connector without SAP support ticket
- Mobile: MobileIron Cloud support for managed configuration capabilities
- Data Visualizations: Axis break for bubble and scatter charts
- Data Visualizations: Custom choropleth layer in a geo map for live HANA
- Data Visualizations: Drill to data points and missing shapes in a geo map
- Data Visualizations: CSV download support for BW and S/4 HANA live connections
Please note that we have updated a few of the feature group names. Check out our product plan for more information!
Learn with our latest video tutorials
- Create a model from SuccessFactors Workforce Analytics
- Apply filters to a chart in a story
- Apply filters to a geo map in a story
- Full tutorial playlist >
Planning
View hierarchy nodes and hide private nodes
Starting this release, you can create private nodes and hide hierarchy nodes from authorized users. If a higher-level node is hidden, orphaned nodes are now listed as direct children of the root node.
Data Integration
Define level-based hierarchies on imported data
During wrangling and modeling, you can define level-based hierarchies! These levels are properties of the dimension and this can be part of multiple hierarchies. If leaf nodes have ambiguous values, you have the option to generate unique ideas for the dimension.
Here’s an example: You can use this feature to distinguish the Vancouver in Canada from the Vancouver in the USA.
Furthermore, level-based hierarchies can be used in charts and explorer with a drilling or expand experience.
Specify dimensions for replace scope during data imports
When updating data in a model, the scope of the replacement is defined by the combination of all the dimensions values in the source. With scope replace, you can define which dimensions will define the scope of the replacement.
Intelligent Enterprise
BW BEx conditions appear in chart and table header
Conditions defined in a BW BEx query are now supported with SAP Analytic Cloud chart and table visualizations. In addition, information about the conditions are now exposed as part of a visualization. This gives end users better insights into the data which are influenced by BEx conditions.
Level-based hierarchies are now supported for SAP Analytics Cloud data import models. These hierarchies can be defined as part of the data preparation/data modeling step for data import models. Easily leverage defined level based hierarchies within SAP Analytics Cloud chart and table visualizations.
Also, administrators now have the option to update a subset of data with import models, using the concept of scope replacement for selected dimensions.
For more information, check out this blog post.
Predictive
Smart Predict
Find the best answers to your business questions! If your SAP Analytics Cloud subscription is through our partner, Amazon Web Services (AWS), you’ll be able to take advantage of our new Smart Predict capabilities.
Explore the opportunity to create and compare several versions of the same model, apply your model immediately on new data, and consume the generated predictions in your story. Smart Predict lets you create classification, regression and time series models directly. You can also debrief, understand, and fine-tune your model.
Check out the SAP Analytics Cloud help page to determine if your SAP Analytics Cloud tenant subscription is through AWS.
Search to Insight
With our new natural language query capability, Search to Insight, you can now get the quick answers you need and seamlessly add them to your story!
For example, simply type or say, “Show me gross sales by region and product” and see this:
Digital Boardroom
Story panel improvements
These improvements are perfect for Digital Boardroom designers who maintain a larger number of stories within a Boardroom. These enhancements allow designers to quickly find where in the Boardroom presentation a story is used, so that they can update their content as needed in a jiffy!
APIs
Self-service HANA Cloud Connector configuration
SAC Administrators can save time and easily configure the HANA Cloud Connector required for data import scenarios. Customers are no longer required to open a SAP support ticket as part of the simplified configuration steps.
Directly enter the S-User account in the System > Administration > Datasource Configuration page. The system will then automatically assign the S-USER.
Infrastructure
Simplified OAuth client authentication for API access
In some cases, an application may need an access token to act on behalf of itself rather than a user. For example, a service may provide a way for an application to update its own information or get information about the users of the app. In this case, the application will need a way to access a token for its own account, outside the context of any specific user. OAuth provides the client credentials grant type for this purpose.
With Client Credentials Grant a Non-Interactive Client (a CLI, daemon, or backend service, etc.), can directly ask the Authentication Server for an access token. The Authentication Server validates this information and returns an access token. In this case, the token represents the Non-Interactive Client itself instead of an end user. Then, the application can use the access token to call APIs on behalf of itself.
Mobile
MobileIron cloud support for managed configuration capabilities
We’re excited to say that our mobile app now supports using MobileIron Cloud for setting iOS managed configuration capabilities!
Data Visualizations
Axis break for bubble and scatter charts
Optimize spacing for bubble and scatterplot charts! Now, you can add axis breaks on the x-axis and y-axis. With this feature, the line indicator will show users exactly where the axis breaks will be applied. Users will be able to apply more than one axis break, be able to edit and delete existing breaks, and hide data points by applying axis breaks in which an information message will be shown.
Bonus: this is also available in view and edit mode!
Custom Choropleth layer in a geo map for live HANA
For all the story designers out there, you’ll be able to show choropleth layers for custom shapes in your geo map! These shapes can be hierarchal or flat and you can also create others layers on top of the custom choropleth layer.
Check out the step-by-step guide here.
Please note: this is only available for live HANA for polygons with a maximum custom shape size of 8M characters.
Drill to data points and into missing shapes in a geo map
Now, you can drill down to data points in a hierarchical choropleth layer in a geo map! You can also drill into missing shapes to see the underlying data.
Please note: no more than 20,000 data points can be shown at the data level.
CSV download for BW and S/4HANA live connection
Quickly export data from BW and S/4HANA live connections to CSV for both charts and tables! You can also disable the option to export in the modeler.
Additional resources:
- Video tutorials
- Guided learning
- Events and recordings
- SAP Analytics Cloud help resources
- Official roadmap contains more info on future plans, subject to change.
Previous feature summary blogs:
- SAP Analytics Cloud release 2018.09
- SAP Analytics Cloud release 2018.08
- SAP Analytics Cloud release 2018.07
- SAP Analytics Cloud release 2018.06
- SAP Analytics Cloud release 2018.05
- SAP Analytics Cloud release 2018.04
- SAP Analytics Cloud release 2018.03
- SAP Analytics Cloud release 2018.02
- SAP Analytics Cloud release 2018.01
- More >
**Legal disclaimer
SAP has no obligation to pursue any course of business outlined in this blog or any related presentation, or to develop or release any functionality mentioned therein. This blog, or any related presentation and SAP’s possible future developments, products and or platforms directions and functionality are all subject to change and may be changed by SAP at any time for any reason without notice. The information in this blog is not a commitment, promise or legal obligation to deliver any material, code, or functionality. This blog is provided without a warranty of any kind, either express or implied, including but not limited to, the implied warranties of merchantability, fitness for a particular purpose, or non-infringement. This blog is for informational purposes and may not be incorporated into a contract. SAP assumes no responsibility for errors or omissions in this document, except if such damages were caused by SAP’s willful misconduct or gross negligence.
All forward-looking statements are subject to various risks and uncertainties that could cause actual results to differ materially from expectations. Readers are cautioned not to place undue reliance on these forward-looking statements, and should not be relied upon in making purchasing decisions.
- SAP Managed Tags:
- SAP Analytics Cloud
3 Comments
You must be a registered user to add a comment. If you've already registered, sign in. Otherwise, register and sign in.
Labels in this area
-
ABAP CDS Views - CDC (Change Data Capture)
2 -
AI
1 -
Analyze Workload Data
1 -
BTP
1 -
Business and IT Integration
2 -
Business application stu
1 -
Business Technology Platform
1 -
Business Trends
1,658 -
Business Trends
91 -
CAP
1 -
cf
1 -
Cloud Foundry
1 -
Confluent
1 -
Customer COE Basics and Fundamentals
1 -
Customer COE Latest and Greatest
3 -
Customer Data Browser app
1 -
Data Analysis Tool
1 -
data migration
1 -
data transfer
1 -
Datasphere
2 -
Event Information
1,400 -
Event Information
66 -
Expert
1 -
Expert Insights
177 -
Expert Insights
293 -
General
1 -
Google cloud
1 -
Google Next'24
1 -
Kafka
1 -
Life at SAP
780 -
Life at SAP
13 -
Migrate your Data App
1 -
MTA
1 -
Network Performance Analysis
1 -
NodeJS
1 -
PDF
1 -
POC
1 -
Product Updates
4,577 -
Product Updates
340 -
Replication Flow
1 -
RisewithSAP
1 -
SAP BTP
1 -
SAP BTP Cloud Foundry
1 -
SAP Cloud ALM
1 -
SAP Cloud Application Programming Model
1 -
SAP Datasphere
2 -
SAP S4HANA Cloud
1 -
SAP S4HANA Migration Cockpit
1 -
Technology Updates
6,873 -
Technology Updates
419 -
Workload Fluctuations
1
Related Content
- 体验更丝滑!SAP 分析云 2024.07 版功能更新 in Technology Blogs by SAP
- Top Picks: Innovations Highlights from SAP Business Technology Platform (Q1/2024) in Technology Blogs by SAP
- What’s New in SAP Analytics Cloud Release 2024.08 in Technology Blogs by SAP
- Sneak Peek in to SAP Analytics Cloud release for Q2 2024 in Technology Blogs by SAP
- Deep dive into Q4 2023, What’s New in SAP Cloud ALM for Implementation Blog Series in Technology Blogs by SAP
Top kudoed authors
| User | Count |
|---|---|
| 35 | |
| 25 | |
| 14 | |
| 7 | |
| 7 | |
| 6 | |
| 6 | |
| 5 | |
| 4 | |
| 4 |