
- SAP Community
- Products and Technology
- Technology
- Technology Blogs by SAP
- 5 Highlights included in SAP Analytics Cloud conte...
Technology Blogs by SAP
Learn how to extend and personalize SAP applications. Follow the SAP technology blog for insights into SAP BTP, ABAP, SAP Analytics Cloud, SAP HANA, and more.
Turn on suggestions
Auto-suggest helps you quickly narrow down your search results by suggesting possible matches as you type.
Showing results for
ChristineVirjee
Explorer
Options
- Subscribe to RSS Feed
- Mark as New
- Mark as Read
- Bookmark
- Subscribe
- Printer Friendly Page
- Report Inappropriate Content
04-27-2018
2:14 PM

5 Highlights included in SAP Analytics Cloud content
SAP Analytics Cloud content contains lots of ready-to-run examples featuring the latest technology and highlighting new features. This blogpost will introduce you to 5 highlights of SAP Analytics Cloud content, namely: what-if scenarios, geo maps, smart discovery, currency conversions and planning.
[Please note that this post is not updated anymore and information might be outdated. If you want to learn about the latest SAP business content, please check the community page here and the latest content blog posts here]
[Last updated: 27th of April 2018, SAP Analytics Cloud Version 2018.5.0]
1. What-if Scenarios using Calculation Input Controls
In SAP Analytics Cloud offers different options to realize what-if scenarios. One of them is to use a calculation input control. This functionality was implemented in the "SAP Chemicals: Digital Boardroom" for Market Analysis. If you do not have a boardroom license, you can simply go to the story "SAP Chemicals: Portfolio - Market Analysis".
Using the sliders on the left-hand side of the page, you can select a value for Your Company's Coatings Total Market Share. The total coatings market share is made up of the markets Automotive, Building & Construction and Industrial. When we switch the total market share for 2018 from 8% to 12%, we can see that two charts get affected: "Contribution Margin per Market" and "My Materials Market Share".
In "Contribution Margin per Market" we can see that the Average Coatings Share per Market increased from 2,7% to 4% and about half of the total market share (12%) comes from the Industrial Market (6%).
In "My Materials Market Share" we can see that the negative impact seen before, can be replaced with strong growth in the top 10 materials, especially for the top 3 materials.


2. Geo Maps
Geo maps were used in a variety of stories. Here is one example how they were used in SAP Environment, Health & Safety, for example in the story "SAP Environment, Health & Safety: Health & Safety - Incidents".
On the geo map you can see two layers which you can switch off and on. If we inspect only the Country layer, we can see that the number of fatalities have been especially high in plants in Brazil and India. Now, if we switch on the bubble layer, the size of the bubbles indicates the Number of Incidents and the bubble color the number of lost workdays. We can see that in plants in all regions the total number of incidents is relatively evenly distributed but the number of lost workdays is similar as the fatalities disproportionally higher in some plants - similar to the number of fatalities.


3. Smart Discovery
In other areas, Smart Discovery was used to gain more insights in the data we are working with. You can find an example in the story "SAP Finance: General - Financial Performance". Here, we ran a smart discovery to find out what influences Net Revenue.
The Smart Discovery shows us that Customer Group heavily influences Net Revenue but that there is something wrong with our Customer Segmentation as Group B customers have lesser influence than Group C.


4. Currency Conversions
There are some models in the SAP Analytics Cloud content that use currency conversion. Here, we will illustrate the example of the model SAP__TE_GEN_IM_EXPENSEENTRY and SAP__TE_GEN_IM_EXPENSEREPORT which is being used in the story SAP__TE_GEN_TRAVELEXPENSE.
Open the Preferences of the model to see how the currency conversion is applied. The currency conversion is based on the table SAP_ALL_CURRENCY.

You can find the currency conversion table by going in Browse > Currencies. With wave 2018.05 currency conversion rates can also be imported from Excel.

When importing data, currency codes are mapped to the Dimension Transaction Currency in SAP__TE_GEN_IM_EXPENSEENTRY and Currency in model SAP__TE_GEN_IM_EXPENSEREPORT. For more information on the mapping, please visit the SAP Analytics Cloud content documentation.
In the story SAP__TE_GEN_TRAVELEXPENSE currency conversion is being used in tables as well as charts. On the page Dynamic, you can use the chart details to convert the chart into different currencies.

On the page Entries per Report, the entries table shows amounts converted from Local Currency to Default currency.

5. Planning
A variety of the SAP Analytics Cloud content uses planning features, for example the SAP Travel and Expense or the SAP Human Resources - Salary Planning.
Notice that in order to edit planning models, a planning license is needed.
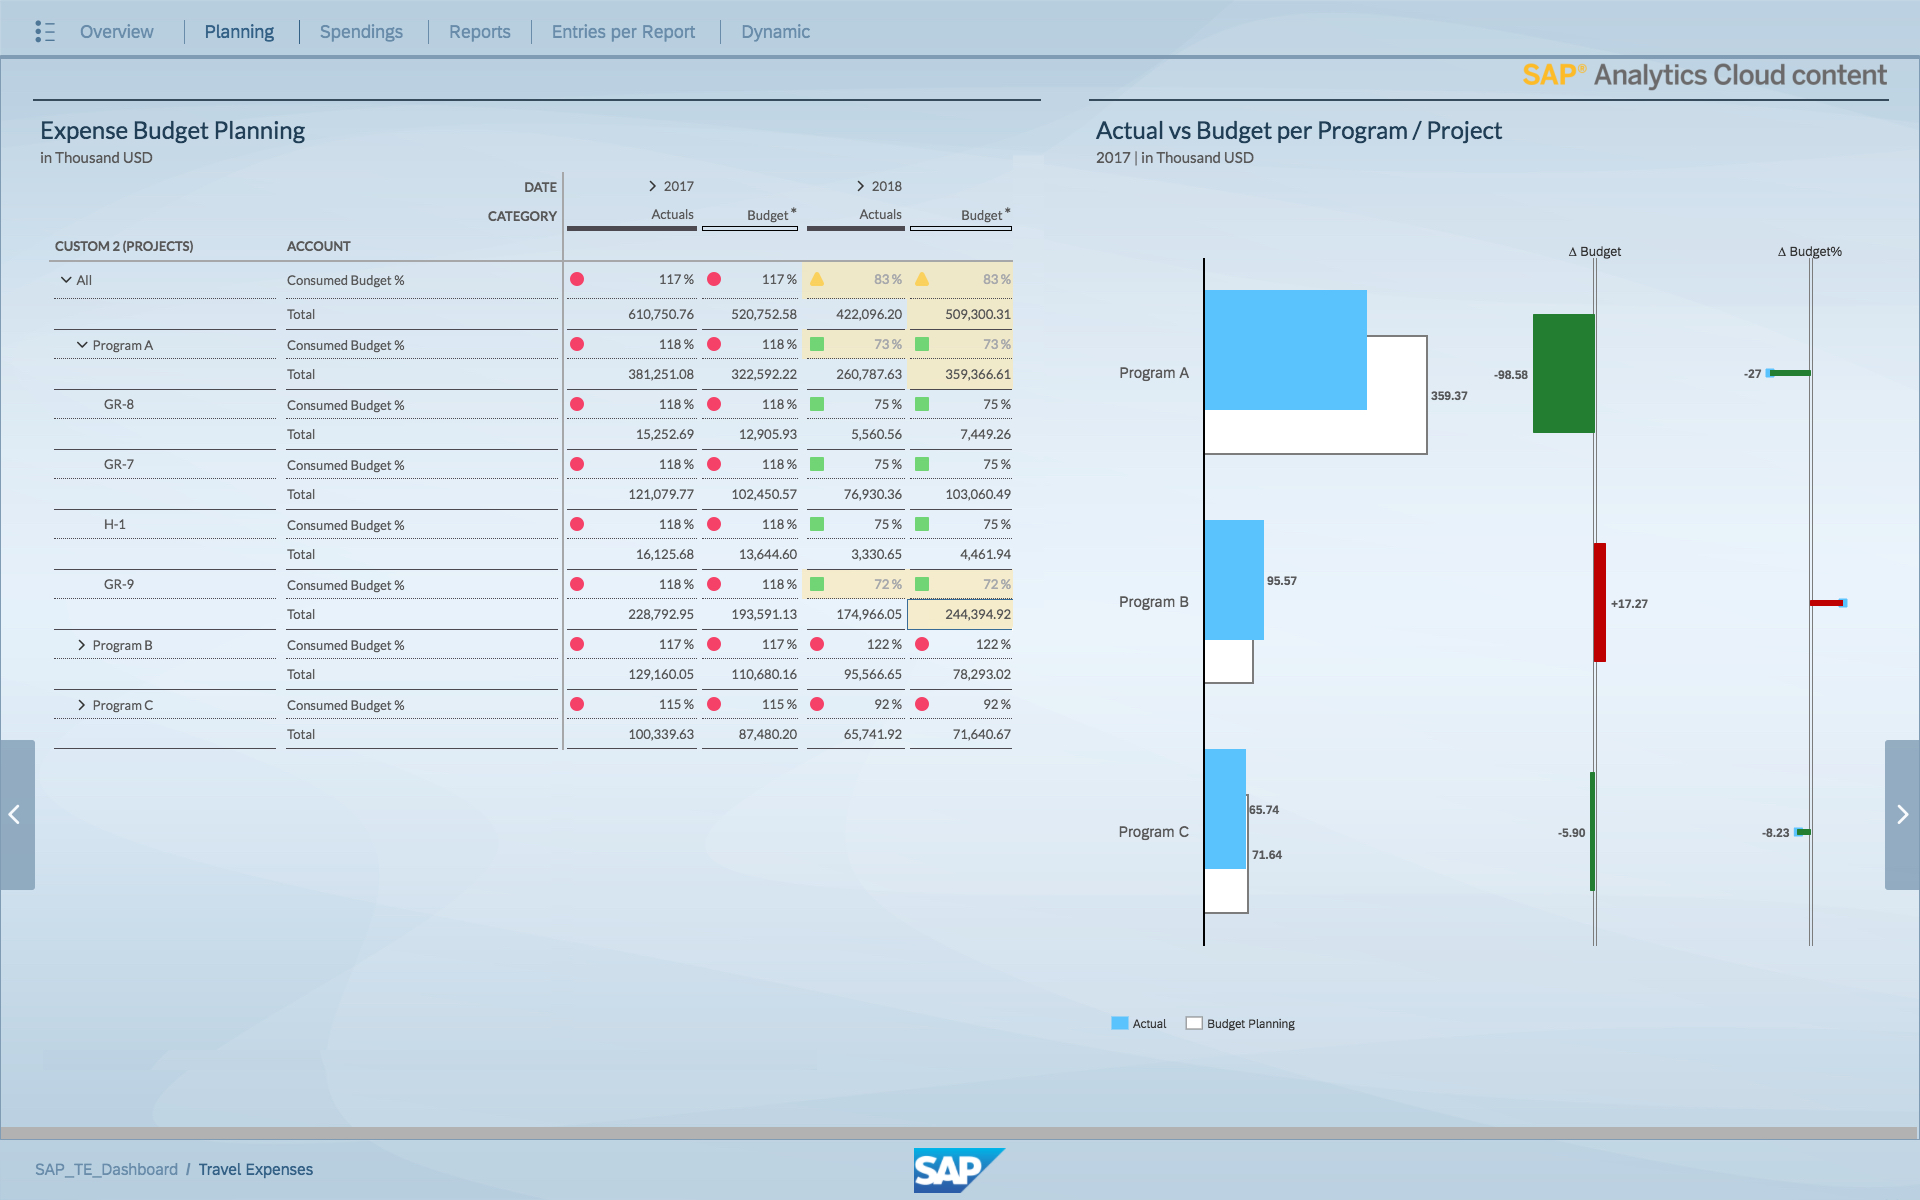
In the story "SAP Concur Travel Expenses" Expense Budget Planning on program/project hierarchies can be performed with budget distribution capabilities and tracking of actual vs. budget deviations. By clicking on any budget cell within the table, the budget can be adjusted in the budget column. The values in the table will adjust automatically. In addition, the chart on the right-hand side adjusts automatically responding to the input.

In this example 10000 USD are being added for the Budget in Program A GR-9.

The affected cells are highlighted: The entry added 10000USD to the overall budget for Program A and to the total Budget. In the chart, the delta to budget has increased by another 10000 USD resulting in 27% of the budget still remaining.
Leave us a comment below in case you have any questions or suggestions how content could be improved.
Related Resources
SAP Analytics Cloud content PDF Documentation
Overview of existing packages on the SAP Analytics Cloud Website or in the Roll-out Slide Deck
You want to see more blogs about SAP Analytics Cloud content? Go to our main blog or check out the tag SAP Analytics Cloud content on SCN.
You want to stay up-to-date? Paste this into your RSS feed-reader and subscribe.
- SAP Managed Tags:
- SAP Analytics Cloud
Labels:
You must be a registered user to add a comment. If you've already registered, sign in. Otherwise, register and sign in.
Labels in this area
-
ABAP CDS Views - CDC (Change Data Capture)
2 -
AI
1 -
Analyze Workload Data
1 -
BTP
1 -
Business and IT Integration
2 -
Business application stu
1 -
Business Technology Platform
1 -
Business Trends
1,658 -
Business Trends
92 -
CAP
1 -
cf
1 -
Cloud Foundry
1 -
Confluent
1 -
Customer COE Basics and Fundamentals
1 -
Customer COE Latest and Greatest
3 -
Customer Data Browser app
1 -
Data Analysis Tool
1 -
data migration
1 -
data transfer
1 -
Datasphere
2 -
Event Information
1,400 -
Event Information
66 -
Expert
1 -
Expert Insights
177 -
Expert Insights
293 -
General
1 -
Google cloud
1 -
Google Next'24
1 -
Kafka
1 -
Life at SAP
780 -
Life at SAP
13 -
Migrate your Data App
1 -
MTA
1 -
Network Performance Analysis
1 -
NodeJS
1 -
PDF
1 -
POC
1 -
Product Updates
4,577 -
Product Updates
341 -
Replication Flow
1 -
RisewithSAP
1 -
SAP BTP
1 -
SAP BTP Cloud Foundry
1 -
SAP Cloud ALM
1 -
SAP Cloud Application Programming Model
1 -
SAP Datasphere
2 -
SAP S4HANA Cloud
1 -
SAP S4HANA Migration Cockpit
1 -
Technology Updates
6,873 -
Technology Updates
419 -
Workload Fluctuations
1
Related Content
- 10+ ways to reshape your SAP landscape with SAP Business Technology Platform - Blog 7 in Technology Blogs by SAP
- Top Picks: Innovations Highlights from SAP Business Technology Platform (Q1/2024) in Technology Blogs by SAP
- What’s New in SAP Analytics Cloud Release 2024.08 in Technology Blogs by SAP
- Sneak Peek in to SAP Analytics Cloud release for Q2 2024 in Technology Blogs by SAP
- SAP Sustainability Footprint Management: Q1-24 Updates & Highlights in Technology Blogs by SAP
Top kudoed authors
| User | Count |
|---|---|
| 35 | |
| 25 | |
| 14 | |
| 13 | |
| 7 | |
| 7 | |
| 6 | |
| 6 | |
| 5 | |
| 5 |