

- SAP Community
- Products and Technology
- Technology
- Technology Blogs by SAP
- What’s New in SAP Analytics Cloud and SAP Digital ...
Technology Blogs by SAP
Learn how to extend and personalize SAP applications. Follow the SAP technology blog for insights into SAP BTP, ABAP, SAP Analytics Cloud, SAP HANA, and more.
Turn on suggestions
Auto-suggest helps you quickly narrow down your search results by suggesting possible matches as you type.
Showing results for
Product and Topic Expert
Options
- Subscribe to RSS Feed
- Mark as New
- Mark as Read
- Bookmark
- Subscribe
- Printer Friendly Page
- Report Inappropriate Content
04-23-2018
11:04 PM
This blog covers some of the latest new features and enhancements in SAP Analytics Cloud and SAP Digital Boardroom release 2018.07. Please note that the Analytics Cloud Help documentation is updated at the same time as the upgrade to this release, so the links here may not yet reflect what is described below until after the upgrade is complete.
SAP Analytics Cloud agent version required for data acquisition with this release:
For more information, see System Requirements and Technical Prerequisites.
Highlights of this release:
Learn with our latest video tutorials
Planning
In-grid calculations
We now allow direct entry of user defined calculations within the calculation area of the grid in both the rows and columns. Previously, support existed for calculations in the grid but it was outside of the predefined calculation area. This capability simplifies both the construction of report calculations (e.g. variance calculation) and the ability to customize the layout of your reports and calculations. Moreover, these in-grid calculations will be replicated down (or across!) consistent with changes in drill state of the specific report.

Learn more about grids
Improved cell formatting on grid pages
Never again will you forget which cells you’ve changed! In this release, when you select a cell to add to a formula, the cell will be highlighted so it’s easier for you to remember which cells you’ve changed.
Learn more about styling a table on grids
Cell reference enhancements
When you type a formula in a cell, you can now create cell references by simply selecting a table or grid cell.

Learn more about Cell References
Input task enhancements
Made a mistake? Don’t sweat it! If needed, you can now reset all your substitutes back to your default assignees. You can even exclude pages from input tasks that get sent to assignees, too!
Your administrators can see all the pages but your assignee will not. Got an issue with that? Now as an assignee, you can include comments when you choose to submit or decline a task.


Learn more about input tasks
Version management panel improvements
Easily create private versions by dragging and dropping your public version to your private version section. We’ve also added keyboard support for all versions.

Learn more about version management
Planning operation improvements
Planning operations including data entry on unbooked cells are now supported when filtering by dimension attributes. These navigation attributes can be combined with other types of dimension filters.
Navigation attributes are allowed in:

Data Integration
Data source tab for public dimensions
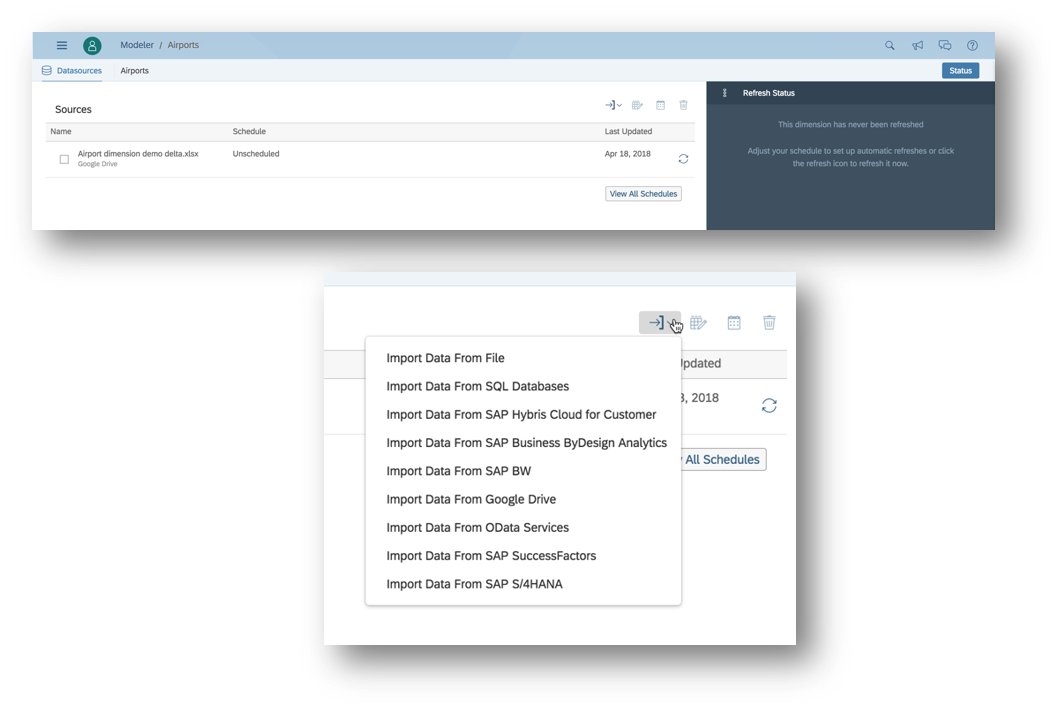
We’ve upgraded our public dimensions area! Now access the “Datasource” tab for public dimensions. This will capture all the information uploaded in it, creating a smoother consistent user experience for you and showing information about all data uploads into a public dimension.
Learn more about public and private dimensions
SAP BPC improvements
We’ve extended support to BPC models which use non-calendar fiscal years. To streamline and simplify integration with BPC, we’ve removed the option of creating a “read-only” model. Any BPC model can be read-only or write-enabled simply via the specific security configuration for the model within SAP Analytics Cloud.


Complex multi-dimensional filtering with R visualizations
R visualization widgets can now accommodate advanced filters for complex multi-dimensional inclusions and exclusions—so you can easily select N-tuples of dimension members to be filtered together.

Learn more about adding R Visualizations to your story
Digital Boardroom
Tired of seeing yesterday’s data? You can now set your story data in Digital Boardroom to automatically refresh in your presentation settings. It’s up to you to choose if you want your story refreshed every 5 minutes or 5 hours! Auto refresh is also available for stories independent of the Digital Boardroom—check out the details below!

Integration & OEM
Universal display hierarchy
Table visualizations using live connections to SAP BW now supports the BW Query setting “Display as Hierarchy” (also known as Universal Display Hierarchy.)
The Universal Display Hierarchy setting in the BW Query can be activated in the rows and/or columns. This allows two or more dimensions defined in the row or columns in the BW Query to be displayed hierarchically within a table visualization.

Interested in learning more? Check out our new blog on Universal Display Hierarchy support with SAP BW!
Learn more about hierarchies
Support for two structures in a BW BEx query
Stories using live connections to BW BEx queries containing two structures now support custom measures (calculated or restricted) within a visualization (table/chart.)

Learn more about building queries
Now, administrators can manage their SAP Analytics Cloud Mobile application via Mobile Application Management (MAM) solutions. As an administrator, you can specify your tenant URL, set up a default story to open on launch, and remove the application off a user’s device.

Learn more about using the Mobile App
Data Analysis, Stories and Tables
Save time when you design your stories! By enabling this performance optimization option in the modeler, charts or tables can be altered in a story without triggering an automatic refresh with each action.

Learn more about optimizing your story builder performance
Auto refresh stories! Set an interval for auto refresh in seconds, minutes, and hours (min. 30 secs.) You can also turn off auto refresh in view mode.
If auto refresh fails five times in a row, the feature will be temporarily disabled and you will be notified.

Story designers can configure prompts for viewers when they open a story, ensuring that the viewers are aware that the story is driven by prompts that can be adjusted.
Please note if there are two models and all variables are linked, only one prompt variable dialog will be shown for both models.

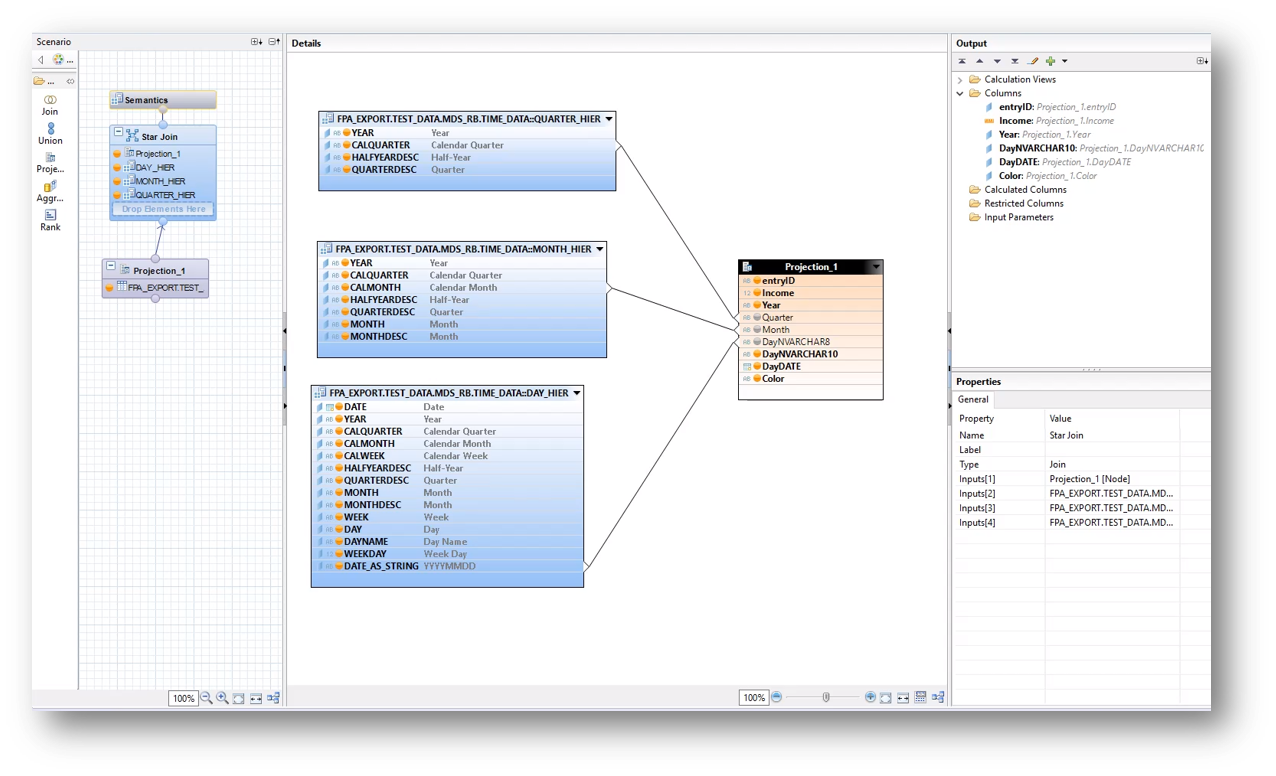
We now support star join time hierarchies in HANA! Please note that the minimum HANA version is 122.05.
Whether it’s two people, or twenty, all users editing the same story concurrently will be notified of each other’s presence. If any user in this scenario saves their story, all the other users will become viewers of that story and can only save a copy of it.

Example: Colin is in Design Mode for a story and Cynthia opens the same story in Design Mode. They will both receive a notification of each other’s presence. If Colin saves his version before Cynthia, then Cynthia will have the option to save a copy of her edits as a new story (and vice versa.)
You now can create date difference calculations on:
You can also calculate on different granularities such as:
Please note that this is only available for imported data.

Learn more about editing calculations
Now you can do calculations on NULL values in either calculated measures or dimensions.

We’ve added histograms as a new chart group! Histograms are easy-to-read charts that allow you to compare quantitative data in a visually compelling way.
Please note that blended data-sets and remote connections are not yet supported.

You can now set the hierarchy drill levels in the chart details and builder panel. Once the chart is saved, the drill level selection is maintained when reopening the story.
Please note that the only live data source supported for this feature is HANA.

Learn more about drilling through hierarchical data
Expand hierarchy top nodes of accounts or dimensions in your charts. Once they’ve been expanded, you can see both parent and child nodes. This level selection is maintained when reopening the story once the story is saved.
Please note that the only live data source supported for this feature is HANA.
Additional resources:
Previous feature summary blogs:
**Legal disclaimer
SAP has no obligation to pursue any course of business outlined in this blog or any related presentation, or to develop or release any functionality mentioned therein. This blog, or any related presentation and SAP’s possible future developments, products and or platforms directions and functionality are all subject to change and may be changed by SAP at any time for any reason without notice. The information in this blog is not a commitment, promise or legal obligation to deliver any material, code, or functionality. This blog is provided without a warranty of any kind, either express or implied, including but not limited to, the implied warranties of merchantability, fitness for a particular purpose, or non-infringement. This blog is for informational purposes and may not be incorporated into a contract. SAP assumes no responsibility for errors or omissions in this document, except if such damages were caused by SAP’s willful misconduct or gross negligence.
All forward-looking statements are subject to various risks and uncertainties that could cause actual results to differ materially from expectations. Readers are cautioned not to place undue reliance on these forward-looking statements, and should not be relied upon in making purchasing decisions.
SAP Analytics Cloud agent version required for data acquisition with this release:
- Version 1.0.85 for SAP Business Warehouse (BW)
- Version 1.0.99 for SAP ERP / SQL databases
- Version 1.0.91 for SAP Universe (UNX)
- Version 1.0.75 for all other data source types
- Note: Although it is not required, you can upgrade to the new agent version 1.0.99, no matter what data acquisition type you use. Do this to take advantage of updates made to SAP Analytics Cloud agent.
For more information, see System Requirements and Technical Prerequisites.
Highlights of this release:
- Planning: In-grid calculations
- Planning: Improved cell formatting on grid pages
- Planning: Cell reference enhancements
- Planning: Input task enhancements
- Planning: Version management panel improvements
- Planning: Planning operation improvements
- Data Integration: Data source tab for public dimensions
- Data Integration: SAP BPC improvements
- Predictive: Complex multi-dimensional filtering with R visualizations
- Digital Boardroom: Auto refresh option
- Integration & OEM: Universal display hierarchy
- Integration & OEM: Support for two structures in a BW Bex query
- Mobile: Enterprise management of mobile deployments
- Data Analysis, Stories and Tables: Optimize story building performance
- Data Analysis, Stories and Tables: Auto refresh of stories in view mode
- Data Analysis, Stories and Tables: Force prompt on open
- Data Analysis, Stories and Tables: Star join time hierarchies in HANA
- Data Analysis, Stories and Tables: Notification when multiple users are editing a story
- Data Analysis, Stories and Tables: Date interval calculation
- Data Analysis, Stories and Tables: NULL value calculations
- Data Analysis, Stories and Tables: Histograms
- Data Analysis, Stories and Tables: Setting hierarchy drill level in charts
- Data Analysis, Stories and Tables: Expanding hierarchies in charts
Learn with our latest video tutorials
- Create a model from SuccessFactors Workforce Analytics
- Apply filters to a chart in a story
- Apply filters to a geo map in a story
- Full tutorial playlist >
Planning
In-grid calculations
We now allow direct entry of user defined calculations within the calculation area of the grid in both the rows and columns. Previously, support existed for calculations in the grid but it was outside of the predefined calculation area. This capability simplifies both the construction of report calculations (e.g. variance calculation) and the ability to customize the layout of your reports and calculations. Moreover, these in-grid calculations will be replicated down (or across!) consistent with changes in drill state of the specific report.
Learn more about grids
Improved cell formatting on grid pages
Never again will you forget which cells you’ve changed! In this release, when you select a cell to add to a formula, the cell will be highlighted so it’s easier for you to remember which cells you’ve changed.
Learn more about styling a table on grids
Cell reference enhancements
When you type a formula in a cell, you can now create cell references by simply selecting a table or grid cell.
Learn more about Cell References
Input task enhancements
Made a mistake? Don’t sweat it! If needed, you can now reset all your substitutes back to your default assignees. You can even exclude pages from input tasks that get sent to assignees, too!
Your administrators can see all the pages but your assignee will not. Got an issue with that? Now as an assignee, you can include comments when you choose to submit or decline a task.
Learn more about input tasks
Version management panel improvements
Easily create private versions by dragging and dropping your public version to your private version section. We’ve also added keyboard support for all versions.
Learn more about version management
Planning operation improvements
Planning operations including data entry on unbooked cells are now supported when filtering by dimension attributes. These navigation attributes can be combined with other types of dimension filters.
Navigation attributes are allowed in:
- Story filters
- Page filters
- Builder panel filters
Data Integration
Data source tab for public dimensions
We’ve upgraded our public dimensions area! Now access the “Datasource” tab for public dimensions. This will capture all the information uploaded in it, creating a smoother consistent user experience for you and showing information about all data uploads into a public dimension.
Learn more about public and private dimensions
SAP BPC improvements
We’ve extended support to BPC models which use non-calendar fiscal years. To streamline and simplify integration with BPC, we’ve removed the option of creating a “read-only” model. Any BPC model can be read-only or write-enabled simply via the specific security configuration for the model within SAP Analytics Cloud.
Predictive
Complex multi-dimensional filtering with R visualizations
R visualization widgets can now accommodate advanced filters for complex multi-dimensional inclusions and exclusions—so you can easily select N-tuples of dimension members to be filtered together.
Learn more about adding R Visualizations to your story
Digital Boardroom
Auto refresh option
Tired of seeing yesterday’s data? You can now set your story data in Digital Boardroom to automatically refresh in your presentation settings. It’s up to you to choose if you want your story refreshed every 5 minutes or 5 hours! Auto refresh is also available for stories independent of the Digital Boardroom—check out the details below!
Integration & OEM
Universal display hierarchy
Table visualizations using live connections to SAP BW now supports the BW Query setting “Display as Hierarchy” (also known as Universal Display Hierarchy.)
The Universal Display Hierarchy setting in the BW Query can be activated in the rows and/or columns. This allows two or more dimensions defined in the row or columns in the BW Query to be displayed hierarchically within a table visualization.
Interested in learning more? Check out our new blog on Universal Display Hierarchy support with SAP BW!
Learn more about hierarchies
Support for two structures in a BW BEx query
Stories using live connections to BW BEx queries containing two structures now support custom measures (calculated or restricted) within a visualization (table/chart.)
Learn more about building queries
Mobile
Enterprise management of mobile deployments
Now, administrators can manage their SAP Analytics Cloud Mobile application via Mobile Application Management (MAM) solutions. As an administrator, you can specify your tenant URL, set up a default story to open on launch, and remove the application off a user’s device.
Learn more about using the Mobile App
Data Analysis, Stories and Tables
Optimize story building performance
Save time when you design your stories! By enabling this performance optimization option in the modeler, charts or tables can be altered in a story without triggering an automatic refresh with each action.
Learn more about optimizing your story builder performance
Auto refresh of stories in view mode
Auto refresh stories! Set an interval for auto refresh in seconds, minutes, and hours (min. 30 secs.) You can also turn off auto refresh in view mode.
If auto refresh fails five times in a row, the feature will be temporarily disabled and you will be notified.
Force prompt on open
Story designers can configure prompts for viewers when they open a story, ensuring that the viewers are aware that the story is driven by prompts that can be adjusted.
Please note if there are two models and all variables are linked, only one prompt variable dialog will be shown for both models.
Star join time hierarchies in HANA
We now support star join time hierarchies in HANA! Please note that the minimum HANA version is 122.05.
Notification when multiple users are editing a story
Whether it’s two people, or twenty, all users editing the same story concurrently will be notified of each other’s presence. If any user in this scenario saves their story, all the other users will become viewers of that story and can only save a copy of it.
Example: Colin is in Design Mode for a story and Cynthia opens the same story in Design Mode. They will both receive a notification of each other’s presence. If Colin saves his version before Cynthia, then Cynthia will have the option to save a copy of her edits as a new story (and vice versa.)
Date interval calculation
You now can create date difference calculations on:
- Max
- Min
- Average
- Sum
You can also calculate on different granularities such as:
- Year
- Quarter
- Month
- Week
- Day
Please note that this is only available for imported data.
Learn more about editing calculations
NULL value calculations
Now you can do calculations on NULL values in either calculated measures or dimensions.
Histograms
We’ve added histograms as a new chart group! Histograms are easy-to-read charts that allow you to compare quantitative data in a visually compelling way.
Please note that blended data-sets and remote connections are not yet supported.
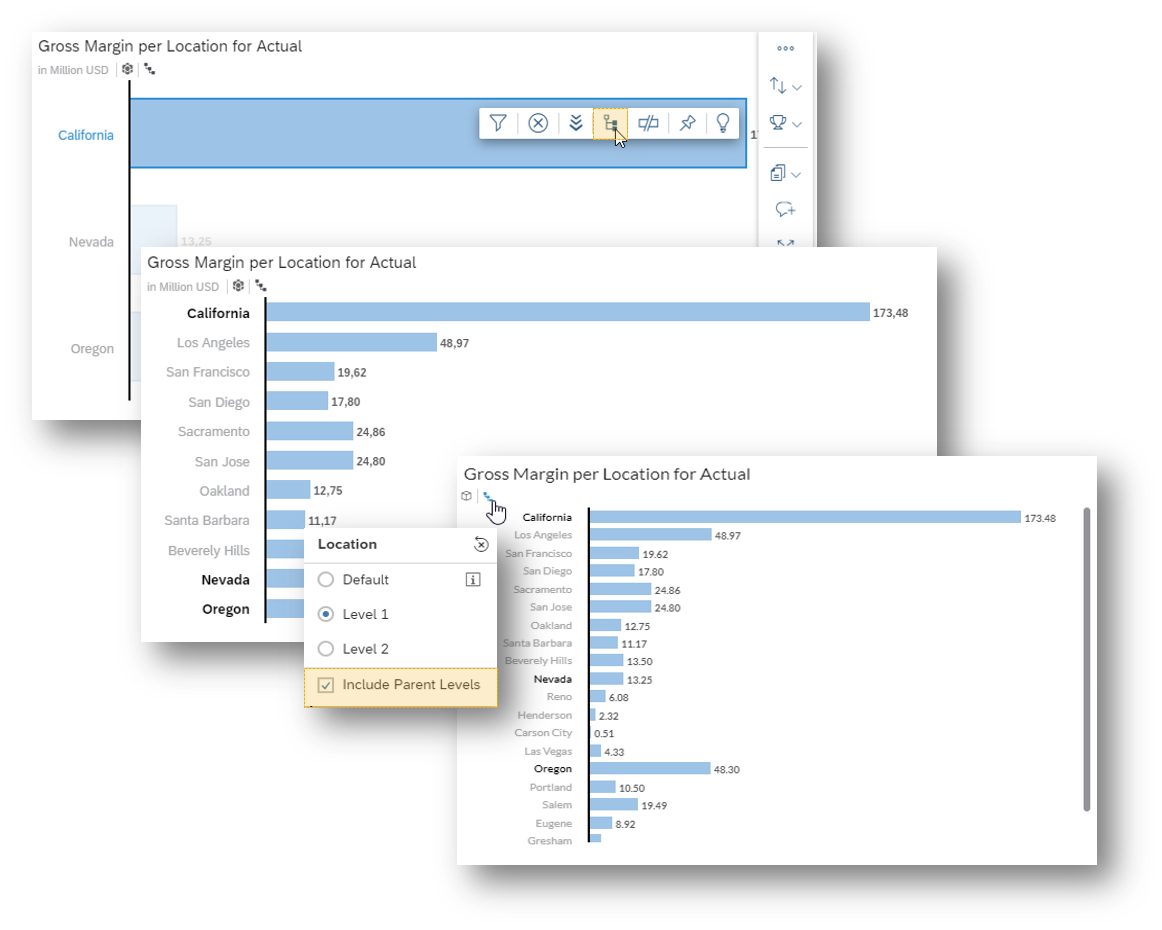
Setting hierarchy drill level in charts
You can now set the hierarchy drill levels in the chart details and builder panel. Once the chart is saved, the drill level selection is maintained when reopening the story.
Please note that the only live data source supported for this feature is HANA.
Learn more about drilling through hierarchical data
Expanding hierarchies in charts
Expand hierarchy top nodes of accounts or dimensions in your charts. Once they’ve been expanded, you can see both parent and child nodes. This level selection is maintained when reopening the story once the story is saved.
Please note that the only live data source supported for this feature is HANA.
Additional resources:
- Video tutorials
- Guided learning
- Events and recordings
- SAP Analytics Cloud help resources
- Official roadmap contains more info on future plans, subject to change.
Previous feature summary blogs:
- SAP Analytics Cloud release 2018.06
- SAP Analytics Cloud release 2018.05
- SAP Analytics Cloud release 2018.04
- SAP Analytics Cloud release 2018.03
- SAP Analytics Cloud release 2018.02
- SAP Analytics Cloud release 2018.01
- More >
**Legal disclaimer
SAP has no obligation to pursue any course of business outlined in this blog or any related presentation, or to develop or release any functionality mentioned therein. This blog, or any related presentation and SAP’s possible future developments, products and or platforms directions and functionality are all subject to change and may be changed by SAP at any time for any reason without notice. The information in this blog is not a commitment, promise or legal obligation to deliver any material, code, or functionality. This blog is provided without a warranty of any kind, either express or implied, including but not limited to, the implied warranties of merchantability, fitness for a particular purpose, or non-infringement. This blog is for informational purposes and may not be incorporated into a contract. SAP assumes no responsibility for errors or omissions in this document, except if such damages were caused by SAP’s willful misconduct or gross negligence.
All forward-looking statements are subject to various risks and uncertainties that could cause actual results to differ materially from expectations. Readers are cautioned not to place undue reliance on these forward-looking statements, and should not be relied upon in making purchasing decisions.
- SAP Managed Tags:
- SAP Analytics Cloud
4 Comments
You must be a registered user to add a comment. If you've already registered, sign in. Otherwise, register and sign in.
Labels in this area
-
ABAP CDS Views - CDC (Change Data Capture)
2 -
AI
1 -
Analyze Workload Data
1 -
BTP
1 -
Business and IT Integration
2 -
Business application stu
1 -
Business Technology Platform
1 -
Business Trends
1,658 -
Business Trends
91 -
CAP
1 -
cf
1 -
Cloud Foundry
1 -
Confluent
1 -
Customer COE Basics and Fundamentals
1 -
Customer COE Latest and Greatest
3 -
Customer Data Browser app
1 -
Data Analysis Tool
1 -
data migration
1 -
data transfer
1 -
Datasphere
2 -
Event Information
1,400 -
Event Information
66 -
Expert
1 -
Expert Insights
177 -
Expert Insights
293 -
General
1 -
Google cloud
1 -
Google Next'24
1 -
Kafka
1 -
Life at SAP
780 -
Life at SAP
12 -
Migrate your Data App
1 -
MTA
1 -
Network Performance Analysis
1 -
NodeJS
1 -
PDF
1 -
POC
1 -
Product Updates
4,577 -
Product Updates
340 -
Replication Flow
1 -
RisewithSAP
1 -
SAP BTP
1 -
SAP BTP Cloud Foundry
1 -
SAP Cloud ALM
1 -
SAP Cloud Application Programming Model
1 -
SAP Datasphere
2 -
SAP S4HANA Cloud
1 -
SAP S4HANA Migration Cockpit
1 -
Technology Updates
6,873 -
Technology Updates
416 -
Workload Fluctuations
1
Related Content
- 体验更丝滑!SAP 分析云 2024.07 版功能更新 in Technology Blogs by SAP
- Top Picks: Innovations Highlights from SAP Business Technology Platform (Q1/2024) in Technology Blogs by SAP
- What’s New in SAP Analytics Cloud Release 2024.08 in Technology Blogs by SAP
- Sneak Peek in to SAP Analytics Cloud release for Q2 2024 in Technology Blogs by SAP
- Deep dive into Q4 2023, What’s New in SAP Cloud ALM for Implementation Blog Series in Technology Blogs by SAP
Top kudoed authors
| User | Count |
|---|---|
| 31 | |
| 24 | |
| 10 | |
| 7 | |
| 6 | |
| 6 | |
| 5 | |
| 5 | |
| 5 | |
| 4 |