

So over 12K registered for our webcasts, with the highest webcast registration at 457, lowest at 36.

SAP Analytics Cloud automatically built this story

If you hover over the outlier, you can see which webcast was the outlier, which was Overview of Lumira 2.x Roadmap which had 457 register, 319 watch online.

You can see over 6K actually watched the ASUG BI webcasts in 2017.

Again, this is a build my story automatically shows registration by SIG.

This is an attempt at a histogram for registration, using Lumira. This is showing distributions of webcast registrations.
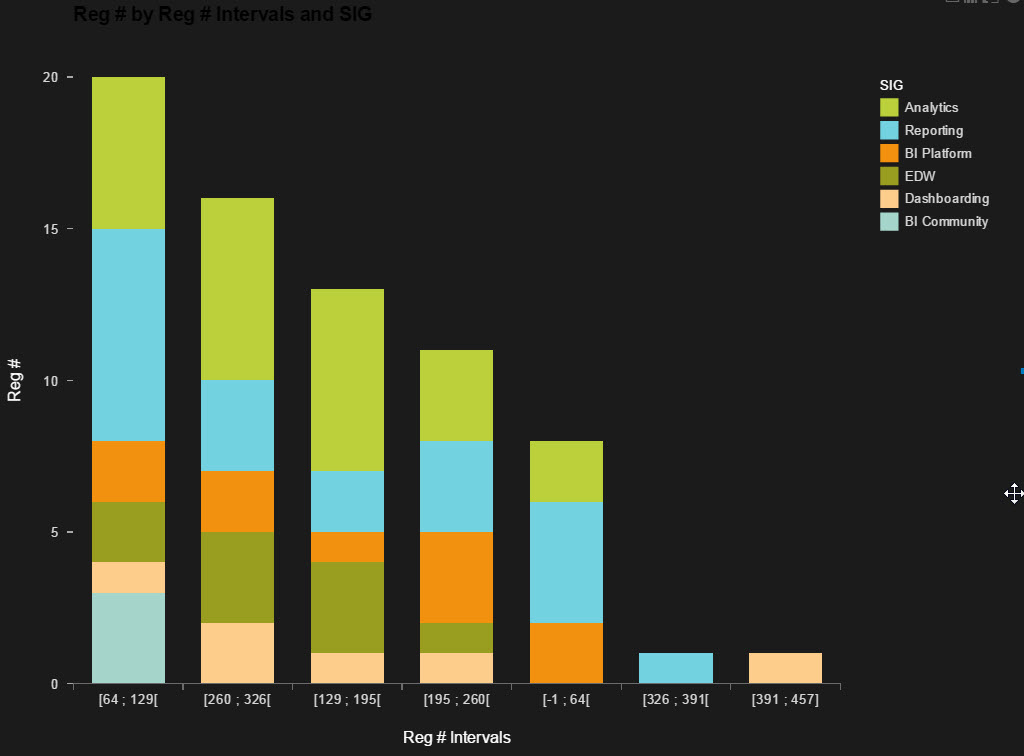
This is a stacked "histogram" to show contribution of registration by SIG, using Lumira.

Above shows the online registration histogram showing contribution by SIG

Registration is shown by month; note that there are ASUG blackout periods in January and December, thus resulting in lower registration. Additionally, last year, the BI+Analytics Conference was held in August; we try to not to schedule webcasts during that time frame. September was a little lower too as that was during SAP TechEd Las Vegas.

Q2 was the highest month for registration and online, Q1/Q4 contain ASUG HQ blackout dates, and Q3 was when we held our face-to-face events (BI+Analytics and SAP TechEd Las Vegas)
Does Day of Week impact Webcast Registration?

Above is the automatic distribution that SAP Analytics Cloud provides - counts of webcasts by weekday

Tuesday is the magic day; ASUG prefers not holding webcasts on Mondays or Fridays but sometimes that cannot be avoided.

More attend online when the webcast is held on a Tuesday

This was automatically built by SAP Analytics Cloud and I find it interesting
Data Science or ?
I attended a free online data science course offered by Microsoft. I used what I learned from that course on these webcast statistics. I hope to look at providing visualizations for this down the road. It is very interesting:
| Reg # | Analysis | Online # | Analysis | Attendance Ratio | Analysis | Registration Conv Rate | Analysis |
| Mean | 171.5286 | Mean | 88.92857 | Mean | 0.508330846 | Mean | 0.653571429 |
| Standard Error | 11.2447 | Standard Error | 6.86701 | Standard Error | 0.012020236 | Standard Error | 0.025869585 |
| Median | 151.5 | Median | 74.5 | Median | 0.51329099 | Median | 0.6 |
| Mode | 140 | Mode | 55 | Mode | #N/A | Mode | 1 |
| Standard Deviation | 94.07994 | Standard Deviation | 57.45353 | Standard Deviation | 0.100568512 | Standard Deviation | 0.216440478 |
| Sample Variance | 8851.035 | Sample Variance | 3300.908 | Sample Variance | 0.010114026 | Sample Variance | 0.04684648 |
| Kurtosis | -0.2443 | Kurtosis | 2.243971 | Kurtosis | -0.177564305 | Kurtosis | -0.373494926 |
| Skewness | 0.567586 | Skewness | 1.213323 | Skewness | -0.438287917 | Skewness | 0.208104324 |
| Range | 421 | Range | 299 | Range | 0.438771375 | Range | 0.87 |
| Minimum | 36 | Minimum | 20 | Minimum | 0.259259259 | Minimum | 0.13 |
| Maximum | 457 | Maximum | 319 | Maximum | 0.698030635 | Maximum | 1 |
| Sum | 12007 | Sum | 6225 | Sum | 35.58315923 | Sum | 45.75 |
| Count | 70 | Count | 70 | Count | 70 | Count | 70 |
Above is automatically provided from the Excel Analysis Pak, Descriptive Statistics
Mean registration webcast is 171.5
Mean online webcast is 88.9
The attendance ratio is online / registered - and mean is 50.8%
The "descriptive statistics" show the "central tendency" - mean, median and mode
Median is the middlemost value; the formula is total number of observations + 1 / 2 and the data has to be ordered
Mode is most frequent value in dataset, usually seen via a histogram, and you can see how far off data is from normal
If mode and median are less than mean, this indicates a right skewed distribution
This covers how the data is shaped
_________________
Variability covers how spread apart data values
The range is max minus min and tells story of how disperse data is
Variance indicates how variable is data; can be unwieldy
Standard deviation (square root of variance) - understand how data distributed around mean
Standard error is variance around true mean; at shows how close to mean
N/A - in mode - no single value that is more common than anything else (see Attendance ratio above)
Shape of distribution - Kurtosis is an estimate of normality of data (Microsoft) - closer to 0, more likely the data is normally distributed
Skewness - tails; positive number means it is right skewed, negative means it is left-skewed - +2 / -2 are good for statistical analysis
Webinar Pipeline
If I were a marketing/saleperson, I would like at how to turn the registration clicks into registered, and registered into online.
Of those who clicked the webcast page, what is the percentage registered?

So over 21K were aware of the webcast, over 12K were interested (registered), and over 6K actually attended.
Mobility SAP Analytics Cloud

Above shows how it looks on my iPhone with SAP Analytics Cloud; the resolution was crisp. I copied some of the stories to the "responsive" lanes.

iPhone resolution is very good
Smart Discovery

Not sure this can be seen, but it shows 44% of the webcasts have above average registration
Word Clouds

This is text analysis on single words from webcast titles; with SAP and BusinessObjects leading the way

Two word text analysis, with SAP BusinessObjects and Web Intelligence leading the way
More upcoming webcasts
Upcoming ASUG Business Intelligence Community Webcasts