Do we live in a safe area? How one simple question can lead to many more questions.
Last week, my son asked me if we lived in a safe area. While my obvious answer was yes, I had no data to defend my answer. Fortunately, the City of Boston makes all of this
data available to the public and analytics allows you to make sense of this data. As a newbie to SAP, I decided to give
SAP Analytics Cloud a test-drive to see if I could make sense of this data.

Starting from the easiest-to-hardest questions, here's what I found...
How many police "incidents" occurred in Boston?

As of this blog, we were only a quarter of the way through 2018.
Are These Incidents Likely to Increase or Decrease In the Future?
Based on this historical data, we can accurately forecast the incident rate over the next 6 months and we can see that the forecast is expected to remain relatively flat.
 What Types of Offenses Make Up These Numbers?
 Are There More or Less Incidents in Boston?
Across all districts, there have been fewer reported incidents on a monthly, quarterly, and yearly level (
except for Part Three incidents which saw an increase from 2016 to 2017).
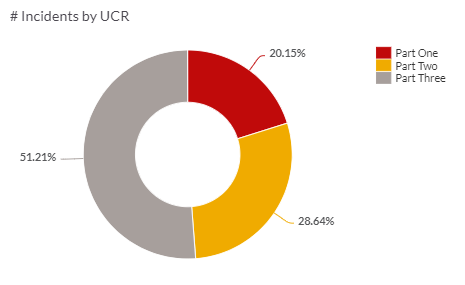
 What the Heck are 'Part One', 'Part Two', and 'Part Three' Incidents?
UCR stands for "
Universal Crime Reporting". It's a classification used to bucket incidents by severity. Part 1 are the more severe crimes, part 2 are lesser crimes that result in arrests, and part 3 are incidents that do not lead to an arrest. Here are the types of incidents that fall into these reporting buckets.
 Which Districts Have the Highest Crime?
The
South End,
Charleston, and
Roxbury have most crime incidents this year, but their numbers have all decreased from last year.
 What Data Variables Lead to Violent Crimes?
Before we analyze this data further, it's worth understanding which variables lead to higher and more violent crimes - to make our analysis and our conclusions more relevant. Using SAP's predictive analytics capabilities, we can run a classification algorithm to see which variables (or columns in our data set) are most likely to lead to a violent crime. In the visual below, we can see that the
reporting area,
time of day, and
street are the three most important variables that it's recommending to analyze.
 Which Districts Have the Most Violent Offenses?
Since our most relevant variable is location, we can filter on our violent crimes and we can see that these crimes are most commonly reported in
Roxbury,
Mattapan, and
Dorchester and typically stem from
aggravated assault,
homicides, and
warrant arrests.
 Where and When Do These Violent Offenses Take Place?
Our second most important variable is time-of-day. And no surprise, but
nights and
evenings are the most common times for these crimes.
 Which Streets Have the Most Violent Offenses at Night?
And finally, we can see that these shooting crimes are mostly likely to happen at
night on
Washington St or
Blue Hill Ave.

* Tourists. Avoid Washington Street (in Dorchester) or Blue Hill Ave. (in Mattapan) at night.
What does this mean?
Data is everywhere and all around us. But without analytics, data is just data. Turning it into analytics with tools like SAP Analytics Cloud helps arms you with actionable information to make better and more informed decisions. For the City of Boston, it can provide a more meaningful way to publicize and to provide transparency into all of the good work that these brave men and women are doing to serve the public.
Want to learn more?
Use the comments sections to ask questions and learn more...
