
- SAP Community
- Products and Technology
- Technology
- Technology Blogs by SAP
- Impact Analysis as part of Software Update Manager...
Technology Blogs by SAP
Learn how to extend and personalize SAP applications. Follow the SAP technology blog for insights into SAP BTP, ABAP, SAP Analytics Cloud, SAP HANA, and more.
Turn on suggestions
Auto-suggest helps you quickly narrow down your search results by suggesting possible matches as you type.
Showing results for
Advisor
Options
- Subscribe to RSS Feed
- Mark as New
- Mark as Read
- Bookmark
- Subscribe
- Printer Friendly Page
- Report Inappropriate Content
03-08-2018
2:39 PM
In this blog I describe the Impact Analysis feature which is part of Software Update Manager 2.0 Abstract: The Software Update Manager (SUM) offers various downtime optimization approaches like nZDM for ABAP and ZDO. The usage of such an approach can result in certain kinds of impacts for database tables. To prevent unexpected occurrences of such impacts during the maintenance event on your production system, you would like to identify them in advance using the Impact Analysis tool as part of Software Update Manager 2.0. Update (December 20, 2021): added the information in SUM Toolbox Update (March 29, 2019): section FAQ added. Update (June 14, 2019): screenshots and features of SUM 2.0 SP05 added/updated. Update (June 18, 2021): FAQ enhanced by decimal notation explanation. |
When to use the Impact Analysis?
You want to minimize the downtime of an update or upgrade by using one of the downtime-optimization approaches offered by SAP. For ABAP-based systems you can reduce the downtime by using near-Zero Downtime Maintenance or Zero Downtime Option of SUM. These downtime-optimization approaches can result in certain kinds of impacts for database tables or with respect to the additional required database space.
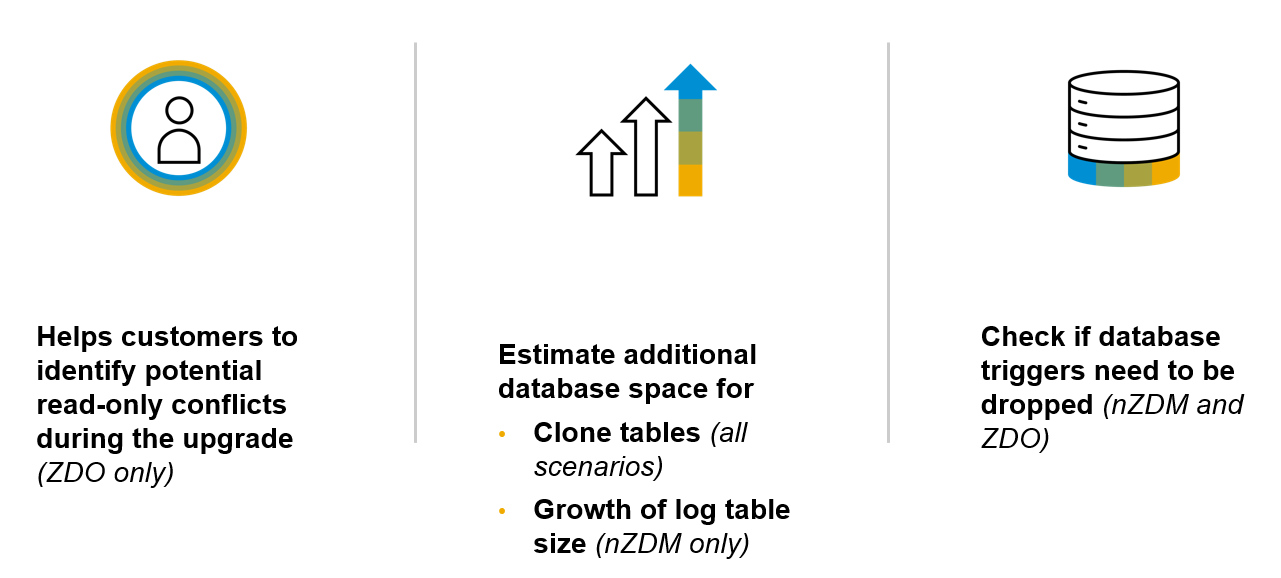
In case of nZDM, the following impacts are possible:
- Additional daily DB growth due to change recording
- Database triggers might have to be removed from certain tables (for details on SLT triggers, see SAP Community blog SLT and database trigger handling with Software Update Manager 2.0)
- Additional DB space requirements due to table cloning
In case of ZDO, the following impacts are possible:
- Read-only restrictions for end users on the bridge instance
- Database triggers might have to be removed from certain tables
- Additional DB space requirements due to table cloning
- Tables that will be smart-switched but have a high number of changes
To prevent unexpected occurrence of such impacts during the maintenance event on your production system, you would like to identify them in advance. This can be achieved by exporting table statistics from your production system, and providing them to the SUM running on your sandbox system.
How to use the Impact Analysis in general and how to export the data?
Before the Impact Analysis can be started, you'd need to get statistical data from your production system. Don't miss that SAP Note 2187612 must be implemented in your production system.
 | It's important that the statistical data is exported from the production system because the impact of an update to your production system should be checked. |
For this. the statistical data should be representative for the time when the upgrade is running. Let's assume you plan to start the SUM tool on Monday and the cutover should happen on Saturday. Then, the ideal timeframe would be a dataset that captures all activities and business processes like the time of the week when the SUM is performing the update. SAP recommends to not include timeframes when transports were imported into the system. This would lead to false-positive results later in the Impact Analysis.
Now, get ready to export the statistical data from your production system like described in SAP Note 2402270. All relevant steps and pre-requisites are well described in this SAP Note.
The export report is part of the SUM Toolbox which was introduced in December 2021. For details in the SUM Toolbox, see SAP Community blog post Software Update Manager Toolbox is Available Now.
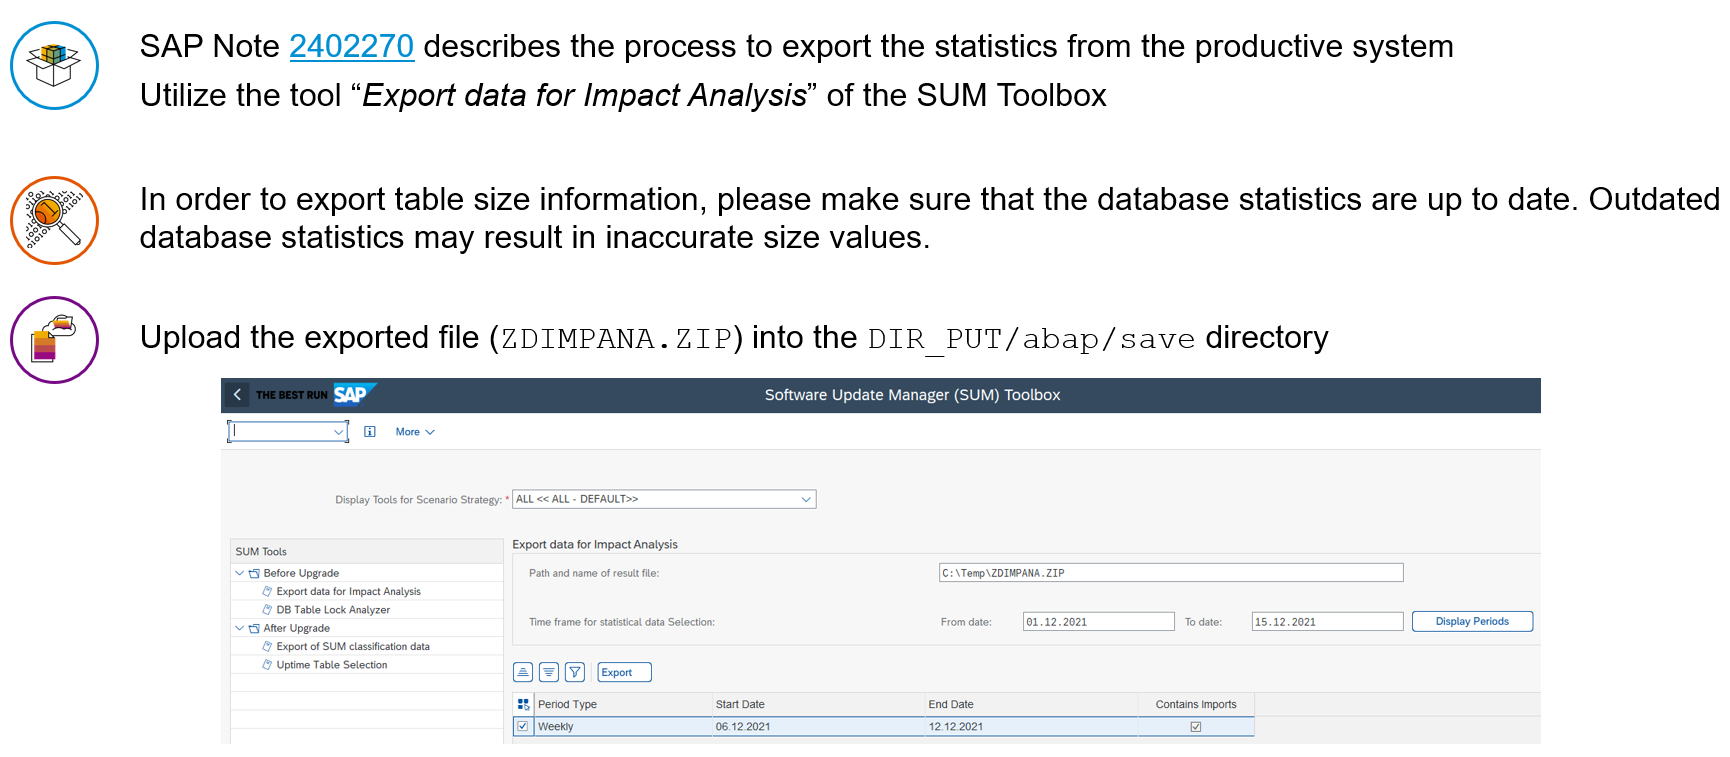
Fill in all fields and select a proper time frame. After this, just run the report and the file ZDIMPANA.ZIP will be exported to your local client. Now, you can upload the file to the save directory of Software Update Manager (<DIR_PUT>/save/ZDIMPANA.ZIP). Make sure, that you spell the file name and also the extension ZDIMPANA.ZIP in capital letters.
To get more insights about specific use-cases jump down in the blog to the downtime-optimization approach you're running.
How to use it for nZDM (near-Zero Downtime Maintenance)?
The near-Zero Downtime Maintenance (nZDM) approach uses the so-called CRR (Change Record & Replay) technique for business transactions based on database trigger technology. With the introduction of the Record & Replay technique in nZDM that uses the Change Recording and Replication (CRR) framework, you can now capture database changes in tables on the production instance during uptime. This trigger-based change recording technique allows importing new content into the shadow instance and adjusting table structures to the new release while all users are still able to work on the production system. The recording of data changes is started automatically by the SUM and is transferred to the shadow instance iteratively after the table structure adjustment.
Recording changes means that business transactions will be captured in temporary tables. This requires temporary additional database space. Also, in order to enter the technical downtime, at least 75% of all recorded changes needed to be replayed. However, SAP strongly recommends having a replication ratio of > 95%. For additional information on this, see blog Introducing the new CRR Control Center to monitor Record & Replay in SUM 2.0.
Now, the Impact Analysis comes into play. You may have observed in the past, that predicting the amount of additional database space for the logging tables was not possible. Another thing which is hard to predict is the number of records which are captured during the upgrade.
With the Impact Analysis for nZDM you can get the answer for the following key figures:
- Additional daily DB growth due to change recording
- Database triggers might have to be removed from certain tables (for details on SLT triggers, see SAP Community blog SLT and database trigger handling with Software Update Manager 2.0)
- Additional DB space requirements due to table cloning
Here's the three-step-approach how the impact analysis can be activated for nZDM. If you already passed the phase RUN_IMPACT_ANALYSIS_UPG you cannot run it again.

To make use of the Impact Analysis you've to export the statistical data from your production system first. The file must be uploaded and provisioned to the save directory of Software Update Manager.
The idea is rather simple: SUM known which tables are touched by the update. Based on this information nZDM must switch and clone certain tables. Now, with the statistical data of your production it can be compared whether any of the switch tables either have database triggers or will be changed very frequently. As mentioned above, both can have a severe business impact.
The next picture shows you how the Impact Analysis works:

You can see in this example that Table-C will be switch and gets changed very frequently according to the statistics. Consequently, the CRR logging table may growth very fast. Additionally, the planned cutover windows might be endangered since the required replication ratio of > 75% will not be reached in time. With the Impact Analysis for nZDM it will be easier to predict how long it will take until the technical downtime can start.
Besides the described business impacts, we got some more key figures with the Impact Analysis result:
- Estimation of addition database space for clone tables
- Estimation of addition database space for CRR logging tables
With the latest version of SUM 2.0, the Impact Analysis of nZDM will be triggered one time by SUM in the background, and write the results into the following log file:
<SUM>/abap/log/IMPANAUPG.<SID>
Sample output:
[...]

A4 ESUPG 301 Report name ...: "RSUPG_RUN_IMPACT_ANALYSIS"

A4 ESUPG 302 Log name: "/usr/sap/SID/SUM/abap/log/IMPANAUPG.SID"

A4 ESUPG 304 Start time.....: "08.03.2018" "14:07:03"

A4 ESUPG 002 " "

A4 ESUPG 001 -------------------------------------------------------------------------

A4 ESUPG_IMPANA 007 Report "RSUPG_RUN_IMPACT_ANALYSIS" started

A4 ESUPG_IMPANA 001 -------------------------------------------------------------------------

A4 ESUPG_IMPANA 121 Header data:  "source_system_id = 'PRD'".

A4 ESUPG_IMPANA 121 Header data:  "source_license_number = '0012345678'".

A4 ESUPG_IMPANA 121 Header data:  "source_db_platform = 'AnyDB'".

A4 ESUPG_IMPANA 121 Header data:  "contains_local_objects = 'true'".

A4 ESUPG_IMPANA 121 Header data:  "contains_imports = 'false'".

A4 ESUPG_IMPANA 121 Header data:  "export_timestamp = '20170717123918'".

A4 ESUPG_IMPANA 121 Header data:  "export_version = '1.13'".

A4 ESUPG_IMPANA 121 Header data:  "export_header_file = 'header.xml'".

A4 ESUPG_IMPANA 121 Header data:  "evaluated_periods_file = 'evaluated_periods.xml'".

A4 ESUPG_IMPANA 121 Header data:  "relevant_tables_file = 'relevant_tables.xml'".

A4 ESUPG_IMPANA 121 Header data:  "irrelevant_tables_file = 'irrelevant_tables.xml'".

A4 ESUPG_IMPANA 121 Header data:  "number_relevant_tables = '2423'".

A4 ESUPG_IMPANA 121 Header data:  "number_irrelevant_tables = '117764'".

[...]

A3WESUPG_IMPANA 204 Change recording for "TABL PATCHHIST" will produce up to "4867971" log records per day.

A3WESUPG_IMPANA 205 Log table for "TABL PATCHHIST" is estimated to grow by up to "1.271" GB per day.

A3WESUPG_IMPANA 201 "TABL PATCHHIST" must be untriggered, but has "1" SLT trigger(s) on ref. system "PRD".

A3WESUPG_IMPANA 202 "TABL PATCHHIST" must be untriggered, but has "1" non-SLT trigger(s) on ref. system "PRD".

A4 ESUPG_IMPANA 130 Meta data for "TABL PATCHHIST":  "tabclass = 'TRANSP'"  "sqltab = ''"  "contflag = 'L'".

A4 ESUPG_IMPANA 130 Meta data for "TABL PATCHHIST":  "package = 'SBAC'"  "component = 'SAP_BASIS'"  "version = '740'".

A4 ESUPG_IMPANA 130 Meta data for "TABL PATCHHIST":  "sp_level = '0009'"  "switch = 'X'"  "changerec = 'X'".

A4 ESUPG_IMPANA 130 Meta data for "TABL PATCHHIST":  "britype = ''"  "readonly = ''"  "updates_per_day = '221410.0'".

A4 ESUPG_IMPANA 130 Meta data for "TABL PATCHHIST":  "deletes_per_day = '123110.1'"  "inserts_per_day = '4523450.8'"  "table_size_in_gb = '0.000'".

A4 ESUPG_IMPANA 130 Meta data for "TABL PATCHHIST":  "index_size_in_gb = '0.000'"  "slt_triggers = '1'"  "non_slt_triggers = '1'".

A4 ESUPG_IMPANA 001 -------------------------------------------------------------------------

A3WESUPG_IMPANA 204 Change recording for "TABL STXL" will produce up to "243543412" log records per day.

A3WESUPG_IMPANA 205 Log table for "TABL STXL" is estimated to grow by up to "72.332" GB per day.

A4 ESUPG_IMPANA 130 Meta data for "TABL STXL":  "tabclass = 'TRANSP'"  "sqltab = ''"  "contflag = 'W'".

A4 ESUPG_IMPANA 130 Meta data for "TABL STXL":  "package = 'STXD'"  "component = 'SAP_BASIS'"  "version = '740'".

A4 ESUPG_IMPANA 130 Meta data for "TABL STXL":  "sp_level = '0009'"  "switch = 'X'"  "changerec = 'X'".

A4 ESUPG_IMPANA 130 Meta data for "TABL STXL":  "britype = ''"  "readonly = ''"  "updates_per_day = '31231213.9'".

A4 ESUPG_IMPANA 130 Meta data for "TABL STXL":  "deletes_per_day = '62.4'"  "inserts_per_day = '212312136.1'"  "table_size_in_gb = '181.681'".

A4 ESUPG_IMPANA 130 Meta data for "TABL STXL":  "index_size_in_gb = '66.063'"  "slt_triggers = '0'"  "non_slt_triggers = '0'".

A4 ESUPG_IMPANA 001 -------------------------------------------------------------------------

A3WESUPG_IMPANA 204 Change recording for "TABL ARFCSDATA" will produce up to "4599429" log records per day.

A3WESUPG_IMPANA 205 Log table for "TABL ARFCSDATA" is estimated to grow by up to "1.012" GB per day.

A3WESUPG_IMPANA 201 "TABL ARFCSDATA" must be untriggered, but has "1" SLT trigger(s) on ref. system "PRD".

A4 ESUPG_IMPANA 130 Meta data for "TABL ARFCSDATA":  "tabclass = 'TRANSP'"  "sqltab = ''"  "contflag = 'L'".

A4 ESUPG_IMPANA 130 Meta data for "TABL ARFCSDATA":  "package = 'SRFC'"  "component = 'SAP_BASIS'"  "version = '740'".

A4 ESUPG_IMPANA 130 Meta data for "TABL ARFCSDATA":  "sp_level = '0009'"  "switch = 'X'"  "changerec = 'X'".

A4 ESUPG_IMPANA 130 Meta data for "TABL ARFCSDATA":  "britype = ''"  "readonly = ''"  "updates_per_day = '1123121.0'".

A4 ESUPG_IMPANA 130 Meta data for "TABL ARFCSDATA":  "deletes_per_day = '3151814.9'"  "inserts_per_day = '324493.4'"  "table_size_in_gb = '450.033'".

A4 ESUPG_IMPANA 130 Meta data for "TABL ARFCSDATA":  "index_size_in_gb = '79.554'"  "slt_triggers = '1'"  "non_slt_triggers = '0'".

A4 ESUPG_IMPANA 001 -------------------------------------------------------------------------

A3WESUPG_IMPANA 204 Change recording for "TABL ARFCSSTATE" will produce up to "5788720" log records per day.

A3WESUPG_IMPANA 205 Log table for "TABL ARFCSSTATE" is estimated to grow by up to "1.250" GB per day.

A3WESUPG_IMPANA 201 "TABL ARFCSSTATE" must be untriggered, but has "1" SLT trigger(s) on ref. system "PRD".

A4 ESUPG_IMPANA 130 Meta data for "TABL ARFCSSTATE":  "tabclass = 'TRANSP'"  "sqltab = ''"  "contflag = 'L'".

A4 ESUPG_IMPANA 130 Meta data for "TABL ARFCSSTATE":  "package = 'SRFC'"  "component = 'SAP_BASIS'"  "version = '740'".

A4 ESUPG_IMPANA 130 Meta data for "TABL ARFCSSTATE":  "sp_level = '0009'"  "switch = 'X'"  "changerec = 'X'".

A4 ESUPG_IMPANA 130 Meta data for "TABL ARFCSSTATE":  "britype = ''"  "readonly = ''"  "updates_per_day = '4311212.0'".

A4 ESUPG_IMPANA 130 Meta data for "TABL ARFCSSTATE":  "deletes_per_day = '244114.6'"  "inserts_per_day = '1233393.4'"  "table_size_in_gb = '235.006'".

A4 ESUPG_IMPANA 130 Meta data for "TABL ARFCSSTATE":  "index_size_in_gb = '118.000'"  "slt_triggers = '1'"  "non_slt_triggers = '0'".

A4 ESUPG_IMPANA 001 -------------------------------------------------------------------------

A4 ESUPG_IMPANA 301 Cloned tables on ref. system "PRD" require add. DB space of "1130.337" GB.

A3WESUPG_IMPANA 302 Log tables on ref. system "PRD" will grow by up to "75.865" GB/day.

A4 ESUPG_IMPANA 311 "4" table(s) will be cloned:      "0" error(s), "0" warning(s), "0" info(s).

A3WESUPG_IMPANA 312 "4" table(s) will be recorded:    "0" error(s), "4" warning(s), "0" info(s).

A3WESUPG_IMPANA 313 "4" table(s) must be untriggered: "0" error(s), "3" warning(s), "0" info(s).

A4 ESUPG_IMPANA 001 -------------------------------------------------------------------------

A3WESUPG_IMPANA 008 Report "RSUPG_RUN_IMPACT_ANALYSIS" successfully finished

A4 ESUPG 001 -------------------------------------------------------------------------

A4 ESUPG 002 " "

A4 ESUPG 301 Report name ...: "RSUPG_RUN_IMPACT_ANALYSIS"

A4 ESUPG 304 Start time.....: "19.09.2017" "14:07:03"

A4 ESUPG 305 End time ......: "19.09.2017" "14:11:12"

A4 ESUPG 002 " "

A4 ESUPG 001 -------------------------------------------------------------------------
How to use it for ZDO (Zero Downtime Option)?
The Zero Downtime Option for SAP S/4HANA is generally available. For details, check SAP Note 2707731 and SAP Community blog Zero Downtime Option for SAP S/4HANA is Now Generally Available.
A technical system downtime during an update can be expensive. For this reason, the ideal solution would be to run an update without having a technical system downtime. The idea of ZDO is to have a bridge subsystem in parallel with the upgrade subsystem.
During the maintenance event, users can continue their work on the bridge subsystem. The bridge subsystem contains all data of the production system that users need to continue their work. It's important that all data which comes along with the update must be hidden for the business users. Therefore, all database tables touched by the upgrade (e.g. by importing new table content, structural changes of database table, etc.) must be cloned. This prevents the bridge subsystem running on the source release, of seeing data that belongs to the target release.
With the Impact Analysis for ZDO you can get the answer for the following key figures:
- Read-only restrictions for end users on the bridge instance
- Database triggers might have to be removed from certain tables
- Additional DB space requirements due to table cloning
- Tables that will be smart-switched but have a high number of changes
Here's the three-step-approach how the impact analysis works for ZDO. If the statistical data is not provided in the right format, SUM will stop with an error in phase RUN_IMPACT_ANALYSIS_ZDO.

To make use of the Impact Analysis you've to export the statistical data from your production system first. The file must be uploaded and provisioned to the save directory of Software Update Manager.
The idea is rather simple: SUM known which tables are touched by the update. Based on this information all tables (SAP owned and customer tables) will be classified. The most important table classifications are:
- Share [upgrade does not touch the table]
- Clone [e.g. upgrade delivers table content]
- Clone read-only [e.g. upgrade delivers a complex structural change]
Now, with the statistical data of your production it can be compared whether any of the tables either have database triggers, are very large, or will be set to read-only. As mentioned above, all cases can have a severe business impact.
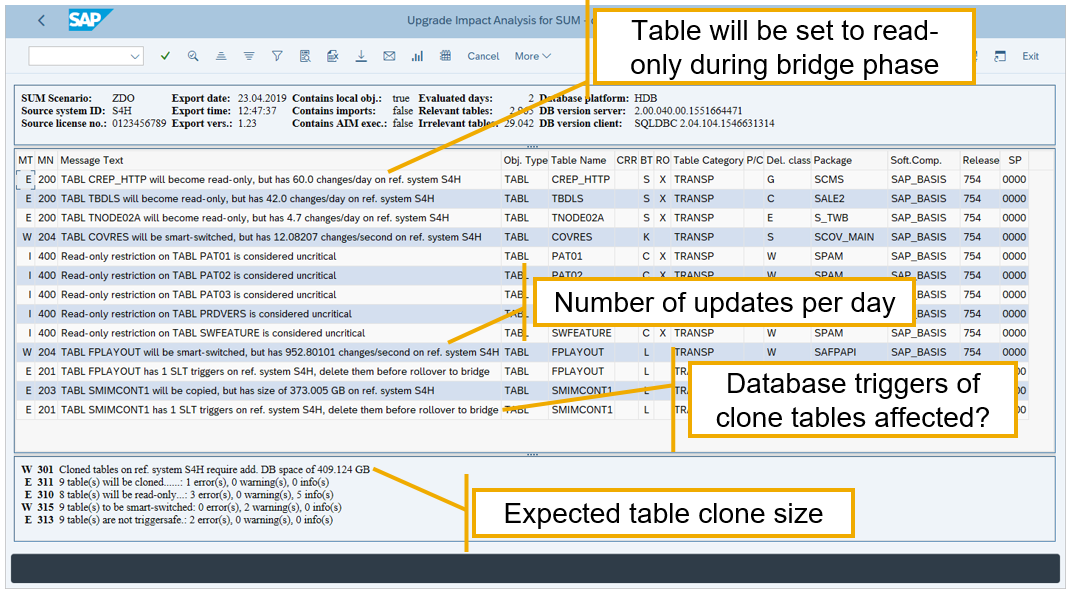
The next picture shows you how the Impact Analysis works:

You can see in this example that Table-B will be cloned and set to read-only for the bridge [business users might be affected]. Read-only tables cannot be written by the bridge subsystem. If the statistics file provided to SUM shows that the Table-B has write access a warning or an error will be displayed. The result need to be interpreted in a way to see whether the bridge really needs to write into the table. You've to try to figure out which business processes writes into the table. If the process is identified it must be checked with the responsible administrators and key users whether the impact would really be critical if it occurred on the production system.
Table-D will also be cloned, but fully available with read and write accesses for the bridge. Hence there's no read-only conflict for Table-D. As Table-D will be cloned and has a database trigger, this trigger need to be dropped. Dropping database triggers may have also an impact on the business. Additionally, Table-D will be smart-switched due to the fact that the table is getting cloned. Smart-switch tables will be renamed on-the-fly which also can lead to critical situaitons since renaming tables require an exclusive lock for the database object.
Besides the described business impacts, we got some more nice key figures with the Impact Analysis result:
- Estimation of addition database space for clone tables
- Number of large tables to be cloned
With the latest version of SUM 2.0, the Impact Analysis of ZDO will be triggered by SUM in the background, and write the results into the following log file:
<SUM>/abap/log/IMPANAUPG.<SID>
If you'd like to repeat the Impact Analysis with different statistics files (e.g. cw 2, cw 3, ...) or play around with the threshold parameters, you can use the dialog report RSUPG_RUN_IMPACT_ANALYSIS_DIA. The report will be executed either on the original (before you reached the bridge reconnect), or on the bridge system:
FAQ
1) The message 'SUPG_IMPANA 301' shows 'Cloned tables on ref. system "SID" require add. DB space of "2.582" GB'. Which decimal seperator is used by the Impact Analysis?
The decimal notation is retrieved from the user data (transaction code SU3). In this example, the decimal notation is set to 1,234,567.89. The addition space needed is '2 GB and 582 MB'.
If you've set your decimal notation to 1.234.567,89, the output would be like 'Cloned tables on ref. system "SID" require add. DB space of "2,582" GB'.
2) What's behind the 'add. DB space' required for 'cloned tables'?
The addional space is needed for tables handled by uptime processing. In ZDO, all tables touched and changed by SUM have to be cloned. In nZDM, only certain tables will be moved to the uptime handling. This is mainly influenced by the table size and the default threshold of isu_max_tab_size which is set to 50GB.
3) How do I interpret the message SUPG_IMPANA 313 '"875" table(s) must be trigger-free: "0" error(s), "0" warning(s), "0" info(s)'?
The Impact Analysis checks of SLT triggers are created for tables. In nZDM, SLT triggers for tables that have to be converted, need to be dropped before the downtime starts. In this example, the 875 tables in the summary must not have any database trigger (e.g. SLT trigger). However, the Impact Analysis cross-checked the tables based on the provided statistics and 0 triggers have to be dropped because. So, in this example there's no business impact since no triggers have to be dropped. In other words: there are 0 errors and 0 warnings; none of these tables seems to have database triggers. Thus, there is no issue, and it is safe to continue.
4) How do I interpret the message A2EESUPG_IMPANA 220 "TABL ZARIXBC1" not classified despite "22718.0" changes/day on ref. system "PRD?
Tables that were exported from the source system (in this case PRD) as a so-called relevant table are analyzed by the Impact Analysis in the system where the tool runs (e.g. in the sandbox system). If a particular table (in this case ZARIXBC1) is not present in the sandbox this error message comes up. Since the table is not present, there's no classification result. To make the customer aware of the discrepancy this error message is raised. Hypothetically, the table could become a read-only classification in PRD. Hence, we'd recommend not to have a discrepancy of tables across the landscape.
Additional information
Export of table statistics for the Impact Analysis (all use-cases)
- SAP Note 2402270 - Export of Table Statistics for SUM Impact Analysis
- SAP Note 3092738 – Software Update Manager Toolbox – Central SAP Note
- Software Update Manager Toolbox is Available Now
nZDM: near-Zero Downtime Maintenance
- FAQ - near Zero Downtime Maintenance (nZDM) ABAP
- SAP Note 1678564 - Restrictions, Database-specific Settings, and Troubleshooting of nZDM for SUM
- Introducing the new CRR Control Center to monitor Record & Replay in SUM 2.0
- SAP Note 2476860 - SUM Impact Analysis for nZDM
ZDO: Zero Downtime Option of SUM
- Zero Downtime Option for SAP S/4HANA is Now Generally Available
- SAP Note 2707731 - Prerequisites and restrictions of Zero Downtime Option of SUM for SAP S/4HANA
- SAP Note 2471883 - SUM Impact Analysis for ZDO
SLT Trigger handling
Jens Fieger
Product Management SAP SE, Software Logistics
- SAP Managed Tags:
- software logistics toolset,
- Software Logistics - System Maintenance
Labels:
You must be a registered user to add a comment. If you've already registered, sign in. Otherwise, register and sign in.
Labels in this area
-
ABAP CDS Views - CDC (Change Data Capture)
2 -
AI
1 -
Analyze Workload Data
1 -
BTP
1 -
Business and IT Integration
2 -
Business application stu
1 -
Business Technology Platform
1 -
Business Trends
1,661 -
Business Trends
87 -
CAP
1 -
cf
1 -
Cloud Foundry
1 -
Confluent
1 -
Customer COE Basics and Fundamentals
1 -
Customer COE Latest and Greatest
3 -
Customer Data Browser app
1 -
Data Analysis Tool
1 -
data migration
1 -
data transfer
1 -
Datasphere
2 -
Event Information
1,400 -
Event Information
64 -
Expert
1 -
Expert Insights
178 -
Expert Insights
273 -
General
1 -
Google cloud
1 -
Google Next'24
1 -
Kafka
1 -
Life at SAP
784 -
Life at SAP
11 -
Migrate your Data App
1 -
MTA
1 -
Network Performance Analysis
1 -
NodeJS
1 -
PDF
1 -
POC
1 -
Product Updates
4,577 -
Product Updates
323 -
Replication Flow
1 -
RisewithSAP
1 -
SAP BTP
1 -
SAP BTP Cloud Foundry
1 -
SAP Cloud ALM
1 -
SAP Cloud Application Programming Model
1 -
SAP Datasphere
2 -
SAP S4HANA Cloud
1 -
SAP S4HANA Migration Cockpit
1 -
Technology Updates
6,886 -
Technology Updates
398 -
Workload Fluctuations
1
Related Content
- SAP Enable Now setup in Technology Blogs by Members
- Part 2:- SAP Basis OS support on SUSE Linux for beginners in Technology Blogs by Members
- Consume Ariba APIs using Postman in Technology Blogs by SAP
- Deep dive into Q4 2023, What’s New in SAP Cloud ALM for Implementation Blog Series in Technology Blogs by SAP
- ML- Linear Regression definition , implementation scenarios in HANA in Technology Blogs by Members
Top kudoed authors
| User | Count |
|---|---|
| 11 | |
| 10 | |
| 9 | |
| 9 | |
| 7 | |
| 7 | |
| 7 | |
| 6 | |
| 6 | |
| 5 |