- SAP Community
- Products and Technology
- Technology
- Technology Blogs by SAP
- Monitoring and tuning Java applications deployed o...
Technology Blogs by SAP
Learn how to extend and personalize SAP applications. Follow the SAP technology blog for insights into SAP BTP, ABAP, SAP Analytics Cloud, SAP HANA, and more.
Turn on suggestions
Auto-suggest helps you quickly narrow down your search results by suggesting possible matches as you type.
Showing results for
Employee
Options
- Subscribe to RSS Feed
- Mark as New
- Mark as Read
- Bookmark
- Subscribe
- Printer Friendly Page
- Report Inappropriate Content
02-17-2018
1:01 PM
The aim of this post is to explain how to help you monitoring Java applications deployed on SCP.
First of all, let's go through the main monitoring built-in functionalities available and clearly visible and then we will go through the advanced functionalities which may be a bit hidden but are very important and valuable to use.
Step1 : Using the main monitoring built-in functionalities available and clearly visible
In order to monitor such metrics, that's the probably easiest to get.
They are available within the cockpit whenever a Java application is deployed:
First of all, go to the Java applications:

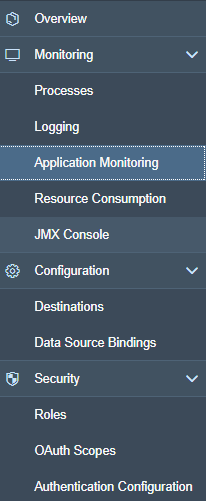
Click on your Java application that you need to monitor. Then the following navigation menu displays as per below:

Then, this is where the interesting part starts 🙂
Clicking on the Application Monitoring will display the following graphs:
Each graph can be zoomed-in in order to check for a specific timeframe or sometimes, it is useful whenver it is required to adjust the scale such for example once a very high response time appeared and it is not then possible to see the details later on.
Step 2 : Using advanced monitoring built-in functionalities available and not visible cleary
There is a huge of valuable monitoring information avaiable from the JMX console.
The JMX console is accessible in the navigation as below:

Then, a folder hierarchy like structure will appear.

Now, let's go the most important metrics from the JMX console (... or at least the ones I could find the most useful for me once monitoring) .
Once monitoring a live system or also a system where we put some load for example for performance and stress tests, it is always a good idea to monitor it and make sure we do not run into a performance bottleneck in this area.
In order to monitor it, you need to browser into the following level:
com.sap.cloud.jmx -> Persistence -ConnectionPools:

Once monitoring a system, these information above are very precious.
Below, the most critical metrics in my view:
There are others metrics which can also show how much time threads have been waiting to get a connection and which could also be a good indicator to help you sizing properly the number of maxium connections to set in the pool.
As for all Java applications, it is sometimes required to be able to trigger thread dumps to analyze locking situation issues/hanging situations. Therefore, it is also possible
2461379 - How to Trigger a Thread Dump for Java Applications on SCP( SAP Cloud Platform)
The previous KBA/Note will also explain you how to download the thread dumps then and analyze them.
In order to analyze them, I will then recommend you to use the SAP Thread Dump Viewer tha you can also find below:
1020246 - Thread Dump Viewer for SAP Java Engine
It is possible to analyze the Garbage Collections. To do so, you can review them from the SCP cockpit from the Logging and then in the section 'Garbage Collection Logs':

You can the either visualize it online from the cockpit or download the file itself and open it with your prefered GC viewer log.
Below, is the reference guide how to configure VM arguments:
Configuring VM arguments
You can for example fine tune the JVM parameters if you wish to increase the heap memory/resize the new area, etc...
Another useful guide is the one to deploy using the neo command line:
https://help.hana.ondemand.com/mavenSite/deploy-mojo.html
I will keep enriching this blog... therefore stay tuned...
First of all, let's go through the main monitoring built-in functionalities available and clearly visible and then we will go through the advanced functionalities which may be a bit hidden but are very important and valuable to use.
Step1 : Using the main monitoring built-in functionalities available and clearly visible
- Monitoring physical resources such CPU, Memory, Disk I/O:
In order to monitor such metrics, that's the probably easiest to get.
They are available within the cockpit whenever a Java application is deployed:
First of all, go to the Java applications:

Click on your Java application that you need to monitor. Then the following navigation menu displays as per below:

Then, this is where the interesting part starts 🙂
Clicking on the Application Monitoring will display the following graphs:
- Average Response Time (ms)
- Busy Threads
- CPU Load (%)
- Disk I/O (B/s)
- Free EBS Space (%)
- Heap Memory Usage (%)
- OS Memory Usage (%)
- Requests per Minute (requests)
- Used Disc Space (%)
Each graph can be zoomed-in in order to check for a specific timeframe or sometimes, it is useful whenver it is required to adjust the scale such for example once a very high response time appeared and it is not then possible to see the details later on.
Step 2 : Using advanced monitoring built-in functionalities available and not visible cleary
There is a huge of valuable monitoring information avaiable from the JMX console.
The JMX console is accessible in the navigation as below:

Then, a folder hierarchy like structure will appear.

Now, let's go the most important metrics from the JMX console (... or at least the ones I could find the most useful for me once monitoring) .
- Monitoring the JDBC connection pool:
Once monitoring a live system or also a system where we put some load for example for performance and stress tests, it is always a good idea to monitor it and make sure we do not run into a performance bottleneck in this area.
In order to monitor it, you need to browser into the following level:
com.sap.cloud.jmx -> Persistence -ConnectionPools:

Once monitoring a system, these information above are very precious.
Below, the most critical metrics in my view:
- MaxConnections is the maximum number of connection the pool will open.
- BorrowedConnectionsCount is the number of connections "borrowed" to the application.
- PooledConnectionsCount is the number of connections available in the pool.
There are others metrics which can also show how much time threads have been waiting to get a connection and which could also be a good indicator to help you sizing properly the number of maxium connections to set in the pool.
- Triggering thread dumps:
As for all Java applications, it is sometimes required to be able to trigger thread dumps to analyze locking situation issues/hanging situations. Therefore, it is also possible
2461379 - How to Trigger a Thread Dump for Java Applications on SCP( SAP Cloud Platform)
The previous KBA/Note will also explain you how to download the thread dumps then and analyze them.
In order to analyze them, I will then recommend you to use the SAP Thread Dump Viewer tha you can also find below:
1020246 - Thread Dump Viewer for SAP Java Engine
- Analyzing Garbage Collections:
It is possible to analyze the Garbage Collections. To do so, you can review them from the SCP cockpit from the Logging and then in the section 'Garbage Collection Logs':

You can the either visualize it online from the cockpit or download the file itself and open it with your prefered GC viewer log.
- Setting JVM arguments (neo command line)
Below, is the reference guide how to configure VM arguments:
Configuring VM arguments
You can for example fine tune the JVM parameters if you wish to increase the heap memory/resize the new area, etc...
Another useful guide is the one to deploy using the neo command line:
https://help.hana.ondemand.com/mavenSite/deploy-mojo.html
I will keep enriching this blog... therefore stay tuned...
- SAP Managed Tags:
- Java,
- SAP Business Technology Platform
2 Comments
You must be a registered user to add a comment. If you've already registered, sign in. Otherwise, register and sign in.
Labels in this area
-
ABAP CDS Views - CDC (Change Data Capture)
2 -
AI
1 -
Analyze Workload Data
1 -
BTP
1 -
Business and IT Integration
2 -
Business application stu
1 -
Business Technology Platform
1 -
Business Trends
1,658 -
Business Trends
93 -
CAP
1 -
cf
1 -
Cloud Foundry
1 -
Confluent
1 -
Customer COE Basics and Fundamentals
1 -
Customer COE Latest and Greatest
3 -
Customer Data Browser app
1 -
Data Analysis Tool
1 -
data migration
1 -
data transfer
1 -
Datasphere
2 -
Event Information
1,400 -
Event Information
66 -
Expert
1 -
Expert Insights
177 -
Expert Insights
299 -
General
1 -
Google cloud
1 -
Google Next'24
1 -
Kafka
1 -
Life at SAP
780 -
Life at SAP
13 -
Migrate your Data App
1 -
MTA
1 -
Network Performance Analysis
1 -
NodeJS
1 -
PDF
1 -
POC
1 -
Product Updates
4,577 -
Product Updates
344 -
Replication Flow
1 -
RisewithSAP
1 -
SAP BTP
1 -
SAP BTP Cloud Foundry
1 -
SAP Cloud ALM
1 -
SAP Cloud Application Programming Model
1 -
SAP Datasphere
2 -
SAP S4HANA Cloud
1 -
SAP S4HANA Migration Cockpit
1 -
Technology Updates
6,873 -
Technology Updates
423 -
Workload Fluctuations
1
Related Content
- Supporting Multiple API Gateways with SAP API Management – using Azure API Management as example in Technology Blogs by SAP
- Consuming on-Premise Service in CAP Project in Technology Q&A
- Configuring SAP CI/CD pipeline for Deploying ReactJS application in Cloud Foundry in Technology Q&A
- How to use AI services to translate Picklists in SAP SuccessFactors - An example in Technology Blogs by SAP
- New Certificate Validity Metric to Keep You Updated on Expiring Certificates in the Neo Environment in Technology Blogs by SAP
Top kudoed authors
| User | Count |
|---|---|
| 40 | |
| 25 | |
| 17 | |
| 14 | |
| 8 | |
| 7 | |
| 7 | |
| 7 | |
| 6 | |
| 6 |