
- SAP Community
- Products and Technology
- Technology
- Technology Blogs by SAP
- Looking at SAPUI5 through Network Graph lens
Technology Blogs by SAP
Learn how to extend and personalize SAP applications. Follow the SAP technology blog for insights into SAP BTP, ABAP, SAP Analytics Cloud, SAP HANA, and more.
Turn on suggestions
Auto-suggest helps you quickly narrow down your search results by suggesting possible matches as you type.
Showing results for
Former Member
Options
- Subscribe to RSS Feed
- Mark as New
- Mark as Read
- Bookmark
- Subscribe
- Printer Friendly Page
- Report Inappropriate Content
02-15-2018
3:55 PM
Introduction
In the following text, I’d like to demonstrate abilities of the Network Graph control and its highly customizable layouting feature. You will see how to lay out and render quite large graph structure in several different ways, including a custom one based on an external JavaScript layouting library. For that purpose I will use the SAPUI5 framework content which is familiar to many.
Exploring piece by piece
While working on UI5 controls for the first year one obviously needs to consult . Mostly to explore classes with their properties, methods and events in the “API Reference” section, sometimes to check out Samples for practical code segments and intended usage, but often also about inheritance relations and the overall hierarchy.
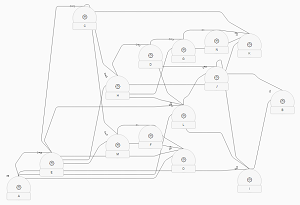
The thing is there’s no bird’s eye view which can often give useful insights about the framework’s architecture and also about possible deficiencies like low modularization and so on. Of course there’s always the option to use third party tools and visualize the structure on your own, which I did and still do using free version of my favorite diagram tool yEd. Here’s an example of one my first mindmaps, created after few weeks of development at SAP, displaying some of the most important classes and dependencies from Base, Core and Model libraries:

And here’s another one created several months later while completely refactoring SmartMultiEdit Field stuff (red entities to be replaced by green):

When I returned to my first mindmap to expand it even more after the development of Network Graph control, I realized that now I have exactly what I need to compose my “big picture”. I just needed some comprehensive UI5 SDK data to feed the graph.
Going dynamic
Obviously the first place to go was the SDK itself. I suspected there could be a JSON file (ideally) with class info from all libraries in one place. And luckily, the first look at the browser’s network communication when browsing SDK revealed our suspect with a convenient name api-index.json:

I checked the file for its content and instantly knew that’s exactly what I’m looking for - there are namespaces, classes, interfaces and enumerators intermingled, but all the necessary info is there. Looks like this (just a redacted chunk to fit in here nicely):
{

	"$schema-ref": "http://schemas.sap.com/sapui5/designtime/api.json/1.0",

	"version": "1.53.0-SNAPSHOT",

	"library": "*",

	"symbols": [

		{

			"name": "jQuery",

			"kind": "namespace",

			"visibility": "public",

			"lib": "sap.ui.core"

		},{

			"name": "sap.ui.core.CalendarType",

			"kind": "enum",

			"visibility": "public",

			"lib": "sap.ui.core"

		},{

			"name": "sap.ui.base.Poolable",

			"kind": "interface",

			"visibility": "public",

			"lib": "sap.ui.core"

		},{

			"name": "sap.ui.core.Component",

			"kind": "class",

			"visibility": "public",

			"extends": "sap.ui.base.ManagedObject",

			"lib": "sap.ui.core"

		},{
Before going further I couldn’t wait to see how many entities there actually are of different kind, which came out like this:
| Namespaces | 196 |
| Interfaces | 47 |
| Enums | 344 |
| Classes | 1418 |
Now we have everything to put it together and create an explored sample (well, I never went so far to publish it). I threw in a very simple view with Network Graph control along with its Graph Map companion:
	<l:FixFlex vertical="true">

		<l:flexContent>

			<m:FlexBox fitContainer="true" renderType="Bare" wrap="Wrap" id="graphWrapper">

				<m:items>

					<Graph id="graph" nodes="{/nodes}" lines="{/lines}" groups="{/groups}">

						<layoutData>

							<m:FlexItemData growFactor="1" shrinkFactor="1" baseSize="0%" minWidth="300px"/>

						</layoutData>

						<nodes>

							<Node key="{key}" title="{title}" group="{group}" shape="Box" width="200"/>

						</nodes>

						<lines>

							<Line from="{from}" to="{to}"/>

						</lines>

						<groups>

							<Group key="{key}" title="{title}" collapsed="{collapsed}"/>

						</groups>

					</Graph>

					<GraphMap id="map" graph="graph">

						<layoutData>

							<m:FlexItemData minWidth="200px" maxWidth="25%"/>

						</layoutData>

					</GraphMap>

				</m:items>

			</m:FlexBox>

		</l:flexContent>

	</l:FixFlex>
And then an utterly simple controller:
var oPageController = Controller.extend("sap.suite.ui.commons.sample.NetworkGraphUI5.NetworkGraph", {

	onInit: function () {

		var oModel = new JSONModel();

		oModel.setSizeLimit(Number.MAX_SAFE_INTEGER);

		$.getJSON(jQuery.sap.getModulePath("sap.suite.ui.commons.sample.NetworkGraphUI5", "/api-index.json"), function (data) {

			var aClasses = data.symbols.filter(function (oSymbol) {

					return oSymbol.kind == "class";

				}),

				aQueueToBrowse = aClasses.filter(function (oClass) {

					return !oClass.extends

				}),

				aNodes = [], aGroups = [], aLines = [], aGroupLookup = [], oPivot, sTitle, sGroupName;


			while (aQueueToBrowse.length > 0) {

				oPivot = aQueueToBrowse.shift();

				sTitle = oPivot.name.split(".").pop();

				sGroupName = oPivot.name.replace("." + sTitle, ""); // namespace, oPivot.lib for library


				aNodes.push({key: oPivot.name, title: sTitle, group: sGroupName, description: sGroupName});

				if (!aGroupLookup.includes(sGroupName)) {

					aGroupLookup.push(sGroupName);

					aGroups.push({key: sGroupName, title: sGroupName});

				}

				if (oPivot.extends) {

					aLines.push({from: oPivot.extends, to: oPivot.name});

				}


				aClasses

					.filter(function (oClass) {

						return oClass.extends === oPivot.name;

					})

					.forEach(function (oNew) {

						aQueueToBrowse.push(oNew);

					});

			}


			oModel.setData({nodes: aNodes, lines: aLines, groups: aGroups});

			this.getView().setModel(oModel);

		}.bind(this));

	}

});
That’s pretty much what it takes to display the whole tree (or lattice to be precise) of SAPUI5 in a browser. I was anxious to see the result but when it rendered in about 10 seconds what was shown was a very ugly tree with surprisingly flat structure. Since it spans several screens even when zoomed out at 5%, let’s just have a look at its middle third:
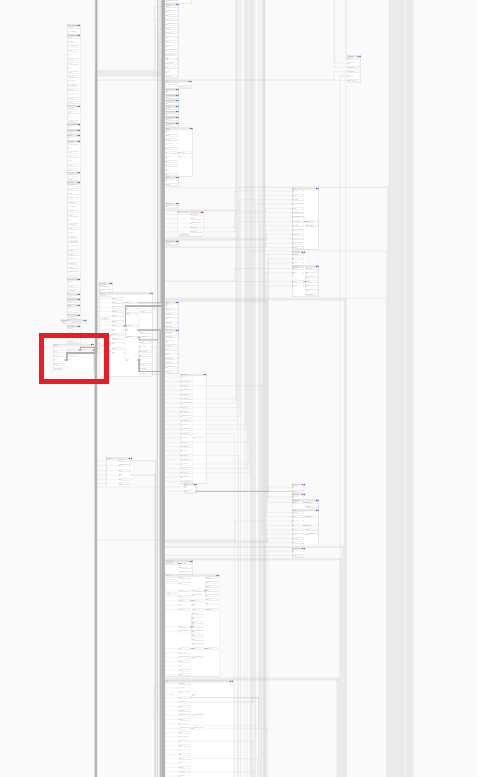
I highlighted the sap.ui.base package with the red rectangle. That’s where the root of the tree – BaseObject – resides. It was apparent that to have a clearer view, a lot of fat (meaning “fringe” packages) need to be cut off. But before doing so, I tried Force-based layout. That’s the second standard layouting algorithm. What a beautiful dandelion flower came out of it! But, seriously, it just confirmed the feeling from the layered result that modularization is, well, not that good. Several overstretched predecessors are described in red and other interesting classes in blue because the zoom is too big to read labels:

Many other intriguing facts are quickly revealed with these visualizations when combined with SDK info:
- There is an archipelago (mostly out of view here) of standalone classes not inheriting from BaseObject – some 155 of them – in many cases not sure why.
- Also there are twin SemanticButton classes – one from sap.m and the other from sap.f - with nearly identical set of successors and nearly identical code, neither of which is deprecated or reference the other. Seems like awful code duplication so far.
- And one more thing – the best modularization can be seen in packages that are rather abstract then UI based, like the DataType in the upper right side.
Playing with the scope
Getting back to layered layout, as I pointed out above we need to cull the herd to get a clearer view. Let’s start with filtering out every package and class that are specific enough – the likes of sap.gantt, sap.tnt, sap.uiext.inbox, sap.uxap, sap.viz and many others. At the same time group by namespaces rather than libraries (more granular). This way we get something more readable then the first attempt:

There’s still one modularization killer and that’s sap.m. Highlighted in red, stretching over half the middle layer, it even spills over the bottom of the screen. This means that even if one only needs controls like Label, CheckBox, Input and Popover, without any lists or personalization, the browser is loading dozens and dozens of List-based or P13n-based classes.
Now, let’s collapse the sap.m mammoth sized group and similarly flat sap.suite.ui, avoid classes not extending BaseObject and check again. Now that’s pretty much what I was looking for in the first place – all the core classes and realtions, the biggest group/namespace being sap.ui.core:

Custom Layout
Now that we have gone this far with built-in layouting algorithms, let’s have a look at how to easily add your own. We will pick a third party JavaScript library that can arrange graphs in layers and plug it in to our Network Graph control. There are actually not many of those, because the most popular group of algorithms is the force-based one. That group on the other hand is not that interesting, because its results rarely differ from one to another given that they all use common laws of physics.
One of the libraries out there which was originally considered to be used as a main layouting engine for our control is Dagre. You can see comparison of its abilities with KLayJS library – which is currently used in Network Graph – here, including a verdict why give precedence to KLayJS library:
| KLayJS | Dagre |
 |  |
 |  |
 |  |
Here's the list of properties that disqualifies Dagre:
- It doesn't support groups and doesn’t provide lines-only tracing.
- It has only one style of lines tracing that is not even the rectangular one we require, but rather some free form Bezier curve skeleton as can be seen above.
- It has worse performance and also considerably worse crossings optimization than KLayJS.
Easily the main reason it was not selected is that it doesn’t properly support groups, so removal of group definitions from model is the first step here. See the commented lines in the code block below from the controller defined above:
	aNodes.push({key: oPivot.name, title: sTitle, /*group: sGroupName,*/ description: sGroupName});

	// if (!aGroupLookup.includes(sGroupName)) {

	// 	aGroupLookup.push(sGroupName);

	// 	aGroups.push({key: sGroupName, title: sGroupName});

	// }

	if (oPivot.extends) {

		aLines.push({from: oPivot.extends, to: oPivot.name});

	}
Now to the new layout implementation. First of all we need the Dagre library itself, which can be found here https://dagrejs.github.io/project/dagre/latest/dagre.js. Download it and add it to the suite.ui.commons.Network Graph.layout package. After that, as a next step we need a new descendant of the LayoutAlgorithm abstract class, so add new DagreLaoyout.js file into the same package with the following simple stub:
sap.ui.define([

	"./LayoutAlgorithm",

	"./LayoutTask"

], function (LayoutAlgorithm, LayoutTask) {

	var DagreLayout = LayoutAlgorithm.extend("sap.suite.ui.commons.networkgraph.layout.DagreLayout", {

		constructor: function () {

			LayoutAlgorithm.apply(this, arguments);

			jQuery.sap.require("sap/suite/ui/commons/networkgraph/layout/dagre");

		}

	});


	DagreLayout.prototype.isLayered = function () {

		return true;

	};


	DagreLayout.prototype.layout = function () {

		return new LayoutTask(function (fnResolve, fnReject, oLayoutTask) {

			var oGraph = this.getParent();

			this.oDagre = new dagre.graphlib.Graph();


			fnResolve();

		}.bind(this));

	};


	return DagreLayout;

});
Because we are implementing a layered type of algorithm, the isLayered method has to return true. The layout method is responsible for layouting itself, which basically means assigning coordinates to nodes and lines of the Network Graph instance. That instance is retrievable as a parent inside the LayoutTask instance, as you can see above on the line 18.
Using such a third party library usually consists of three steps
- Converting Network Graph definition into a third party structure
- Running layout – devise all the necessary coordinates
- Extracting coordinates of nodes, lines and groups from the third party structure and passing them to Network Graph
Implementation of these three steps for Dagre library is very straightforward as can be seen in the code block below (the three steps are identified by comments). This is not always the case as can be seen in the built-in LayeredLayout class implementation where a lot of postprocessing is needed to accommodate groups with their margins and headers among other things.
	var oGraph = this.getParent(),

		oDagreNode, oDagreEdge, oOriginNode, oOriginLine, oFromNode, oToNode,

		sId, iCounter;

	this.oGraph = oGraph;

	this.oDagre = new dagre.graphlib.Graph();

	this.oDagre.setGraph({});

	this.mLineMap = {};


	// STEP 1 - Converting NetworkGraph definition into a Dagre one

	oGraph.getNodes().forEach(function (oNode) {

		this.oDagre.setNode(

			oNode.getKey(),

			{label: oNode.getTitle(), width: oNode.getWidth(), height: oNode.getHeight()});

	}.bind(this));

	oGraph.getLines().forEach(function (oLine) {

		this.oDagre.setEdge(oLine.getFrom(), oLine.getTo());

		sId = oLine.getFrom() + "->" + oLine.getTo();

		this.mLineMap[sId] = oLine;

	}.bind(this));


	// STEP 2 - Running layout

	dagre.layout(this.oDagre, {rankdir: "lr"});


	// STEP 3 - Extracting coordinates of nodes and lines from Dagre and setting them to NetworkGraph

	this.oDagre.nodes().forEach(function (sNode) {

		oDagreNode = this.oDagre.node(sNode);

		oOriginNode = this.oGraph.getNodeByKey(sNode);

		oOriginNode.setX(oDagreNode.x);

		oOriginNode.setY(oDagreNode.y);

	}.bind(this));

	this.oDagre.edges().forEach(function (oEdge) {

		oDagreEdge = this.oDagre.edge(oEdge);

		oOriginLine = this.mLineMap[oEdge.v + "->" + oEdge.w];


		oFromNode = this.oGraph.getNodeByKey(oEdge.v);

		oToNode = this.oGraph.getNodeByKey(oEdge.w);

		oOriginLine.setSource({x: oFromNode.getCenterPosition().x, y: oFromNode.getCenterPosition().y});

		oOriginLine.setTarget({x: oToNode.getCenterPosition().x, y: oToNode.getCenterPosition().y});


		oOriginLine.clearBends();

		oDagreEdge.points.forEach(function(oPoint) {

			oOriginLine.addBend(oPoint);

		}.bind(this));

	}.bind(this));


	fnResolve();
At this point we are almost done, no more work or code really is needed. In order to apply the new layouter in our example let’s extend the controller’s onInit method with just two lines and an appropriate import addition, see below:
sap.ui.define([

	"sap/ui/core/mvc/Controller",

	"sap/ui/model/json/JSONModel",

	"sap/suite/ui/commons/networkgraph/layout/LayeredLayout",

	"sap/suite/ui/commons/networkgraph/layout/ForceBasedLayout",

	"sap/suite/ui/commons/networkgraph/layout/LayoutTask",

	"sap/suite/ui/commons/networkgraph/layout/DagreLayout",

], function (Controller, JSONModel, LayeredLayout, ForceBasedLayout, LayoutTask, DagreLayout) {


	var oPageController = Controller.extend("sap.suite.ui.commons.sample.NetworkGraphUI5.NetworkGraph", {

		onInit: function () {


			/* HIDDEN ORIGINAL CODE OF INIT METHOD */


			var oGraph = this.getView().byId("graph");

			oGraph.setLayoutAlgorithm(new DagreLayout());

		}

	});


	return oPageController;

});
When we now refresh our app in the browser we will get the SAPUI5 class tree rendered by Dagre library. Since there are no groups, very low modularization and Dagre layouts tree-like structures in a very dense manner the rendering comes out extremely vertically (or horizontaly depending on the Dagre configuration) flat. The result is shown below with two levels of zoom:

Obviously this is objectively inferior result to the one produced by KLayJS library, nevertheless you get the picture how easily one can customize Network Graph to layout graph in pretty much any way desired.
In the same way, we can replace built-in force-based layout algorithm with one of the freely available online or write our own. Using an available algorithm such as KLayJS or Dagre is easier than writing your own layered algorithm by order of magnitude.
Conclusion
I hope I’ve been able to demonstrate that Network Graph is quite convenient control, having on one hand two built-in carefully designed layouting algorithms - one layered based on KLayJS library and one force-based utilizing D3 library - which can provide interesting insights into any graph-like structures one is able to convert to its straightforward model. And on the other hand is open to plug-in any third party library or to implement your own layouting algorithm from scratch with ease. You can even combine all the features above to get your specific results, often with just dozens of lines of code.
- SAP Managed Tags:
- SAPUI5
2 Comments
You must be a registered user to add a comment. If you've already registered, sign in. Otherwise, register and sign in.
Labels in this area
-
ABAP CDS Views - CDC (Change Data Capture)
2 -
AI
1 -
Analyze Workload Data
1 -
BTP
1 -
Business and IT Integration
2 -
Business application stu
1 -
Business Technology Platform
1 -
Business Trends
1,661 -
Business Trends
88 -
CAP
1 -
cf
1 -
Cloud Foundry
1 -
Confluent
1 -
Customer COE Basics and Fundamentals
1 -
Customer COE Latest and Greatest
3 -
Customer Data Browser app
1 -
Data Analysis Tool
1 -
data migration
1 -
data transfer
1 -
Datasphere
2 -
Event Information
1,400 -
Event Information
65 -
Expert
1 -
Expert Insights
178 -
Expert Insights
282 -
General
1 -
Google cloud
1 -
Google Next'24
1 -
Kafka
1 -
Life at SAP
784 -
Life at SAP
11 -
Migrate your Data App
1 -
MTA
1 -
Network Performance Analysis
1 -
NodeJS
1 -
PDF
1 -
POC
1 -
Product Updates
4,577 -
Product Updates
330 -
Replication Flow
1 -
RisewithSAP
1 -
SAP BTP
1 -
SAP BTP Cloud Foundry
1 -
SAP Cloud ALM
1 -
SAP Cloud Application Programming Model
1 -
SAP Datasphere
2 -
SAP S4HANA Cloud
1 -
SAP S4HANA Migration Cockpit
1 -
Technology Updates
6,886 -
Technology Updates
408 -
Workload Fluctuations
1
Related Content
- ABAP Cloud Developer Trial 2022 Available Now in Technology Blogs by SAP
- SAP Analytics Cloud - Performance statistics in Technology Blogs by SAP
- SAP B1 Service layer: windows service permissions in Technology Q&A
- Kyma Integration with SAP Cloud Logging. Part 2: Let's ship some traces in Technology Blogs by SAP
- BTP Apps & Saving Outputs to Local Network Storage in Technology Q&A
Top kudoed authors
| User | Count |
|---|---|
| 13 | |
| 11 | |
| 11 | |
| 10 | |
| 9 | |
| 7 | |
| 6 | |
| 5 | |
| 5 | |
| 5 |