
- SAP Community
- Products and Technology
- Technology
- Technology Blogs by SAP
- SAP Analytics Cloud & IBCS Top 10 (Part 1)
Technology Blogs by SAP
Learn how to extend and personalize SAP applications. Follow the SAP technology blog for insights into SAP BTP, ABAP, SAP Analytics Cloud, SAP HANA, and more.
Turn on suggestions
Auto-suggest helps you quickly narrow down your search results by suggesting possible matches as you type.
Showing results for
IngoH
Active Contributor
Options
- Subscribe to RSS Feed
- Mark as New
- Mark as Read
- Bookmark
- Subscribe
- Printer Friendly Page
- Report Inappropriate Content
02-07-2018
5:50 PM
In the first part of this, we looked at the value of following a visualization and notation standard like IBCS.
This time we will start looking at the Top 10 from IBCS. You can view a poster of the Top 10 here.

To start with, we will look at the Top 1 - Messages and Top 2 - Title requirements and recommendations and take a closer look how we can use SAP Analytics Cloud to make sure we are as conform as we can be and follow the recommendations.
So lets start with the Message. So the message of your report or your visualization should be the top element and should be basically what the user will see first.
Here an example of a recommended structure for your visualization.

As you can see the message becomes the Top element. Here an example from the openSAP Course:

The message should provide details on what is shown to the user. This could be in form as shown in the example above, where we talk about the forecast numbers and what we expect to happen, or it is a message that explains the critical values or even make a suggestion and include a concrete action.
Important, the message is not there to explain all numbers the user can see and explain the complete chart. The message is not a full paragraph outlining every detail that might be off interest but instead the message should be a maximum of 2 lines - so as author you should think carefully what the most important message is you want to provide.
As you can see in the previous example for the message, the title in the chart is not just a typical title mentioning the measure, but instead the title should include at minimum the following information:
So here an example of a good title.

It shows the company name, measure name, Currency, scaling information, and the used timeframe and measure types.
So how does SAP Analytics Cloud help you to implement all these recommendations as part of your next story ?
When you start your next story, please note the templates that are available.

Some of these templates have been designed with the IBCS standards in mind. For example the Report template is making several recommendations based on the IBCS standards and you can choose from a variety of layouts.

The message of your report is basically a text right now, but for the title we can make use of an interesting option in SAP Analytics Cloud, which is the dynamic text - and SAP Analytics Cloud even takes care off it by default.
For example, when you create a new chart, you will automatically get a chart title that includes the measure, the used dimension, and the currency, and the scaling information.
In case you would wanted to create a similar text yourself you can use the Text option (Menu Insert) and include dynamic information.

Here you can choose from a variety of dynamic elements,which you can then include into your text.
This covers the Top 1 and Top 2. In the next blog we will take a closer look and 3 and 4.
References
openSAP Online Course - Semantic Notation
Hichert.com
IBCS
This time we will start looking at the Top 10 from IBCS. You can view a poster of the Top 10 here.
To start with, we will look at the Top 1 - Messages and Top 2 - Title requirements and recommendations and take a closer look how we can use SAP Analytics Cloud to make sure we are as conform as we can be and follow the recommendations.
Top 1 - Message
So lets start with the Message. So the message of your report or your visualization should be the top element and should be basically what the user will see first.
Here an example of a recommended structure for your visualization.
As you can see the message becomes the Top element. Here an example from the openSAP Course:
The message should provide details on what is shown to the user. This could be in form as shown in the example above, where we talk about the forecast numbers and what we expect to happen, or it is a message that explains the critical values or even make a suggestion and include a concrete action.
Important, the message is not there to explain all numbers the user can see and explain the complete chart. The message is not a full paragraph outlining every detail that might be off interest but instead the message should be a maximum of 2 lines - so as author you should think carefully what the most important message is you want to provide.
Top 2 - Title
As you can see in the previous example for the message, the title in the chart is not just a typical title mentioning the measure, but instead the title should include at minimum the following information:
- Measure nameThis might sound like an "obvious", but your title should mention the measure names of what is shown.
- Unit / Currency & Scaling information for the measureThe title should also include the Unit / Currency and also the scaling information. So instead of having a title "Sales Revenue for 2017" you should use a title "Net Sales Revenue in mUSD" and also include the timeframe (see next item).
- Information on timeframeInclude the timeframe for the chart into your title and this also means, that the title needs to be kept dynamic because the timeframe will change. In case your visualization covers a larger timeframe, such as 24 months or multiple years, you don't have to list each period but instead you mention start and end.
You should also include information on which values you are showing. Are you showing the Actual values, Planned, values from the previous year - this should be included in the title. - Information on Variances when usedIn addition to mentioning if you are showing Actual or Budget or values from the last year, you should also - in case they are used - mention any variances you included.
For example, if your chart shows the Actual and the Budget values and you also showing a variance of Actual - Budget, then your title not only should mention Actual and Budget measure type, but instead you should also mention the Variance (ΔBU) in the title.
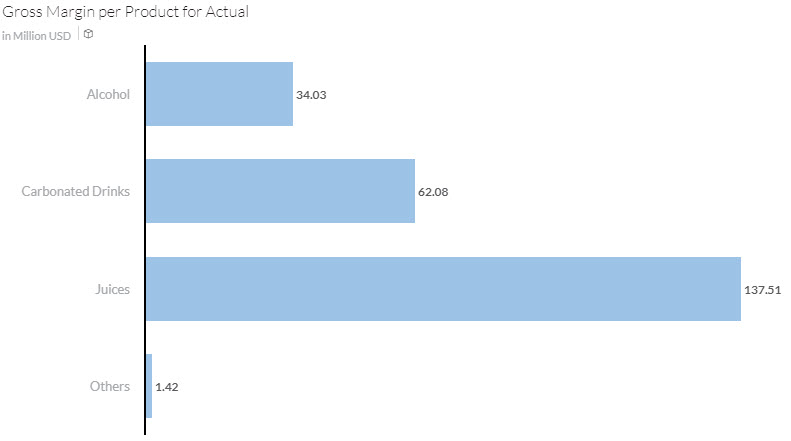
So here an example of a good title.
It shows the company name, measure name, Currency, scaling information, and the used timeframe and measure types.
How does SAP Analytics Could help you ?
So how does SAP Analytics Cloud help you to implement all these recommendations as part of your next story ?
When you start your next story, please note the templates that are available.
Some of these templates have been designed with the IBCS standards in mind. For example the Report template is making several recommendations based on the IBCS standards and you can choose from a variety of layouts.
The message of your report is basically a text right now, but for the title we can make use of an interesting option in SAP Analytics Cloud, which is the dynamic text - and SAP Analytics Cloud even takes care off it by default.
For example, when you create a new chart, you will automatically get a chart title that includes the measure, the used dimension, and the currency, and the scaling information.
In case you would wanted to create a similar text yourself you can use the Text option (Menu Insert) and include dynamic information.
Here you can choose from a variety of dynamic elements,which you can then include into your text.
This covers the Top 1 and Top 2. In the next blog we will take a closer look and 3 and 4.
References
openSAP Online Course - Semantic Notation
Hichert.com
IBCS
You must be a registered user to add a comment. If you've already registered, sign in. Otherwise, register and sign in.
Labels in this area
-
ABAP CDS Views - CDC (Change Data Capture)
2 -
AI
1 -
Analyze Workload Data
1 -
BTP
1 -
Business and IT Integration
2 -
Business application stu
1 -
Business Technology Platform
1 -
Business Trends
1,661 -
Business Trends
87 -
CAP
1 -
cf
1 -
Cloud Foundry
1 -
Confluent
1 -
Customer COE Basics and Fundamentals
1 -
Customer COE Latest and Greatest
3 -
Customer Data Browser app
1 -
Data Analysis Tool
1 -
data migration
1 -
data transfer
1 -
Datasphere
2 -
Event Information
1,400 -
Event Information
64 -
Expert
1 -
Expert Insights
178 -
Expert Insights
276 -
General
1 -
Google cloud
1 -
Google Next'24
1 -
Kafka
1 -
Life at SAP
784 -
Life at SAP
11 -
Migrate your Data App
1 -
MTA
1 -
Network Performance Analysis
1 -
NodeJS
1 -
PDF
1 -
POC
1 -
Product Updates
4,577 -
Product Updates
329 -
Replication Flow
1 -
RisewithSAP
1 -
SAP BTP
1 -
SAP BTP Cloud Foundry
1 -
SAP Cloud ALM
1 -
SAP Cloud Application Programming Model
1 -
SAP Datasphere
2 -
SAP S4HANA Cloud
1 -
SAP S4HANA Migration Cockpit
1 -
Technology Updates
6,886 -
Technology Updates
407 -
Workload Fluctuations
1
Related Content
- When to Use Multi-Off in 3SL in Technology Blogs by SAP
- SAP Analytics Cloud for planning - Resource Issue for Data Action in Technology Q&A
- SAP BTP, Kyma Runtime internally available on SAP Converged Cloud in Technology Blogs by SAP
- Kyma Integration with SAP Cloud Logging. Part 2: Let's ship some traces in Technology Blogs by SAP
- 体验更丝滑!SAP 分析云 2024.07 版功能更新 in Technology Blogs by SAP
Top kudoed authors
| User | Count |
|---|---|
| 13 | |
| 10 | |
| 10 | |
| 7 | |
| 7 | |
| 6 | |
| 5 | |
| 5 | |
| 5 | |
| 4 |