In this conclusive Part III of this series, we will explore the final step in evaluating cloud ERP investments –
Validate.
As explored in Part
II of this series, we collaborated with a customer to objectively evaluate its ERP strategy – comparing the prospective benefits of Public Cloud ERP with those of Private Cloud ERP. In this final part, we will discuss the validation of Cloud ERP investment decisions relative to an organization’s current state and other prospective investments.
When making investments in our personal lives – whether they be investments in time or money – we typically choose investments which have the greatest expected return on investment in the shortest amount of time. The Cloud ERP investment decision-making process is no different for corporations. To gain internal consensus, budget approval and executive buy-in, all investment decisions need to be validated based on the economic advantages they are expected to drive relative to all other in-flight or proposed investments. Further, according to Professor Aswath Damodaran, a noted Valuation guru, “returns on projects should be measured based on cash flows generated and the timing of these cash flows; they should also consider both positive and negative side effects of these projects.”
To determine the time-relevant cash flows of an investment, we recommend plotting the level of capital expenditure (CapEx) and operational expenditure (OpEx) required over a 3-5-year time horizon. This helps provide visibility into both the expected break-even of each scenario as well as the timeline for realizing each potential benefit - which enabled time value of money calculations relative to a company’s return on investment (ROI) and internal rate of return (IRR) thresholds. Consider the following two examples that illustrate potential economic outcomes.
Example 1:
The following graph depicts the cash flow (positive and negative) projected for a building materials customer considering a move from a heavily customized on-premise ERP platform to a fit-to-standard Public Cloud platform.
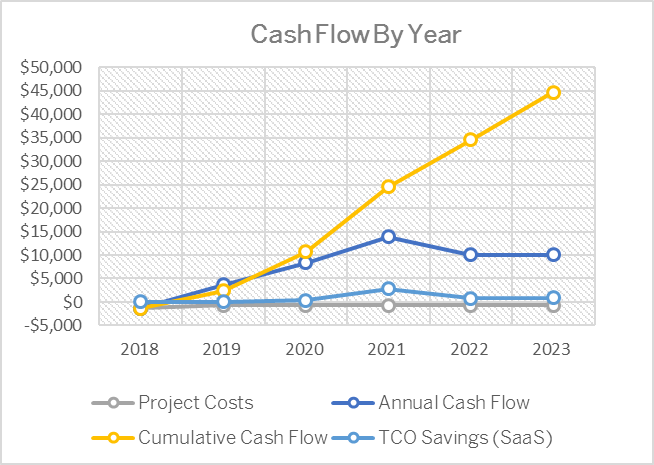
Scale: $ in USD Millions
Notes:
- Project Costs – the grey line - are represented as negative cash outflows.
- Annual cash flow – the dark blue line – is represented as positive projected annualized cash flow benefits driven by process improvements reducing overall operating cost
- Cumulative cash flow – the yellow line – represents cumulative cash flow benefits inclusive of negative projects costs, positive projected TCO savings, and positive projected process benefits.
- TCO savings – the light blue line – represents annualized TCO benefits relative to the company’s baseline annual ERP cost basis
- No TCO benefits were expected until year 3 in line with a projected break-even on investment of 28 months based on a graduated implementation approach.
- No process benefits were expected until the mid-point of year 2 factoring in associated change management and learning and development variables. Process benefits realized in year 1 were expected to be 25% of total possible process benefits - with an expectation of a step improvement in process benefits to be achieved in years 3, 4 and beyond.
- The TCO benefits while substantial were projected to be overshadowed by greater projected process benefits – that in turn drove a perception of improved risk mitigation and process consistency across the enterprise
- The annual uptick in 2021 and subsequent annual downtick in 2022 reflects a cost avoidance benefit of systems upgrades projected to be captured in 2021. This scenario assumes the company follows an on-premise hardware refresh cycle of 4 years – the schedule set by this customer.
Example 2:
The following graph depicts a collapsed view of potential Return on Investment collaboratively produced with a financial services customer – illustrating the outcome of an economic analysis incorporating elements of a. hard cost reduction (TCO), b. projected process benefits and c. innovation / capacity to scale benefits:

Scale: $ in USD Millions
Notes:
- This graphic depicts a consolidated view of benefits based on projected improvements in a. technology cost and cost structure (type and timing of costs), b. business process efficiency - including accelerated financial close and reduced accounts receivable levels, and c. company growth enabled by innovation adoption - with downside risk mitigated through adherence to standard business processes across the enterprise
- This customer viewed the ability to quickly scale as a quantifiable economic benefit of adopting Public Cloud ERP
- While in most cases, the driving force for a specific investment decision will not be solely economic, translating projected qualitative benefits into measurable economic ones is an essential piece of building a business case. This holds true for Public Cloud as it does for all other types of investments.
As illustrated in these two examples, though there are different methods for measuring and illustrating prospective economic benefits, the one common thread is the use of cash flow analysis to evaluate investments relative to each other and relative to the current state of the business. Every enterprise takes a slightly different approach to investment decision-making. Grounding an analysis in cash in-flows and out-flows enables companies to most objectively measure the potential benefits of multiple prospective investments. This in turns enables companies to validate the investment option that offers the greatest projected net economic outcome - relative to all investment options.
In upcoming blogs, we will explore different methods for calculating ROI, TCO, TCI, and investment break-even.
