It is known that we can use Hybris Administration Console to monitor the runtime behavior of installed Hybris Commerce instance such as Memory, CPU load and thread overview.

Meanwhile as Hybris Commerce is implemented in Java, there is another approach to achieve the same requirement with the help of JMX.
Java Management Extensions (JMX) is the Java specification for monitoring capabilities. JMX defines managed beans (MBeans for short). MBeans are Java objects which expose some metrics (such as memory usage for example) and implement some functionality (such as flushing the cache).
You can also find JMX definition in
wikipedia.
Here below is how to use jconsole( a built-in tool provided by JDK ) to monitor Hybris Commerce runtime behavior.
1. find the port number of JMX Remote Listener for your Hybris instance.
In my example it is 9003 observed in Hybris startup log displayed in the console.
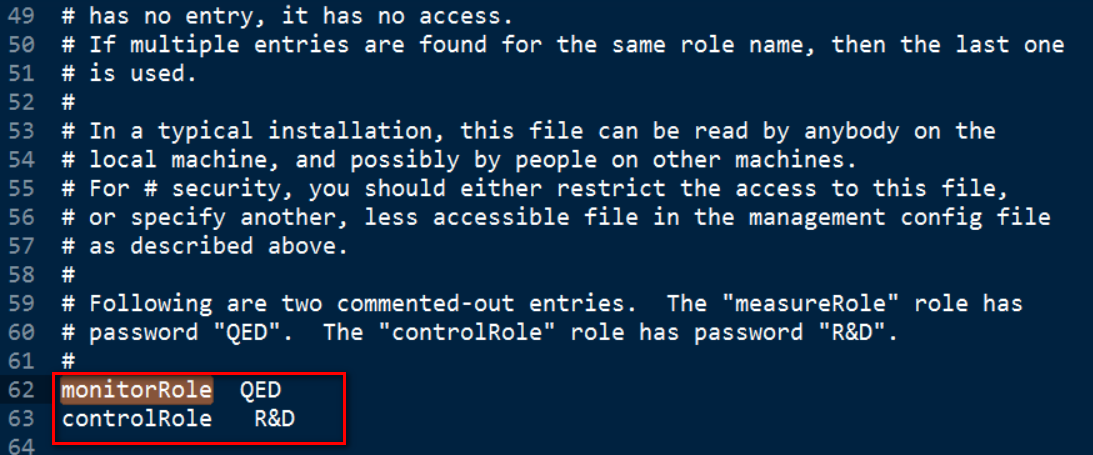
2. copy jmxremote.password.template to jmxremote.password,
and remove the # in front of monitorRole and controlRole to make both take effective. Once done, the content of this file looks like below:
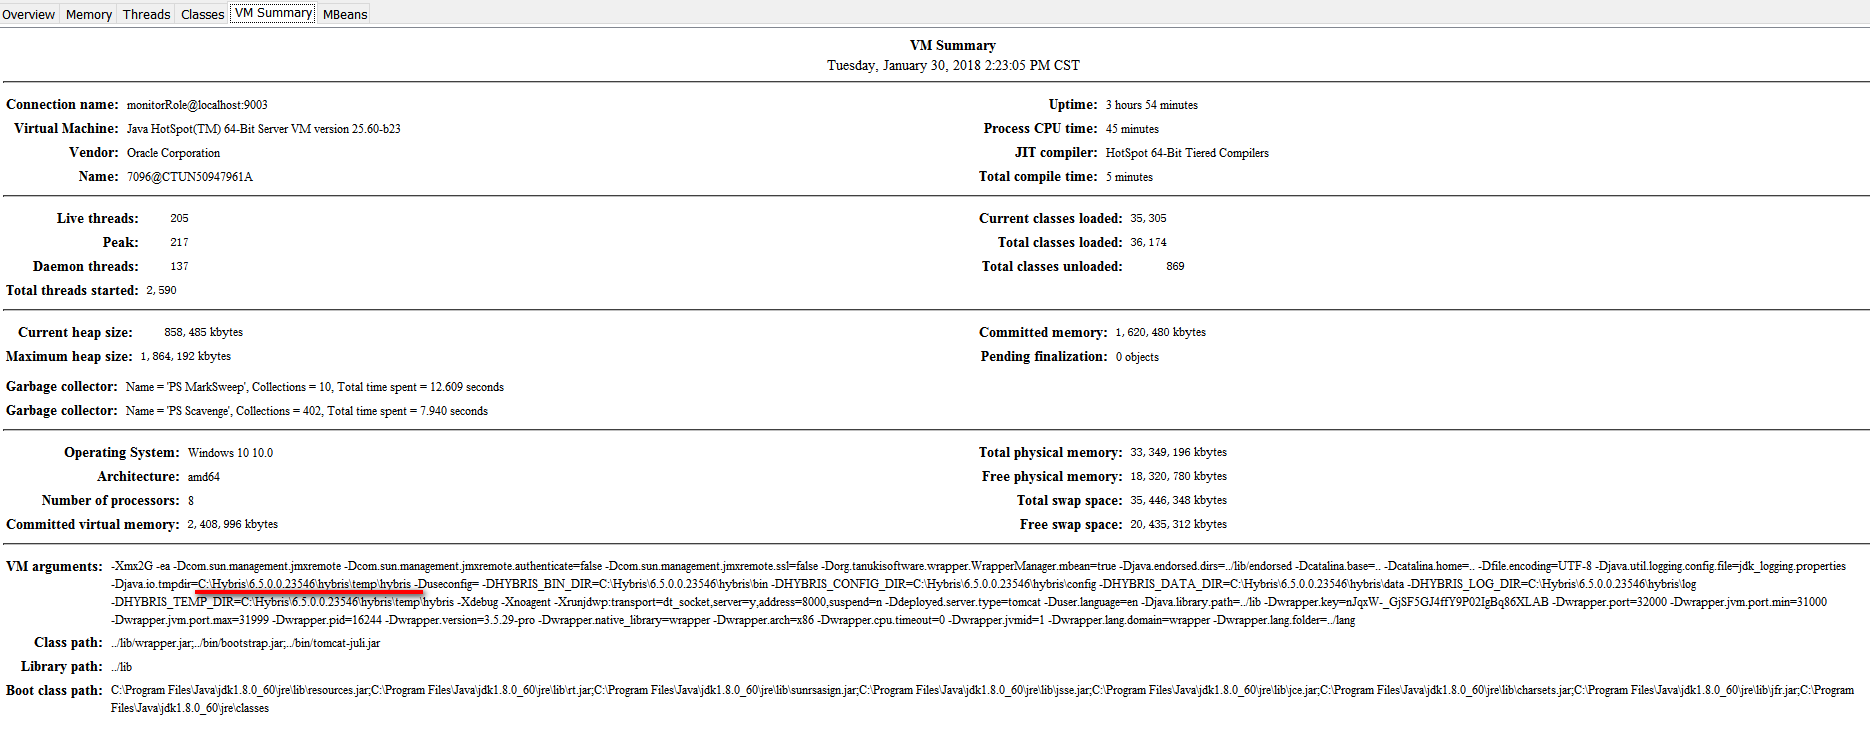
3. Launch jconsole.exe in <JDK installation folder>/bin:
Once connected, we can use jconsole GUI to monitor runtime behavior.