
- SAP Community
- Products and Technology
- CRM and Customer Experience
- CRM and CX Blogs by SAP
- C4C Performance 101
CRM and CX Blogs by SAP
Stay up-to-date on the latest developments and product news about intelligent customer experience and CRM technologies through blog posts from SAP experts.
Turn on suggestions
Auto-suggest helps you quickly narrow down your search results by suggesting possible matches as you type.
Showing results for
Employee
Options
- Subscribe to RSS Feed
- Mark as New
- Mark as Read
- Bookmark
- Subscribe
- Printer Friendly Page
- Report Inappropriate Content
01-23-2018
8:22 PM
Performance Basics
 | Sometimes screens may take longer than usual to load because of performance issues. Please use the guide below to troubleshoot what may be causing the same. |
When we experience slowness while interacting with the C4C application, it maybe very useful to understand the underlying cause of the performance problem. It may be in one or more of the following areas below:
- Client - Cache settings, Mashups, Browser type/version etc
- Network - LAN, proxy, Gateway, Web Filtering, Internet Services Provider (ISP) etc
- Server - Customizations including PDI/SDK, Workflow, or it may be due to SAP code itself
Performance problems could be sporadic, which means it only happens occasionally and we don't know when it would happen again. It may also be the case that we may experience slow performance over a broader range of time, can be reproducible or in general we are not happy with the performance of the application.
The cause for slowness can quickly be identified by looking at the interaction's performance statistics. This can be accessed by right clicking anywhere on the browser screen and selecting the option "Inspect" in Google Chrome or "Inspect Element" in Microsoft Internet Explorer. This is described in more details in the following article View Performance Statistics Within Browser (available starting 1802).
The following table describes each performance metric and how it may affect performance. Once you have performance statistics for a given screen please compare with the table below.
Please note not all the attributes given below will be present in your statistics. If the condition is false or if the value is zero then that attribute will not be available.
Please click each of the links for further details.
| Performance Metric | Value(s) | Troubleshooting info | Comments |
| server-cold-start | true/false | If this is reproducible frequently then please open an incident | If false, attribute will not be visible/available |
| browser-cold-start | true/false | Please follow the blog mentioned in details | If false, attribute will not be visible/available |
| end-to-end-time | seconds | Cause can be determined based on further attributes below | Total time it took for the interaction. Check with other users or look at attributes below for contributing factors |
| no-of-round-trips | number > 0 | Determine reason for higher than standard roundtrips | This depends on the screen. Example: Loading an Account without customizations takes one roundtrip |
| network-time | seconds | Please follow this expert blog | Please note you may need help of your network specialist to troubleshoot |
| server-time | seconds | Determine reason based on further attributes below | This includes PDI, BRF, Web Service and Workflow times |
| server-pdi-processing-time | seconds | Follow the linked expert blog especially if this is more than one second | Only available if there is an associated PDI development |
| no-of-sdk-round-trips | number | Follow the linked blog especially if this is more than one | Only available if there is an associated PDI development |
| server-ws-processing-time | seconds | Follow the linked expert blog especially if this is more than one second | Only available if there is a web service configured. Example: Pricing Web Service |
| server-wf-processing-time | seconds | Follow the linked expert blog especially if this is more than one second | Only available if Workflow has been configured for the objects relevant for the associated screen |
| server-brf-processing-time | seconds | Follow the linked expert blog especially if this is more than one second | Only available if Business Rules Framework rule has been configured for the objects relevant for the associated screen |
| tti | seconds | Please use tti (time to interaction) along with end to end time to troubleshoot | Example: If tti is much less than end to end time, then slowness may be due to UI components associated with asynchronous loading |
| tti-roundtrips | number > 0 | This is always either equal to or less than end to end time | |
| woc-id | string | Please see description using to associated link | |
| woc-view-id | string | Please see description using to associated link | |
| ui-comp-id | string | Please see description using to associated link | |
| ui-step | string | Please see description using to associated link | |
| ui-step-type | string | Please see description using to associated link | |
| product-version | string | Include this info if opening an incident | If this is TEST system then also check in PRODUCTION system |
| os | string | Include this info if opening an incident | |
| osversion | number | Include this info if opening an incident | |
| browser | string | Include this info if opening an incident | |
| browser-version | string | Recommendation: Make sure browser version is not very old | Check your browser type/version https://www.whatismybrowser.com Please Note this is a link to an external non-SAP Site: |
For more details on the best practices in the above areas, please visit the link below.
SAP Hybris Cloud for Customer Performance Best Practices
Server Cold Start
Reason: The application servers load and cache metadata for faster access. This can be reset when new objects (customizations) are deployed or when servers are restarted after maintenance. When this happens and a user happens to access that particular object, then this flag is set true and there may be a one time slowness associated with this activity. This should be not very common and if this is observed frequently then please check with your Admin whether SDK or other objects are being deployed. Solution: Retry the activity (be careful in case you are changing data). If the condition persists then please open a support incident. For help with opening a ticket please follow this blog Example: Below is an example where the interaction had a cold server start. However, this should normally be a "one-time-behavior". This may be the primary cause of slowness and should be resolved first before troubleshooting other performance indicators. Please note this attribute will not be present in the statistics when the attribute is false or if the "server start" is not cold. |
Browser Cold Start
Reason: Browser cold starts are a frequent cause of performance issues. In most cases, it could be due to a simple browser settings or deletion of cache content by a user. Please refer to the solution section for more details. Solution: Please follow the blog on how to identify and troubleshoot a cold browser. How to Troubleshoot Cold Browser Scenarios Example: In the example below from the quick view performance statistics, we can see that the interaction was cold. In this case it could be that the application is being accessed for the first time or a KUT change was made during business hours. Please repeat the interaction (if possible to do so without affecting or changing data) and see if the problem goes away. If it does not go away, please refer to the above blog for more troubleshooting information. Cold browser will always result in more number of roundtrips than a warm browser. |
End to End Time
Concept: End to End time (E2E is the total time needed to display all the information for the landing facet. For example, when a product is clicked it opens the thing inspector and in most cases the landing facet is the overview facet (unless it was customized from the defaults). The end to end time works in conjunction with TTI or time to interact. In most cases measurements should be taken against TTI. Video explaining TTI and End to End time in performance statistics Please use in-tenant reports to see specific average or median end to end times for specific interactions. |
Number of Round Trips
Reason: The number of roundtrips plays an important role in performance. Each roundtrip requests information from the server and the higher the number of trips the more E2E time it takes. This is due to the network overhead. Also the greater the distance from the data center (especially crossing continental boundaries), more time is spent in each roundtrip. C4C standard screens mostly take one roundtrip, however in some screens like Product thing inspector takes up to four roundtrips. Reasons for high number of roundtrips (than the standard solution) can be due to the following reasons:
Solution: For troubleshooting due to cold browser please see this blog https://blogs.sap.com/2017/04/20/recommended-browser-settings-for-sap-hybris-cloud-for-customer/ For customizations please see section on "Operation Clubbing" in the following blog https://blogs.sap.com/2015/08/27/sap-cloud-application-studio-performance-best-practices/ Example: Below is an example of high number of roundtrips due to a cold browser. In such a case please follow the corresponding blog for more details. The second example below is an example of high number of roundtrips due to customizations. Here the SDK customization is taking an additional two roundtrips. Please refer to PDI/SDK best practices for optimizing the same. https://blogs.sap.com/2015/08/27/sap-cloud-application-studio-performance-best-practices/ |
Network Time
Reason: Network time is directly proportional to the distance of a user from the data center. As a ballpark, please follow the guideline below. Divide end to end time by total number of roundtrips. If this is greater than half a second then you may be experiencing network issues. High network time can be the result of the following:
Solution: For testing for slow internet speeds please use this link to test latency and bandwidth for your tenant connection speed (Note: please replace 123456 with your tenant number) Detailed instructions for the above For expert troubleshooting please follow this blog: Expert Network Troubleshooting Also please note network issues could be sporadic. Please check with other colleagues and see if they experiencing the same. Example: In the performance statistics example below, the network time is approx. 5.8seconds and number of roundtrips is 3. The result is more than 1 second indicating network issues. |
Server Time
Reason: The total server time includes several components as detailed below. Please check if these attributes are contributing to the overall higher server times. If none of these components show increased values (above 1sec) and the server time is consistently high then, please open a support incident. As a thumb rule if any of the below customizations takes more than one second then it should be investigated by the customer. Please note the reported server time includes customization time. Therefore please subtract total customization time (1-4 below) from the reported server time to get the pure server times without customizations.
Example: In the statistics below the workflow time is contributing to the overall high server time. In this case we should look into the workflow settings and configuration. |
PDI or SDK Processing Time
Introduction: What is Cloud SDK/PDI? Background 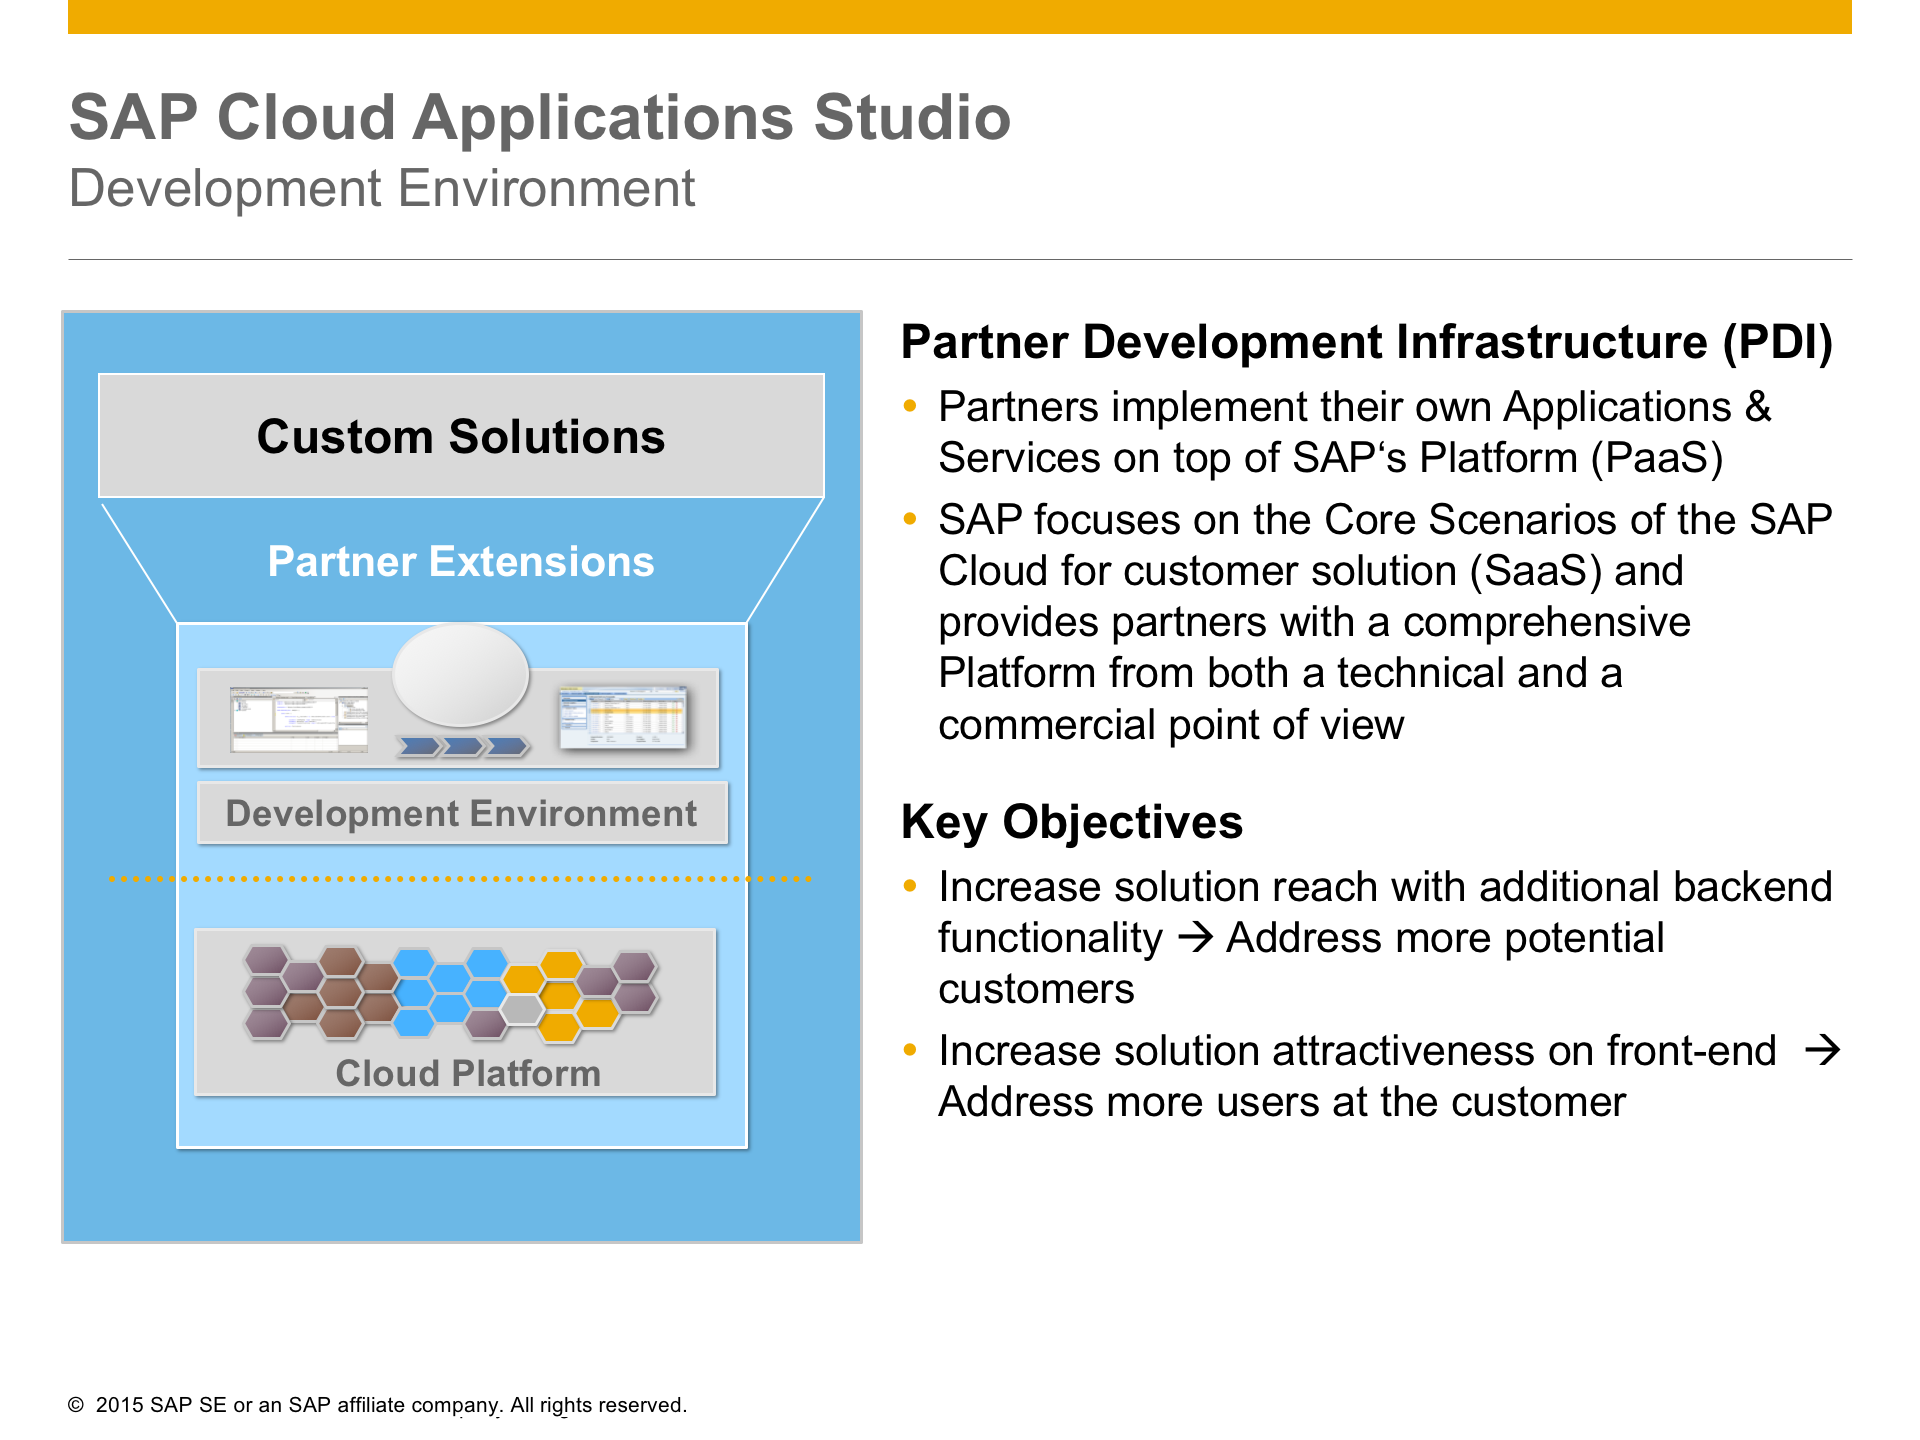
|
Number of SDK/PDI Roundtrips
|
Web Service Processing Time
|
Workflow Processing Time
Background Video :What is Workflow processing time?
|
Business Rules Framework Processing Time
Background video: What is BRF Time?
|
Time to Interact
Time to interact or TTI is the time that has been taken to render the screen with key information until also users are able to interact with the screen. However, further UI components may still be loading asynchronously in the background. Video explaining TTI and End to End time in performance statistics |
Time to Interact Roundtrips
The number of roundtrips that is needed for rendering the screen with key information and that a user can start interacting with. |
Work Center
Work center here is the top most navigation: In the screen shot below it represents Customers. Sometimes it may be helpful for troubleshooting to understand how the navigation takes place. Example: We could open an Account from the Accounts list (OWL) or from an Opportunity.  |
Work Center View
In the example below, "ACCOUNTS" represents the work center view.  |
UI Component ID or Screen Name
The UI Component is the technical name of the screen. This attribute along with the UI Interaction Step/Type constitutes the lowest degree of measurable performance attribute. In the example below, the Account Thing Inspector is displayed and the corresponding attribute in performance statistics is called COD_Account_TI. When the below screen is opened then the performance attribute for the same is given as: ui-comp-id: /BYD_COD/SalesOnDemand/Account/UI/COD_Account_TI.TI.uicomponent  |
UI Interaction Step
The UI Step is the action corresponding to the click. It provides technical values for the action taken. In most cases, we will be using only UI Step Type for troubleshooting. However, SAP Support may request for this attribute for troubleshooting. Example: Saving an Account ui-comp-id: /BYD_COD/SalesOnDemand/Account/UI/COD_Account_TI.TI.uicomponent ui-step: jEe_uS0qYKcnogIEZ1IwrW ui-step-type: Save 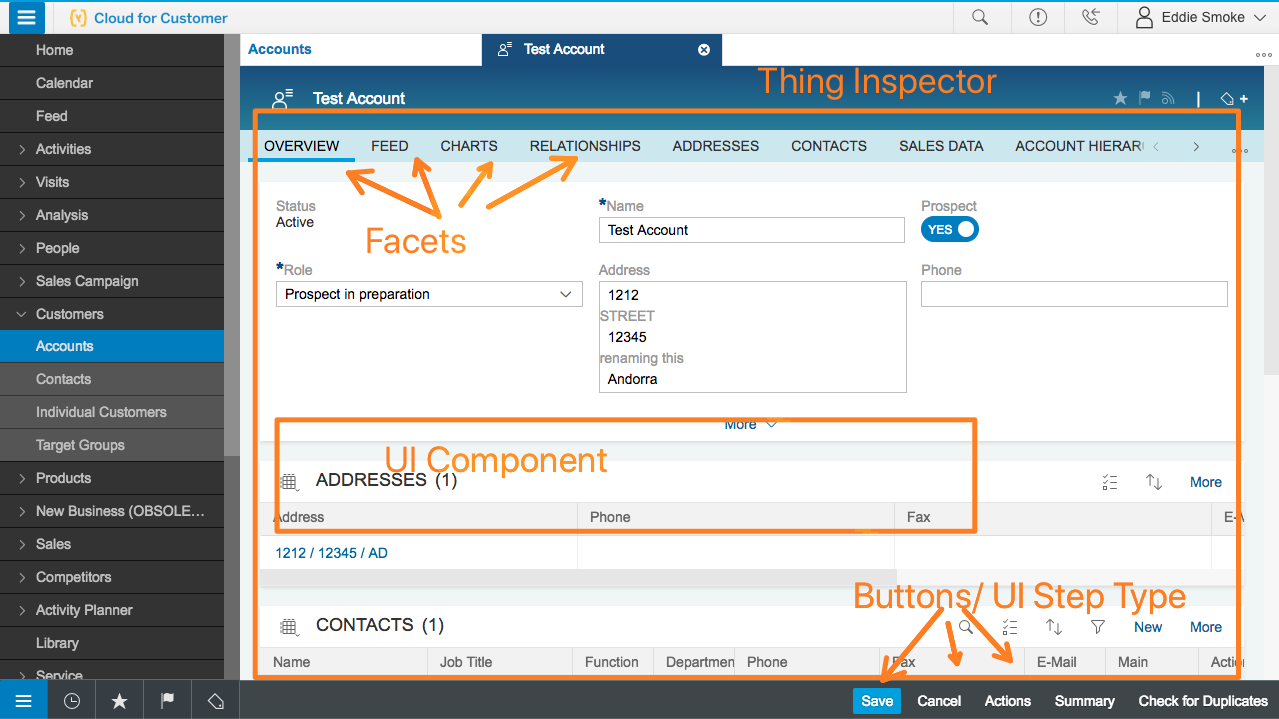 |
UI Interaction Step Type
The UI Step Type is the action corresponding to the click. This along with the screen name provides the lowest measurable attribute. In most cases we will be using only UI Step Type for troubleshooting. Upon saving an Account the performance statistics will reflect the below. ui-comp-id: /BYD_COD/SalesOnDemand/Account/UI/COD_Account_TI.TI.uicomponent ui-step: jEe_uS0qYKcnogIEZ1IwrW ui-step-type: Save  |
Product Version
| Product version reports the release version of SAP Hybris Cloud for Customer. |
Operating System
| This attribute states the operating system version. Please report this information in case you are opening an incident with SAP Support. |
Operation System Version
| This attribute states the operating system version. Please report this information in case you are opening an incident with SAP Support. |
Browser Name
Recommendation: The browser name is also the the name of the vendor. For example Google Chrome or Microsoft Internet Explorer. If you are experiencing a performance issue then its advisable to check using another vendor's browser to see if the problem goes away. Plugins etc can also influence performance. Please try to temporarily disable plugins while troubleshooting performance issues. |
Browser Version
Recommendation: Keeping your browser updated can help with performance and security. Please check you version with what is generally available. You can check your version and whats the latest available by going to the website below. Please Note this is an external Site: https://www.whatismybrowser.com |
- SAP Managed Tags:
- C4C Sales,
- C4C Service
5 Comments
You must be a registered user to add a comment. If you've already registered, sign in. Otherwise, register and sign in.
Labels in this area
-
Business Trends
270 -
Business Trends
11 -
chitchat
1 -
customerexperience
1 -
Event Information
256 -
Event Information
18 -
Expert Insights
30 -
Expert Insights
51 -
Life at SAP
133 -
Life at SAP
1 -
Product Updates
666 -
Product Updates
24 -
SAP HANA Service
1 -
SAPHANACloud
1 -
SAPHANAService
1 -
Technology Updates
453 -
Technology Updates
15
Related Content
- Working with SAFe Epics in the SAP Activate Discover phase in CRM and CX Blogs by SAP
- SAP Commerce Best Practices for Performance in CRM and CX Blogs by SAP
- SAP Commerce Cloud Q1 ‘24 Release Highlights in CRM and CX Blogs by SAP
- Unlock the Power of AI with Intelligent Selling Services for SAP Commerce Cloud in CRM and CX Blogs by SAP
- Maximize Results and Drive Sustainability in Fashion Retail with SAP and GK AIR Dynamic Pricing in CRM and CX Questions
Top kudoed authors
| User | Count |
|---|---|
| 4 | |
| 2 | |
| 2 | |
| 2 | |
| 2 | |
| 1 | |
| 1 | |
| 1 | |
| 1 | |
| 1 |