Skip to Content
Author's profile photo Marco Dahms

Secrets of the ABAP Debugger: Advanced ABAP Debugging Techniques

Goal of this blog post

The ABAP debugger is a powerful tool helping to examine your ABAP code at runtime.

Besides the common and basic features, such as stepping through your code and inspect the values of your variables, field symbols, and references, it provides helpful features that can simplify and shorten your debugging sessions. Not all of these features might be known to everyone.

In this blog post I am going to demonstrate my personal favourites.

Debugging Techniques

Debugging deep inside the Call Stack

Apart from debugging your own custom source code or the business-oriented code on the application level, it might be necessary from time to time to dive deeper into the call stack. Sometimes you can only spot bugs when debugging the asynchronously executed update tasks or system programs.

System Debugging

System programs are typically provided by SAP itself and you should not classify your own programs as such. System code is considered relatively technical and not containing any business logic. As a consequence, developers focusing on business logic commonly do not need/want to debug this. However, from time to time your debugging session might end up at a system program.

In order to dive into system code using the ABAP debugger you have to activate system debugging beforehand. Choose the menu entry System Debugging On/Off in the settings menu.

Activating system debugging allows you to access source code you are typically not able to see and, therefore, can help investigating issues. On the other hand, you need to deal with a growing call stack as all system programs are visible too. Usually the system code is executed in the background without your notice.
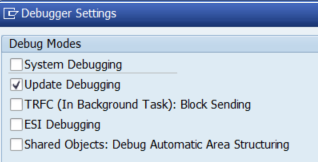
Update Debugging

Whenever you deal with transactions or reports that utilize asynchronous update tasks (e.g. to persist business data), you might encounter error messages occuring from the executed code inside the update task. Such errors appear usually in the SAP GUI telling you “Update was terminated”.

In order to examine what is going wrong, you can activate update debugging. If update debugging is turned on, the ABAP debugger opens once the update task is being executed and allows you to inspect the program flow.

Consider the change of a cost center as example. We open transaction KS02, select a demo cost center, and open its master data. Let us adjust the description. Before we click Save, we enter “/h” in the transaction code input field on the top left corner and press Return. The green success message “Debugging switched on” is displayed at the bottom.

After clicking Save, the debugger opens showing the PAI/PBO modules of the current ABAP program. In order to activate update debugging, we open the debugger settings following the menu path Settings -> Change Debugger Profile/Settings. In this dialog we activate Update Debugging and confirm.

Pressing F8 skips the current debugger session. The ABAP server continues processing the current ABAP program which prepares and hands over the update tasks to the update processing. Once they are executed, the debugger opens once again.

Coming back to the cost center change example, we end up inside the function module KOSTL_WRITE_DOCUMENT. According to its source code, it takes care calculating the change documents with regards to this cost center master data change.

In the most cases, multiple update tasks are coming into play for one business process (changing a cost center is relatively easy, though). Let us figure out how we can find all of them at runtime.

Looking at the call stack, we can see the form routine VB_V2_NORMAL.

Before we can navigate into this code, we have to activate system debugging (see chapter above).

Inside this form routine we can see that the internal table VBMOD_TABL contains all function modules to be processed.

Using update debugging you are able to spot bugs inside function modules executed in update task. Even if you do not encounter any bugs, it might be interesting to see what happens under the hood.

Influence the Program Behaviour at Runtime

When you are examining the flow of an ABAP program in the debugger and you aim to focus on a certain piece of it only, it may happen that the specific case you’re investigating only occurs under certain circumstances (e.g. certain variables having certain values). In such a case you have to invest time to modify everything so that the debugger reaches the piece of code you’re interested in.

Avoiding this effort (time is money) you can leverage the simple, but nevertheless very valuable, feature named Goto Statement.

Assuming the debugger is currently at line 32 in the given screenshot, you right-click on the line number where you want it to continue and choose Goto Statement. As a consquence, the lines in between are skipped, i.e. not executed, and the processing continues where you want.

Be aware that this feature can be abused: Users can skip intended and meaningful authorization checks and, therefore, conduct actions they are not allowed to do. Generally it is a recommended practice to turn this feature off (i.e. not authorizing anyone) in productive environments.

Make your Breakpoints more powerful

Breakpoints allow the developer to specify in which code line the debugger should stop.

Typically you choose one particular code (e.g. line x in program z) because you want to inspect the program flow around this code. Besides such dynamic breakpoints you can leverage special dynamic breakpoints and conditional breakpoints to make your debugging experience easier.

Special Dynamic Breakpoints

Assume we require to identify all authorization checks conducted during a program flow. We know that AUTHORITY-CHECK is the respective ABAP keyword. How do we solve this challenge?

Firstly, we could execute the ABAP program in the debugger and follow the program flow by hand. After browsing through all methods, function modules etc. we have noted down all authorization checks. Apparently this approach is time-consuming and also error prone as you never know if you have missed some piece of code deep in the call stack.

Secondly, as an advantageous approach you can leverage special dynamic breakpoints (that’s the official name according to the documentation). This feature let’s you create breakpoints at every instance of a certain e.g. statement, exception, or function module.

In order to define special dynamic breakpoints, choose Breakpoints -> Breakpoint At in the debugger menu. Choose Breakpoint at Statement with regards to our example. In the appearing pop-up we enter the name of the command.

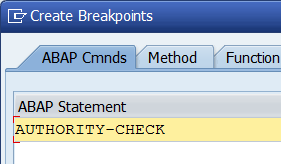
As a consequence, the debugger creates breakpoints at every authorization check. By pressing F8 you can navigate from one occurrence to another.

Consider activating system debugging beforehand to really fetch all authorization checks (otherwise you miss them hidden in system code).

Conditional Breakpoints

Assume you are debugging some code containing a loop whereas you are interested in debugging a certain cycle (e.g. the fifth loop cycle). Making the debugger stop in this exact cycle is easy using conditional breakpoints.

Consider the following sample program.

REPORT zmd_cond_brkpnt_01.

DATA lv_foo TYPE i VALUE 0.

*for demonstration purposes; do not use static breakpoints in production
BREAK-POINT.

DO 50 TIMES.
  ADD 1 TO lv_foo.
ENDDO.

*for demonstration purposes; do not use static breakpoints in production
BREAK-POINT.

The do loop runs 50 times whereas each loop cycle updates the variable lv_bar with the current value of lv_foo. When we set a breakpoint inside the loop, we stop there 50 times by pressing F8.

By introducing a conditional breakpoint we can define that the debugger shall only stop at this breakpoint in case a given condition is met.

We can define the condition using tab strip Break./Watchpoints.
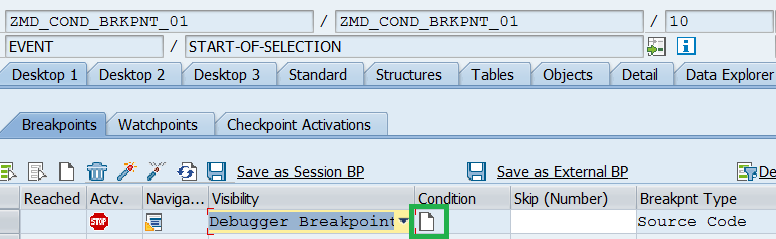
Let’s say we want to stop when lv_foo gets 42 assigned.

After pressing F8 the debugger stops exactly at the respective loop cycle.

This simple example visualizes how to use conditional breakpoints. I found this feature to be quite useful a couple of times throughout my projects.

Classification of Breakpoints

In the official documentation we can find terms such as static breakpoints, special dynamic breakpoints, external breakpoints, debugger breakpoints. While investigating the meaning of these terms I found that they are addressing different properties of breakpoints, such as their life time or the way you create them.

Therefore, I was curious and have created a classification of breakpoint times according to the following categories:

  • Life Time
  • Way of Creation
  • Can be User-Agnostic
  • Processing Mode
  • Conditionally Considered
  • Activated

Life Time

Breakpoints exist for a certain time, that is once their life time has passed they are gone and cannot be used anymore. The possible life times are:

  • Lives during current debugging session: Debugger Breakpoint
  • Lives during all sessions of current user session: Session Breakpoint
  • Lives typically for two hours: External Breakpoint

Generally all breakpoints can be deleted manually, i.e. their life time can be shortened on purpose.

Way of Creation

There is several ways how to create a breakpoint:

  • Hard-wired statement in the code (such as BREAK-POINT): Static Breakpoint
  • Single line selected by hand: Dynamic Breakpoint
  • Lines selected by certain definition (such as at every instance of certain statement): Special Dynamic Breakpoint

Can be User-Agnostic

A breakpoint can be valid for a certain user name or not.

If so, the breakpoint is considered once the respective user executes the code line. This applies to all breakpoints unlike Static Breakpoints defined with BREAK-POINT.

If not, the debugger stops at every execution regardless of the current user. This applies to Static Breakpoints defined with BREAK-POINT.

Processing Mode

There is breakpoints that stop at dialog processing only, such as Debugger Breakpoints.

in contrast, e.g. External Breakpoints are used to debug processing of remote calls such as RFC or ICF processing.

Conditionally Considered

The consideration of a breakpoint may depend of a given condition expressed as logical condition. For instance, a variable has to have a defined value and, therefore, the debugger only stops if the condition is fulfilled. Such breakpoints are referred to as Conditional Breakpoints.

Activated

Apart from their existence breakpoints can be active or inactive.

In case you do not need a breakpoint being considered in your debugging session, you can deactivate it. You can turn it on again once you want to use it.

Discover changing Variables using Watchpoints

Watchpoints are quite useful whenever you are interested in the time point and the code at which a certain variable or an object attribute changes its value. Especially in very complex program flows with a deep call stack it may be hard to figure out value changes manually.

In order to create a watchpoint we navigate to the tab Break./Watchpoints, choose the tab Watchpoints and click the Create icon.

Considering the sample program about conditional breakpoints from above, we’re interested in spotting changes of the value of variable lv_foo.

In this dialog we can choose between inspecting variables of object attributes. We can also specify the respective ABAP program.

After creating this watchpoint and pressing F8 in our sample program, we get notified that the watchpoint has been reached.

Debugger Scripting

Debugger Scripting is a powerful mechanism to automate processes that occur often, are time-consuming and are conducted by hand.

Assume that you want to skip authorization checks by manipulating the sy-subrc value.

Disclaimer: Only do so if it is harmless, that is you must not abuse this feature. Tell you admin if you are authorized to use it and you are working in a field with sensitive data or processes.

You can open the tab Script in the debugger and there you will find a local class implementation. Besides the methods prologue, init and end you can add you own logic in the method script. On the left-hand side you can decide when the script shall be triggered. For instance, et every debug step or after once a watchpoint is reached.


Happy Debugging!

Assigned Tags

      31 Comments
      You must be Logged on to comment or reply to a post.
      Author's profile photo Joachim Rees
      Joachim Rees

      Hey Marco,

      thanks for sharing.

      I personally didn’t learn to much new, except that one can go pretty academic on something seeming so simple as a breakpoint! ?

      But I do like the standard ABAP Debugger (in earlier days called “new” ABAP Debugger), and do have the feeling that it’s very powerful.

      I also think that there are many features I don’t know or use yet.


      So maybe it’s a good idea if we all share some of the features we like: For me, an example would be the possibility to:

      – download-/upload internal tables between Debugger and my local pc

      Save parameters of an function-module call to SE37-testdata.


      One more thing I can put in: “Goto Statement” is very useful and I use it a lot. Instead of clicking through menus, I usually just use the Shift+F12 shortcut!

      One of the things that I haven’t really put into my toolbox is Debugger Scripting – you mention it shortly, but maybe if you do actually use it, how about writing a own blog on it?

      There are 2 Blogs from about 7 Years ago:

      https://blogs.sap.com/2010/12/14/abap-debugger-scripting-basics/

      https://blogs.sap.com/2010/12/14/abap-debugger-scripting-advanced/


      but it would be nice to see some actual, current use cases.

      best
      Joachim

      Author's profile photo Jelena Perfiljeva
      Jelena Perfiljeva

      Agree completely. Also these are not really "advanced techniques", as the title promised. It's a decent "debugger primer" for the beginners, could greatly benefit from the specific use cases.

      Real advanced techniques are in the comments. 🙂

      Author's profile photo Michelle Crapo
      Michelle Crapo

      Ah but isn't that always the great thing about writing a blog!   Someone thinks of something differently and adds to it!

      Success - we are adding to it!

      Michelle

      Author's profile photo Klaus Hummel
      Klaus Hummel

      Hello Joachim,

      let me just give you a hint that the two features from your wish list are already (ok, let's say almost) available:

      While debugging, click on the Tools icon on the far right.
      This will offer you serveral possibilities, including download of internal tables (sadly, there seems to be no upload functionality at the moment), and also saving FM parameter values as test data (not working für string parameters).

      I hope this will help to du your work!
      (I admit that I hated the "new ABAP debugger" first, but having such features is quite a nice thing.)

      Best regards,
      Klaus

      Author's profile photo Joachim Rees
      Joachim Rees

      Hi Klaus,

      thanks a lot!
      Actually it was not a whish-list, but examples of what I like about the debugger! So I did know how to get them allready. Sorry for the confusion!

      ...let me check again with that upload to interne table, I think I did that allready!

      best
      Joachim


      Author's profile photo Joachim Rees
      Joachim Rees

      Found it!

      Here's how to upload data to an itab:

      Author's profile photo Bernd Reimann
      Bernd Reimann

      Hallo Joachim,

      I have an example for one possible use of the debugger scripting. It's not brand new but you can apply it any time.

      In projects where we made extensive use of ABAP OO it turned out that going through a complex "objects network" using the debugger can be extremely cumbersome and time consuming. You can have many nested collections, objects with different types, object references to follow. And then once you arrive at the spot where you wanted to be ... press F6 instead of F5 and you start from the beginning.

      So I wrote a script that parsed all the references and provided me all the information is a nicely formatted list. I can't tell you how much time that saved me but it was certainly a lot! If I find the code I can share it 🙂

      Best, Bernd

      Author's profile photo Nam Le Huynh
      Nam Le Huynh

      Hello Joachim,

      Thanks for sharing your idea.

      For point "

      – Save parameters of an function-module call to SE37-testdata.

      Did you mean this function?

      Go to SE37 -> Fill parameter -> Save

      Next time come back -> Test Data Directory

      Regards,
      Nam

      Author's profile photo Michelle Crapo
      Michelle Crapo

      Excellent idea  Joachim Rees  One of my favorites is Breakpoint at and I type in message.    It may stop too many times, but i usually find what I like.

      When I was on the correct version my favorite thing was to save the parameters for a function call.    Then I could skip around easier.

      I also use watchpoints quite a bit.   I like to set up a watchpoint for a certain condition.   That way I can quickly get to a record that is causing issues.

      Michelle

      Author's profile photo Jelena Perfiljeva
      Jelena Perfiljeva

      I use watchpoints with message number (sy-msgno variable) frequently.


      Author's profile photo Michelle Crapo
      Michelle Crapo

      I like that idea!   But then the message I get isn't always the one that I'm looking for.    It's six levels deep in the code.   However run it.   Then run it again once I find the next message.   Mmmmmm...  That's got to be better.

      Thank you!

      Author's profile photo Tomas Buryanek
      Tomas Buryanek
      • Ctrl+shift + click on breakpoint column = fast GoTo Statement
      • Tracing from debugger https://blogs.sap.com/2014/06/12/easy-trace-in-new-abap-debugger/
      • To display/debug old list output at any given time - Others->Disply List, or use tool Special tools->Console
      Author's profile photo Joachim Rees
      Joachim Rees

      Wow, that's a pretty good knowledge-density right here:


      >Ctrl+shift + click on breakpoint column = fast GoTo Statement

      >Tracing from debugger https://blogs.sap.com/2014/06/12/easy-trace-in-new-abap-debugger/

      I didn’t' know about those to, great to learn!


      > To display/debug old list output at any given time – Others->Disply List, or use tool Special tools->Console

      Here I can add something, as there's a whole Blog on it: https://blogs.sap.com/2016/12/22/about-classic-and-standard-abap-debugger-display-list-option/


      I really do like how we all contribute here!

      best

      Joachim

      Author's profile photo Christian Guenter
      Christian Guenter

      I did a talk at SITFRA 2016 called “10 Tipps to improve your ABAP debugging workflow”. Videos of the rehearsal and other materials can be found here.

      https://github.com/christianguenter2/sitFRA_2016

      My personal favorites are:

      • Step size for debugging conditionals and constructor expressions
      • Tracing from Debugger
      • Debugger scripting (some real usecases can be found in the video)
      • Break- and Watchpoint conditions


      Regards,

      Christian

      Author's profile photo Edo von Glan
      Edo von Glan


      I can recommend Christians talk and material!

      I especially use the Debugger script "Stop when pattern XYZ is encountered in the Code" a lot these days. On Christians Github page it is called Statement break / regex Option.

      I made some improvements like multiple search Patterns and a "don't stop multiple times at the same code line" option.

      Author's profile photo Assaf Bresler
      Assaf Bresler

      Amazing tips right here thank you so much!

      The Debugger script for pattern search is really useful

      Author's profile photo Alejandro Jacard Plubins
      Alejandro Jacard Plubins

      This is useful info, though i get the feeling we will eventually change drastically how debugging is performed once everyone is using Eclipse/ADT.

      Also, you should mention SAT and ST12 transactions, which are available from ECC6 EHP4 onwards as i recall.


      Good compilation though!.

      Author's profile photo Joachim Rees
      Joachim Rees

      Thanks for bringing AdT up, I was thinking of mentioning it myself:

      Whenever we talk about debugging, we should ask from time to time: Is the ABAP debugger still the most powerful debugging tool we have? (I'd say, half a year ago it still was).

      Or did AdT-debugger catch up, or even take over?
      Thomas FiedlerFlorian Henninger can you help us out on this one?

      best
      Joachim


      Author's profile photo Armin Beil
      Armin Beil

      Hi Joachim and Community,

      I like the blog and the comments. They are quite interesting to read.

      The standard debugger (formerly known as new debugger) is rich in features and the ADT debugger was not yet able to catch up completely. But the main features are in place.

      Features mentioned in the blog/comments that are available in ADT: system debugging, update debugging, goto line, statement breakpoints, watchpoints, conditional break- & watchpoints, download itab, start trace from debugger (with prepared trace).

      Features mentioned in the blog/comments that are not yet available in ADT: debugger scripts, upload itab, start trace from debugger (without prepared trace), save parameters to SE37, display list, step sizes.

      The quality level of the standard debugger (robustness, performance) is very high. Personally I think that the ADT debugger is actually not yet on the same level, but of course we try to improve the ADT debugger whenever development capacity and priorities allow it. For example, it is currently planned to improve the single step performance on networks with high latency.

      Feedback is always welcome, especially concrete feedback.

      Best regards,
      Armin

      Author's profile photo Joachim Rees
      Joachim Rees

      Thanks a lot for the overview, Armin!

      Author's profile photo Sérgio Fraga
      Sérgio Fraga

      Hello all,

      Very nice blog about the debugger, but as already discussed here, not really advanced features. Neverthelles, very nice initiative!!

      I am currently using ADT for all my developments and normally I use the debugger directly in ADT, but when the time comes to do some hardcore debugging session I still need to jump to the GUI.

      But I am pretty sure ADT will arrive there, it's a matter of time!

      I would just like to add my 15 cents and list another great feature I use a lot:

      Debugger Variants - When I need to stop my session and I and to quicky come back to it, I use a debugger variant with all my settings saved.

      You can find some info in another great blog from Olga Dolinskaja , the debugger Queen 🙂

      Have a nice day

      Sérgio Fraga

      Author's profile photo Frank Buchholz
      Frank Buchholz

      One of the most important breakpoints is the the symbolic name "RFC" which you can use as an ABAP Command breakpoint to stop on any CALL FUNCTION .. DESTINATION statement. Then you can enter the remote function using F5 to continue debugging in the called function.

      Do you know other special code words?


      Author's profile photo Rameez Khan
      Rameez Khan

      Hello All,

      It looks to be an interesting blog which is beautified by the knowledge shared in the comments.

      I am currently working in a project where we insert an "Include" in every exit and enhancement that get created in the system.

      Debugging technique: "Configure Layer Debugging" becomes very useful in such cases.

      I switch on to layer debugging by providing packages as "Z*" and then all I have to is to click on next object set where my debugging point stops on all the objects saved in package starting from Z*. A very useful technique for standard debugging.

      Also we can create debugging profiles and use them as per our requirement.

      Author's profile photo S. Gregory
      S. Gregory


      Hello Marco,

      Thanks for posting the useful information, especially about conditional breakpoints! I have one question that's bugged me for years and I've never found an answer. Maybe you know?

      When the details of an internal table are displayed in square brackets, e.g. [1x6(164)] - What does the number in parenthesis (164) refer to?

      Stuart

      Author's profile photo Sandra Rossi
      Sandra Rossi

      It's the weight of one line = 164 bytes (useful only if you're looking at memory issues). Of course, it doesn't take into account the referenced data objects (string, xstring, objects and data references) which just take 8 bytes each in the line, but the referenced data may occupy much more memory.

      Author's profile photo S. Gregory
      S. Gregory


      Thanks for the detailed explanation Sandra!

      Author's profile photo Aicro Ai
      Aicro Ai

      Hi Marco,

      Thanks for the passage. However, I'm looking for set "Special Dynamic Breakpoints" in ADT. Do you have any idea of that?

      Thanks

      Author's profile photo Muhammad Hasan Mufid
      Muhammad Hasan Mufid

      Thank you Mr. Marco, your articles give me a little Insight about ABAB Debugger because I'm an SAP Functional Consultant and only have a bit knowledge about Debugging ?


      Regards,

      Muhammad Hasan Mufid

      Author's profile photo Gergely Kocse
      Gergely Kocse

      Hi guys,

      is there any method to set breakpoints to non-standard (Z- Y-) namespace program parts during a debugging session?

      I mean to discover if enhancements, badis are influencing the standard run.

      (I heard once that there is a script or so to ignore/bypass them in the run, but I just want to stop by them).

      Thanks and best regards,

      Gergely Kocse

      Author's profile photo Gergely Kocse
      Gergely Kocse

      I found another thread, https://answers.sap.com/questions/10618815/can-debugger-break-on-custom-functions-only.html probably ''layer aware debugger'' is the one I need.

      BR,

      Gergely

      Author's profile photo Michal Unger
      Michal Unger

      Bringing this thread back to life 🙂

      My 2 cents, using the following (purely demo) snippet for what is described below.

      REPORT zdbg_demo.
      
      CLASS c2 DEFINITION DEFERRED.
      
      CLASS c1 DEFINITION.
        PUBLIC SECTION.
          DATA mo2 TYPE REF TO c2.
      ENDCLASS.
      
      CLASS c2 DEFINITION.
        PUBLIC SECTION.
          TYPES ty_tt_i TYPE STANDARD TABLE OF i WITH EMPTY KEY.
          DATA mt TYPE ty_tt_i.
          DATA mo1 TYPE REF TO c1.
          METHODS constructor.
      ENDCLASS.
      
      CLASS c2 IMPLEMENTATION.
        METHOD constructor.
          mt = VALUE #( FOR  i = 1 UNTIL i > 5 ( i ) ).
        ENDMETHOD.
      ENDCLASS.
      
      TYPES:
        BEGIN OF ty_s,
          s     TYPE c LENGTH 1,
          lo_c2 TYPE REF TO c2,
        END OF ty_s,
      
        tt_s TYPE STANDARD TABLE OF ty_s WITH EMPTY KEY.
      DATA lt_s TYPE tt_s.
      
      START-OF-SELECTION.
        DATA(lo1) = NEW c1( ).
        DATA(lo2) = NEW c2( ).
      
        lo1->mo2 = lo2.
        lo2->mo1 = lo1.
        lt_s = VALUE #( ( s     = 'A'
                          lo_c2 = lo2 ) ).
      
        DATA(i) = lt_s[ 1 ]-lo_c2->mt[ 1 ].
      
        BREAK-POINT.
      1. not sure whether this is very obvious but non-trivial variables (structures, instance references) are component-sensitive when double-clicking in Editor in debugger. Particular component is then displayed in Variable Fast Display tool.

        This does not work for direct addressing of internal table entry via row index.

        However, such addressing is possible in Variable Fast Display tool - no spaces in brackets this time.

      2. column configuration for complex types: in my example, there is a table of instances of class which has a member attribute of type internal table. 

        Standard%20table%20content%20display
        To check the content of the member attribute, each reference must be examined with double-click and going back again, one by one. 

        Manual%20check%20of%20individual%20instance%20content
        It might come handy to see which of the collected instances have the table filled (and what number of lines there is) immediately, i.e. while looking at the table of instances. This can be achieved by manipulating the layout of the Table content by adding subcomponents of line components. As long as there is the icon for subcomponents available, still some other components can be added (it might be that the reference points to another reference ... that finally has a member you are interested in). 

        Adding%20the%20subcomponents
        Adjusted%20layout

        Certainly, any subcomponent can be added - reference (to see those which are bound), components of elementary data type (content is displayed) etc.

        Adding subcomponents does not work for direct addressing of table entries - same as point 1) above.

      3. SCC (strongly connected components) detection in Memory objects tab of Memory Analysis tool.

        The same is also visualized with Recursive Reference icon in Data Object Explorer). 


        Any of these options helps to detect (probably) suboptimal design.

      4. Creating and evaluating Traces (for specific query or block of code) directly from the debugger
      5. Getting Memory snapshots for the running program

      BR

      Michal