
- SAP Community
- Products and Technology
- Technology
- Technology Blogs by Members
- Create KPIs with data points and criticality calcu...
Technology Blogs by Members
Explore a vibrant mix of technical expertise, industry insights, and tech buzz in member blogs covering SAP products, technology, and events. Get in the mix!
Turn on suggestions
Auto-suggest helps you quickly narrow down your search results by suggesting possible matches as you type.
Showing results for
feliperodrigues
Contributor
Options
- Subscribe to RSS Feed
- Mark as New
- Mark as Read
- Bookmark
- Subscribe
- Printer Friendly Page
- Report Inappropriate Content
01-22-2018
12:33 AM
Nowadays, most part of the organizations make use of Key Performance Indicators (a.k.a KPIs) to evaluate their success in different activities relevant with their business. A KPI is a measurable value that demonstrates how effectively a company is achieving its objectives.
When we relate KPIs with the SAP Fiori experience the first thing that comes to our minds is the use of SAP Smart Business Applications and the KPI Modeller (more information available here), but what most part of the developers don't know is that this is not the only path available to publish KPIs in an SAP Fiori application.

We know already that Fiori Elements can generate UIs at runtime based on metadata annotations and predefined templates, but one of the most interesting functionalities (and not so widespread) is the ability to publish KPIs using the @UI.dataPoint annotation.
With a measurable field (number, price, quantity or percentage) you can define a threshold and evaluate how the indicator has been performing and display the result in a range of different colors and symbols. This concept is defined as Trend-Criticality Calculation and you can check the official documentation here.

The focus of this post is to explain only the Criticality calculation inside an Overview Page application, but since there are different Fiori Elements providing support to the annotation @UI.dataPoint is possible to adapt the same concepts for different kind of developments (e.g. KPI in the header of an Object Page).
This post covers not only Fiori and UI5 concepts but also ABAP CDS, if you are not familiar with these concepts I advise you to check my previous posts or to have a look in SAP official documentation.
In a criticality calculation we need to provide the following data:
Depending on the selected direction we must define multiple low and high values, let's check in details the available directions and the expected threshold values:


Now that you are able to identify the available scenarios we can start the development of our demo. To construct our application we will use data from SFLIGHTS standard view and create a KPI to check the seating occupancy for each one of the scheduled flights in the system. Comparing the number of occupied seats against the maximum seats available in the plane is possible to generate a percentage value and evaluate the position with a criticality calculation.
The improvement direction in this case must be #MAXIMIZE because the airline wants to sell all the seats available in the plane, if the indicator is showing entries with red color it basically means they need to focus sales in those particular flights with a low occupancy.
The UI5 application will be based on an Overview Page template with a List card with progress bar. When we combine a data point annotation with this card template the framework populates automatically the colors and completion of the bar.
As usual, I'm splitting this post in 3 sections:
Create the view ZDEMO_CRITICALITY_OVP and select data from the view SFLIGHTS. The following fields are expected as the result:
Important points about the annotations used in this CDS view:
This is the expected outcome:

There are 2 ways to create your OData project consuming ABAP CDS views:

Remember always to activate the OData service in the Front-end server (SAP Gateway server) through the transaction /IWFND/MAINT_SERVICE.
The process to create an UI5 application through Web IDE is pretty simple and straightforward, just follow the steps below to create an Overview Page with a list card with progress bar.
Right click in your Workspace folder and click New -> Project from Template.

Template Selection: Create a new project based on a Overview Page.

Basic Information: Define the project name as zdemo_criticality_ovp.

Data Connection: Select your system and OData project.

Annotation Selection: Select the remote annotation provided by the ABAP CDS exposure.

Note #1: All the annotations published in our ABAP CDS view will flow to the UI5 application through this remote source ZDEMO_CRITICALITY_OVP_CDS_VAN. Later on you can see the same annotations inside the XML file inside the localService folder.
Template Customization: Define a namespace, data source, entity type, app title and description. The rest of the configuration doesn't affect this demo.

Finish the wizard and conclude the creation of your Overview Page.
Now we need to configure a List card inside of our application, right click in the main folder of your project, click New -> Card.

Configure Datasource: Select the existing data source and continue.

Select a Card: Select a List card template, no need to mark the extra configuration in the bottom.

Template Customization: Select the entity set, provide a title and fill the card properties with the following data:


Finish the wizard and conclude the creation of your new card.
Note #2: The list flavor must be set as Bar to allow the use of progress bar and provide support to data points with criticality calculation.
Note #3: The list type must be set as Extended to provide extra space for all of our fields.
Note #4: The sort order was just configured like this to increase our chances to find flights with low occupancy during the tests.
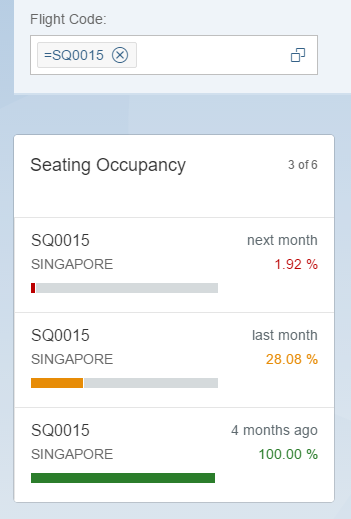
Now the application is concluded and we can start the tests, just filter by Flight Code to navigate across different KPI results. Since we configured a sort by Flight Date the chances to find flights with low occupancy are higher. Check some examples below:


When we relate KPIs with the SAP Fiori experience the first thing that comes to our minds is the use of SAP Smart Business Applications and the KPI Modeller (more information available here), but what most part of the developers don't know is that this is not the only path available to publish KPIs in an SAP Fiori application.
We know already that Fiori Elements can generate UIs at runtime based on metadata annotations and predefined templates, but one of the most interesting functionalities (and not so widespread) is the ability to publish KPIs using the @UI.dataPoint annotation.
With a measurable field (number, price, quantity or percentage) you can define a threshold and evaluate how the indicator has been performing and display the result in a range of different colors and symbols. This concept is defined as Trend-Criticality Calculation and you can check the official documentation here.
The focus of this post is to explain only the Criticality calculation inside an Overview Page application, but since there are different Fiori Elements providing support to the annotation @UI.dataPoint is possible to adapt the same concepts for different kind of developments (e.g. KPI in the header of an Object Page).
This post covers not only Fiori and UI5 concepts but also ABAP CDS, if you are not familiar with these concepts I advise you to check my previous posts or to have a look in SAP official documentation.
What do I need to know about Criticality?
In a criticality calculation we need to provide the following data:
- Improvement direction
- Threshold (low and high values)
Depending on the selected direction we must define multiple low and high values, let's check in details the available directions and the expected threshold values:
- #TARGET: Your key figure must stay inside a specific target in the center of your threshold, deviations in any directions will reflect a bad performance of the indicator.
- Example of an use case: Headcount.
- #MINIMIZE: Your key figure must stay in the lowest part of the threshold to indicate a good performance, deviation in the opposite direction will reflect as bad performance.
- Example of an use case: Work Incidents.
- #MAXIMIZE: Your key figure must stay in the highest part of the threshold to indicate a good performance, deviation in the opposite direction will reflect as bad performance.
- Example of an use case: Sales.
Now that you are able to identify the available scenarios we can start the development of our demo. To construct our application we will use data from SFLIGHTS standard view and create a KPI to check the seating occupancy for each one of the scheduled flights in the system. Comparing the number of occupied seats against the maximum seats available in the plane is possible to generate a percentage value and evaluate the position with a criticality calculation.
The improvement direction in this case must be #MAXIMIZE because the airline wants to sell all the seats available in the plane, if the indicator is showing entries with red color it basically means they need to focus sales in those particular flights with a low occupancy.
The UI5 application will be based on an Overview Page template with a List card with progress bar. When we combine a data point annotation with this card template the framework populates automatically the colors and completion of the bar.
As usual, I'm splitting this post in 3 sections:
- ABAP CDS
- OData Project
- UI5 Project (Web IDE)
ABAP CDS
Create the view ZDEMO_CRITICALITY_OVP and select data from the view SFLIGHTS. The following fields are expected as the result:
- FlightCode: The union of the airline code (CARRID) and the connection number (CONNID). This field should be available inside the list card and in the global filter of the Overview Page.
- FlightDate: Date of the flight, configured as a secondary data point in the list card.
- Destination: The arrival city, expected in the result of the card as well.
- Occupancy: A percentage result based on the calculation of the maximum seats (SEATSMAX) against the occupied seats (SEATSOCC). This field should be configured as a data point to become a KPI about seating occupancy. Extra configurations determine only 2 fractional digits, expected values between 0 and 100, and a criticality calculation with a maximize direction with the following range of colors:
- RED from 0 to 25.
- YELLOW from 26 to 60.
- GREEN from 61 to 100.
- Percentage: Just a unit of measure to associate directly with the occupancy field.
@AbapCatalog.sqlViewName: 'ZDEMOCRITOVP'

@AbapCatalog.compiler.compareFilter: true

@AccessControl.authorizationCheck: #CHECK

@EndUserText.label: 'Criticality OVP'


@OData.publish: true


define view ZDEMO_CRITICALITY_OVP

  as select from sflights as Flight

{

      @EndUserText.label: 'Flight Code'

      @UI: {

          selectionField.position: 10,

          lineItem.position: 10

      }

  key concat(carrid, connid)                as FlightCode,


      @UI: {

          lineItem: {

              type: #AS_DATAPOINT,

              importance: #HIGH,

              position: 20

          },

          dataPoint: {

              title: 'Flight Date'

          }

      }

  key fldate                                as FlightDate,


      @UI.lineItem.position: 20

      cityto                                as Destination,


      @UI: {

          lineItem: {

              type: #AS_DATAPOINT,

              importance: #HIGH,

              position: 10

          },

          dataPoint: {

              title: 'Flight Date',

              valueFormat.numberOfFractionalDigits: 2,

              minimumValue: 0,

              maximumValue: 100,

              criticalityCalculation: {

                  improvementDirection: #MAXIMIZE,

                  deviationRangeLowValue: 25,

                  toleranceRangeLowValue: 60

              }

          }

      }

      @Semantics.quantity.unitOfMeasure: 'Percentage'

      division(seatsocc * 100, seatsmax, 2) as Occupancy,


      @Semantics.unitOfMeasure: true

      cast(' % ' as abap.unit(3))           as Percentage

}
Important points about the annotations used in this CDS view:
- @OData.publish: Used to publish the OData service automatically without the need to create an OData project through transaction SEGW.
- @EndUserText.label: This annotation provides a label to the field.
- @UI.selectionField: This annotation determines the position of the field in the global filter of the Overview Page.
- @UI.lineItem: This annotation determines the position of the fied inside the cell of our list card.
- @UI.dataPoint: This annotation holds the criticality calculation of our KPI. Notice that we use #MAXIMIZE as the improvement direction, so we just need to fill deviationRangeLowValue and toleranceRangeLowValue to determine the threshold (as described by SAP documentation). Also, there is a configuration for decimal places and the minimum and maximum values expected for the field.
- @Semantics.quantity and @Semantics.unitOfMeasure: These annotations define a relation between a quantity field and its respective unit.
This is the expected outcome:
OData Project
There are 2 ways to create your OData project consuming ABAP CDS views:
- Create a new project through SEGW transaction and include your CDS views by Reference. Just right click on the Data Model folder and select Reference -> Data Source.
- Include the @OData.publish annotation in the header of your CDS view, the system will create your OData project automatically based on the field structure and annotations.
@OData.publish: true


define view ZDEMO_CRITICALITY_OVP

  as select from sflights as Flight

{

  ...

}
Remember always to activate the OData service in the Front-end server (SAP Gateway server) through the transaction /IWFND/MAINT_SERVICE.
UI5 Project (Web IDE)
The process to create an UI5 application through Web IDE is pretty simple and straightforward, just follow the steps below to create an Overview Page with a list card with progress bar.
Right click in your Workspace folder and click New -> Project from Template.
Template Selection: Create a new project based on a Overview Page.
Basic Information: Define the project name as zdemo_criticality_ovp.
Data Connection: Select your system and OData project.
Annotation Selection: Select the remote annotation provided by the ABAP CDS exposure.
Note #1: All the annotations published in our ABAP CDS view will flow to the UI5 application through this remote source ZDEMO_CRITICALITY_OVP_CDS_VAN. Later on you can see the same annotations inside the XML file inside the localService folder.
Template Customization: Define a namespace, data source, entity type, app title and description. The rest of the configuration doesn't affect this demo.
Finish the wizard and conclude the creation of your Overview Page.
Now we need to configure a List card inside of our application, right click in the main folder of your project, click New -> Card.
Configure Datasource: Select the existing data source and continue.
Select a Card: Select a List card template, no need to mark the extra configuration in the bottom.
Template Customization: Select the entity set, provide a title and fill the card properties with the following data:
- List Type: Extended
- List Flavor: Bar
- Sort By: Flight Date
- Sort Order: Descending
Finish the wizard and conclude the creation of your new card.
Note #2: The list flavor must be set as Bar to allow the use of progress bar and provide support to data points with criticality calculation.
Note #3: The list type must be set as Extended to provide extra space for all of our fields.
Note #4: The sort order was just configured like this to increase our chances to find flights with low occupancy during the tests.
Now the application is concluded and we can start the tests, just filter by Flight Code to navigate across different KPI results. Since we configured a sort by Flight Date the chances to find flights with low occupancy are higher. Check some examples below:
SQ0015 (Singapore)
AZ0555 (Frankfurt)
LH0402 (New York)

LH2402 (Berlin)
- SAP Managed Tags:
- SAP Fiori,
- SAPUI5,
- SAP Fiori for SAP S/4HANA
14 Comments
You must be a registered user to add a comment. If you've already registered, sign in. Otherwise, register and sign in.
Labels in this area
-
"automatische backups"
1 -
"regelmäßige sicherung"
1 -
505 Technology Updates 53
1 -
ABAP
14 -
ABAP CDS Views
1 -
ABAP CDS Views - BW Extraction
1 -
ABAP CDS Views - CDC (Change Data Capture)
1 -
ABAP Cloud
2 -
ABAP Development
4 -
ABAP Platform Trial
1 -
ABAP Programming
2 -
access data from SAP Datasphere directly from Snowflake
1 -
Access data from SAP datasphere to Qliksense
1 -
Accrual
1 -
action
1 -
adapter modules
1 -
Addon
1 -
Adobe Document Services
1 -
ADS
1 -
ADS Config
1 -
ADS with ABAP
1 -
ADS with Java
1 -
ADT
1 -
Advance Shipping and Receiving
1 -
Advanced Event Mesh
3 -
AEM
1 -
AI
6 -
AI Launchpad
1 -
AI Projects
1 -
AIML
9 -
Alert in Sap analytical cloud
1 -
Amazon S3
1 -
Analytical Dataset
1 -
Analytical Model
1 -
Analytics
1 -
Analyze Workload Data
1 -
annotations
1 -
API
1 -
API and Integration
3 -
API Call
1 -
Application Architecture
1 -
Application Development
5 -
Application Development for SAP HANA Cloud
3 -
Applications and Business Processes (AP)
1 -
Artificial Intelligence
1 -
Artificial Intelligence (AI)
4 -
Artificial Intelligence (AI) 1 Business Trends 363 Business Trends 8 Digital Transformation with Cloud ERP (DT) 1 Event Information 462 Event Information 15 Expert Insights 114 Expert Insights 76 Life at SAP 418 Life at SAP 1 Product Updates 4
1 -
Artificial Intelligence (AI) blockchain Data & Analytics
1 -
Artificial Intelligence (AI) blockchain Data & Analytics Intelligent Enterprise
1 -
Artificial Intelligence (AI) blockchain Data & Analytics Intelligent Enterprise Oil Gas IoT Exploration Production
1 -
Artificial Intelligence (AI) blockchain Data & Analytics Intelligent Enterprise sustainability responsibility esg social compliance cybersecurity risk
1 -
ASE
1 -
ASR
2 -
ASUG
1 -
Attachments
1 -
Authorisations
1 -
Automating Processes
1 -
Automation
1 -
aws
2 -
Azure AI Studio
1 -
B2B Integration
1 -
Backorder Processing
1 -
Backup
1 -
Backup and Recovery
1 -
Backup schedule
1 -
BADI_MATERIAL_CHECK error message
1 -
Bank
1 -
basis
2 -
Basis Monitoring & Tcodes with Key notes
2 -
Batch Management
1 -
Best Practice
1 -
bitcoin
1 -
Blockchain
3 -
BOP in aATP
1 -
BOP Segments
1 -
BOP Strategies
1 -
BOP Variant
1 -
BPC
1 -
BPC LIVE
1 -
BTP
10 -
BTP Destination
2 -
Business AI
1 -
Business and IT Integration
1 -
Business application stu
1 -
Business Architecture
1 -
Business Communication Services
1 -
Business Continuity
1 -
Business Data Fabric
3 -
Business Partner
12 -
Business Partner Master Data
10 -
Business Technology Platform
2 -
Business Trends
1 -
CA
1 -
calculation view
1 -
CAP
2 -
Capgemini
1 -
Catalyst for Efficiency: Revolutionizing SAP Integration Suite with Artificial Intelligence (AI) and
1 -
CCMS
2 -
CDQ
12 -
CDS
2 -
Cental Finance
1 -
Certificates
1 -
CFL
1 -
Change Management
1 -
chatbot
1 -
ChatGPT
2 -
CL_SALV_TABLE
2 -
Cloud ALM Monitoring
1 -
Cloud ALM Operations
1 -
Cloud Extensibility
1 -
Cloud Foundry
3 -
Cloud Integration
6 -
Cloud Platform Integration
2 -
cloudalm
1 -
communication
1 -
Compensation Information Management
1 -
Compensation Management
1 -
Compliance
1 -
Compound Employee API
1 -
Configuration
1 -
Connectors
1 -
Conversion
1 -
Cosine similarity
1 -
cryptocurrency
1 -
CSI
1 -
ctms
1 -
Custom chatbot
3 -
custom fields
1 -
Customer Experience
1 -
Customer Journey
1 -
Customizing
1 -
Cyber Security
2 -
Data
1 -
Data & Analytics
1 -
Data Aging
1 -
Data Analytics
2 -
Data and Analytics (DA)
1 -
Data Archiving
1 -
Data Back-up
1 -
Data Governance
5 -
Data Integration
2 -
Data Quality
12 -
Data Quality Management
12 -
Data Synchronization
1 -
data transfer
1 -
Data Unleashed
1 -
Data Value
8 -
database tables
1 -
Datasphere
2 -
datenbanksicherung
1 -
dba cockpit
1 -
dbacockpit
1 -
Debugging
2 -
Delimiting Pay Components
1 -
Delta Integrations
1 -
Destination
2 -
Developer extensibility
1 -
Developing with SAP Integration Suite
1 -
Devops
1 -
Digital Transformation
1 -
Documentation
1 -
Dot Product
1 -
DQM
1 -
dump database
1 -
dump transaction
1 -
e-Invoice
1 -
E4H Conversion
1 -
edoc
1 -
edocument
1 -
ELA
1 -
Embedded Consolidation
1 -
Embedding
1 -
Embeddings
1 -
Employee Central
1 -
Employee Central Payroll
1 -
Employee Central Time Off
1 -
Employee Information
1 -
Employee Rehires
1 -
Enhancement Request
1 -
Enterprise Architecture
1 -
ETL Business Analytics with SAP Signavio
1 -
Euclidean distance
1 -
Event Dates
1 -
Event Driven Architecture
1 -
Event Mesh
2 -
Event Reason
1 -
EventBasedIntegration
1 -
EWM
1 -
EWM Outbound configuration
1 -
EWM-TM-Integration
1 -
Existing Event Changes
1 -
Expand
1 -
Expert
1 -
Expert Insights
1 -
Fiori
14 -
Fiori Elements
2 -
Fiori SAPUI5
12 -
Flask
1 -
Full Stack
8 -
Funds Management
1 -
Generative AI
1 -
GitHub
8 -
Grants Management
1 -
groovy
1 -
GTP
1 -
HANA
5 -
HANA Cloud
2 -
Hana Cloud Database Integration
2 -
HANA DB
1 -
HANA XS Advanced
1 -
Historical Events
1 -
home labs
1 -
HowTo
1 -
HR Data Management
1 -
html5
8 -
idm
1 -
Implementation
1 -
input parameter
1 -
instant payments
1 -
Integration
2 -
Integration Advisor
1 -
Integration Architecture
1 -
Integration Center
1 -
Integration Suite
1 -
intelligent enterprise
1 -
Java
1 -
job
1 -
Job Information Changes
1 -
Job-Related Events
1 -
Job_Event_Information
1 -
joule
4 -
Journal Entries
1 -
Just Ask
1 -
Kerberos for ABAP
8 -
Kerberos for JAVA
8 -
Launch Wizard
1 -
Learning Content
2 -
Life at SAP
1 -
lightning
1 -
Linear Regression SAP HANA Cloud
1 -
local tax regulations
1 -
LP
1 -
Machine Learning
2 -
Marketing
1 -
Master Data
3 -
Master Data Management
14 -
Maxdb
2 -
MDG
1 -
MDGM
1 -
MDM
1 -
Message box.
1 -
Messages on RF Device
1 -
Microservices Architecture
1 -
Middleware Solutions
1 -
Migration
5 -
ML Model Development
1 -
Modeling in SAP HANA Cloud
8 -
Monitoring
3 -
MTA
1 -
Multi-Record Scenarios
1 -
Multiple Event Triggers
1 -
Neo
1 -
New Event Creation
1 -
New Feature
1 -
NodeJS
1 -
ODATA
1 -
OData APIs
1 -
odatav2
1 -
ODBC
1 -
ODBC Connection
1 -
open source
2 -
OpenAI API
1 -
Oracle
1 -
PaPM
1 -
PaPM Dynamic Data Copy through Writer function
1 -
PaPM Remote Call
1 -
PAS-C01
1 -
Pay Component Management
1 -
PGP
1 -
Pickle
1 -
PLANNING ARCHITECTURE
1 -
Popup in Sap analytical cloud
1 -
PostgrSQL
1 -
POSTMAN
1 -
Process Automation
2 -
Product Updates
4 -
PSM
1 -
Public Cloud
1 -
Python
3 -
Qlik
1 -
Qualtrics
1 -
RAP
3 -
RAP BO
2 -
Record Deletion
1 -
Recovery
1 -
recurring payments
1 -
redeply
1 -
Release
1 -
Remote Consumption Model
1 -
Replication Flows
1 -
Resilience
1 -
REST
1 -
REST API
1 -
Retagging Required
1 -
Risk
1 -
Rolling Kernel Switch
1 -
route
1 -
rules
1 -
S4 HANA
1 -
S4 HANA Cloud
1 -
S4 HANA On-Premise
1 -
S4HANA
3 -
S4HANA_OP_2023
2 -
SAC
10 -
SAC PLANNING
9 -
SAP
3 -
SAP ABAP
1 -
SAP Advanced Event Mesh
1 -
SAP AI Core
8 -
SAP AI Launchpad
8 -
SAP Analytic Cloud Compass
1 -
Sap Analytical Cloud
1 -
SAP Analytics Cloud
4 -
SAP Analytics Cloud for Consolidation
1 -
SAP Analytics Cloud Story
1 -
SAP analytics clouds
1 -
SAP BAS
1 -
SAP Basis
6 -
SAP BODS
1 -
SAP BODS certification.
1 -
SAP BTP
20 -
SAP BTP Build Work Zone
2 -
SAP BTP Cloud Foundry
5 -
SAP BTP Costing
1 -
SAP BTP CTMS
1 -
SAP BTP Innovation
1 -
SAP BTP Migration Tool
1 -
SAP BTP SDK IOS
1 -
SAP Build
11 -
SAP Build App
1 -
SAP Build apps
1 -
SAP Build CodeJam
1 -
SAP Build Process Automation
3 -
SAP Build work zone
10 -
SAP Business Objects Platform
1 -
SAP Business Technology
2 -
SAP Business Technology Platform (XP)
1 -
sap bw
1 -
SAP CAP
1 -
SAP CDC
1 -
SAP CDP
1 -
SAP Certification
1 -
SAP Cloud ALM
4 -
SAP Cloud Integration for Data Services
1 -
SAP cloud platform
8 -
SAP CPI
3 -
SAP CPI (Cloud Platform Integration)
2 -
SAP CPI Discover tab
1 -
sap credential store
1 -
SAP Customer Data Cloud
1 -
SAP Customer Data Platform
1 -
SAP Data Intelligence
1 -
SAP Data Services
1 -
SAP DATABASE
1 -
SAP Dataspher to Non SAP BI tools
1 -
SAP Datasphere
8 -
SAP DRC
1 -
SAP EWM
1 -
SAP Fiori
1 -
SAP Fiori App Embedding
1 -
Sap Fiori Extension Project Using BAS
1 -
SAP GRC
1 -
SAP HCM (Human Capital Management)
1 -
SAP HR Solutions
1 -
SAP IDM
1 -
SAP Integration Suite
9 -
SAP Integrations
4 -
SAP iRPA
2 -
SAP Learning Class
1 -
SAP Learning Hub
1 -
SAP Odata
2 -
SAP PartnerEdge
1 -
sap partners
1 -
SAP Password Reset
1 -
SAP PO Migration
1 -
SAP Prepackaged Content
1 -
SAP Process Automation
2 -
SAP Process Integration
2 -
SAP Process Orchestration
1 -
SAP S4HANA
2 -
SAP S4HANA Cloud
1 -
SAP S4HANA Cloud for Finance
1 -
SAP S4HANA Cloud private edition
1 -
SAP Sandbox
1 -
SAP STMS
1 -
SAP SuccessFactors
2 -
SAP SuccessFactors HXM Core
1 -
SAP Time
1 -
SAP TM
2 -
SAP Trading Partner Management
1 -
SAP UI5
1 -
SAP Upgrade
1 -
SAP-GUI
8 -
SAPBTP
1 -
SAPCPI
1 -
SAPEWM
1 -
sapmentors
1 -
saponaws
1 -
SAPUI5
4 -
schedule
1 -
Secure Login Client Setup
8 -
security
9 -
Selenium Testing
1 -
SET_CELL_TYPE
1 -
SET_CELL_TYPE_COLUMN
1 -
SFTP scenario
2 -
Simplex
1 -
Single Sign On
8 -
Singlesource
1 -
SKLearn
1 -
Software Development
1 -
SOLMAN
1 -
solman 7.2
2 -
Solution Manager
3 -
sp_dumpdb
1 -
sp_dumptrans
1 -
sql script
1 -
SSL
8 -
SSO
8 -
SuccessFactors
1 -
SuccessFactors Time Tracking
1 -
Sybase
1 -
system copy method
1 -
System owner
1 -
Table splitting
1 -
Tax Integration
1 -
Technical article
1 -
Technical articles
1 -
Technology Updates
1 -
Technology Updates
1 -
Technology_Updates
1 -
Threats
1 -
Time Collectors
1 -
Time Off
2 -
Tips and tricks
2 -
Tools
1 -
Trainings & Certifications
1 -
Transport in SAP BODS
1 -
Transport Management
1 -
TypeScript
1 -
unbind
1 -
Unified Customer Profile
1 -
UPB
1 -
Use of Parameters for Data Copy in PaPM
1 -
User Unlock
1 -
VA02
1 -
Vector Database
1 -
Vector Engine
1 -
Visual Studio Code
1 -
VSCode
1 -
Web SDK
1 -
work zone
1 -
workload
1 -
xsa
1 -
XSA Refresh
1
- « Previous
- Next »
Related Content
- SAP Sustainability Footprint Management: Q1-24 Updates & Highlights in Technology Blogs by SAP
- SAP Build Code - Speed up your development with Generative AI Assistant - Joule in Technology Blogs by SAP
- GRC Risk Management Series: Risk Analysis profile in Technology Blogs by Members
- What’s New in SAP Analytics Cloud Release 2024.07 in Technology Blogs by SAP
- SAP Datasphere - Space, Data Integration, and Data Modeling Best Practices in Technology Blogs by SAP
Top kudoed authors
| User | Count |
|---|---|
| 9 | |
| 4 | |
| 4 | |
| 3 | |
| 3 | |
| 3 | |
| 3 | |
| 3 | |
| 3 | |
| 3 |