

- SAP Community
- Products and Technology
- Technology
- Technology Blogs by SAP
- What’s New in SAP Analytics Cloud and SAP Digital ...
Technology Blogs by SAP
Learn how to extend and personalize SAP applications. Follow the SAP technology blog for insights into SAP BTP, ABAP, SAP Analytics Cloud, SAP HANA, and more.
Turn on suggestions
Auto-suggest helps you quickly narrow down your search results by suggesting possible matches as you type.
Showing results for
Product and Topic Expert
Options
- Subscribe to RSS Feed
- Mark as New
- Mark as Read
- Bookmark
- Subscribe
- Printer Friendly Page
- Report Inappropriate Content
01-16-2018
10:28 AM
This blog covers some of the latest new features and enhancements in SAP Analytics Cloud and SAP Digital Boardroom release 2018.01. Please note that the Analytics Cloud Help documentation is updated at the same time as the upgrade to this release, so the links to the help in this blog may not yet be reflected in the help itself.
SAP Analytics Cloud agent version required for data import with this release:
For more information, see System Requirements and Technical Prerequisites.
Note: The following new features delivered in 2018.01 for SAP HANA live connections require HANA revision upgrade:
Feature consumption will require customer's HANA systems to be upgraded to the following version pre-requisites:
Highlights of this release:
Learn with our latest video tutorials
Planning
Apply inverse functions to formulas with restrict or lookup functions
SAP Analytics Cloud now supports inverse formulas for accounts that use “Restrict” or “Lookup” functions. For example, you can enter data on the cost ratio between 2018 and 2017, where the ratio references the 2017 costs which are defined via “Lookup”.

Learn more about inverse formulas
Improved mass data entry functionality
Mass data entry accelerates your ability to input data by allowing you to enter multiple values in a table grid without having to wait for the system to update between entries. With this release, you can work even more efficiently using copy/paste and drag options to populate table cells.

Learn more about mass data entry
New assign feature in forecast layouts
You can now use auto-fill patterns to save time when you assign values to a calculated dimension. Additionally, you can assign “weights” or “amounts” and create specific spreading patterns, and the totals sections of the assign dialog are always displayed.

Learn more about forecast layouts
Modeling
Fewer limitations on exception aggregations
Previously, the number of dimensions allowed in an exception aggregation was limited to:
These restrictions are now removed and you can have several dimensions of the model defined without restrictions.
Please note you are still limited to 1 dimension if the exception aggregation type is FIRST or LAST.
Learn more about exception aggregations
Data Integration
You no longer have to wait for data imports from files (or SuccessFactors, Google BigQuery, Google Drive, OData, BW) into a new or existing model before you move on to a different task. Data acquisition from these sources now conveniently takes place in the background.

Learn more about data importing
We’ve improved the interface to help you access schedules more easily. Instead of going from Connections > Schedules to see the schedules for all models, you can now use the Datasources tab of a given model to see a list of all its queries and schedules.

Mobile
Share links to content from your mobile device
Want to share an SAP Analytics Cloud story with others, straight from your mobile device? You can now use the iOS functionality using other apps to share links to stories and Digital Boardroom presentations. If you are opening a shared link from another iOS app, the content will open automatically in the SAP Analytics Cloud mobile app.
Learn more about mobile
Predictive
Last August, we introduced a new SAP-hosted R environment that would allow you to build R visualizations without the hassle of having to set up your own R server. Previously, this was only available to our EU and APJ tenants. We’ve now expanded this service to our US-based tenants.
Digital Boardroom
With our new canvas zoom controls, you can now zoom in, zoom out, and center the root topic on a Digital Boardroom presentation. You can also pan the canvas to change the visible area of your presentation for an easier viewing experience whether you want to zoom out for an overview or zoom in for more detailed information on each topic.

You can now access a new builder panel on the canvas which allows you to easily edit presentation properties and change the order of child topics in your structure for more organization.

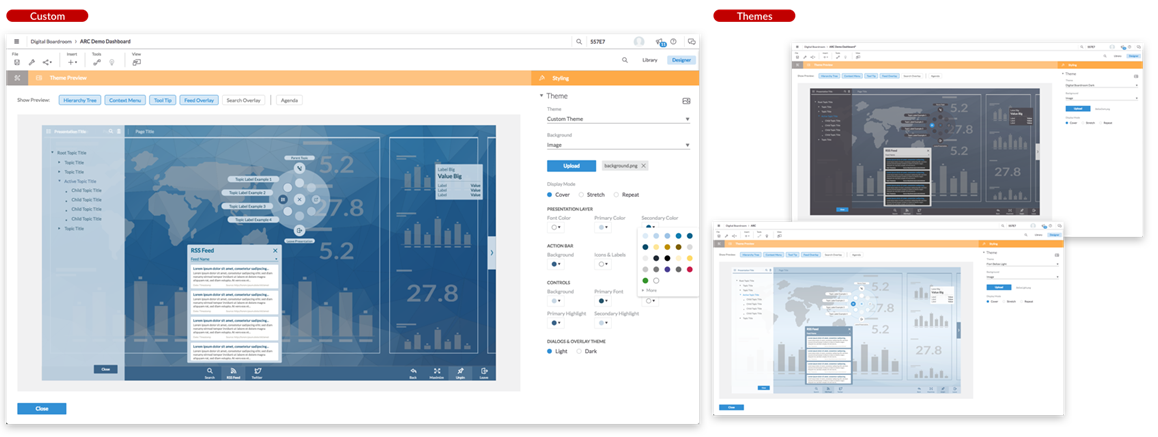
Enhanced color formatting options
Customize your digital boardroom colors with the new enhanced color formatting options. Colors for fonts, the background, highlights, and themes can be immediately previewed.
Data Analysis, Stories and Tables
For live HANA models, you can now use aggregation calculations such as:
You can also use time calculations such as:
HANA revision upgrade is required. Please see above note.

Learn more about advanced stories
SAP Analytics Cloud now supports time, version, and measure-to-measure variances for live HANA models. You can use this feature for comparing your budget and forecast year over year, for example.
HANA revision upgrade is required. Please see above note.
Blending of live HANA models off of views in the same HANA system
You can now blend data from live data models for SAP HANA views that are located on the same system.
HANA revision upgrade is required. Please see above note.

Point of Interest & distance/intersection filter improvements
You can now do distance calculations and filtering between two geo-enriched models. This works either between SAP Analytics Cloud models or between live HANA models based off of views in the same HANA system
We now also have support for creating a Point of Interest (POI) from a geo-enriched model on a live HANA system.
HANA revision upgrade is required. Please see above note.

Learn more about geo maps
Now you can create calculated dimensions by concatenating two different dimensions, or by grouping with IF statements. These calculated dimensions can be used like any regular dimensions for charts, tables, filters, or input controls.
Examples:
Please note that this feature is not supported for live data models.

Learn more about calculations
Threshold conditions based on the percentage of another measure
We’ve amped up the power of thresholds! Now you can create a threshold condition based on the percentage range of another measure meaning you can create ranges with corresponding colors and names, and set the threshold condition relative to another measure.
You could, for example, set thresholds to see how you are doing in terms of your gross margin:
Please note this feature is not yet available for SAP S/4HANA or SAP BW.

Learn more about thresholds
Text wrap for tables and input controls
You can now configure your tables and input controls to wrap their text so it’s easier to read and understand your data.

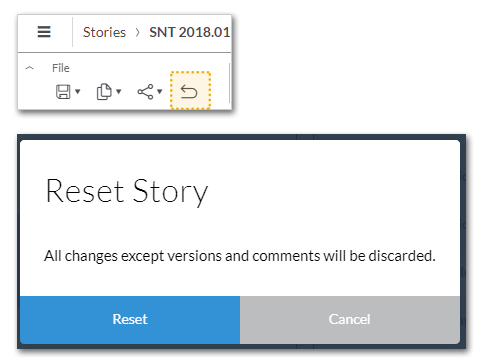
Reset to the original story state
This feature allows users that only have viewing rights to reset all changes made during view time to the original story state. This includes input control changes, chart/table filters created via interactions, and drill actions. Please note the ability to reset is disabled while you are in edit mode and this does not pertain to the data itself.
Variances are now automatically colored based on the account type set in the model. For example, you can easily see if your expenses are “in the red” if they’re greater than your previous period.
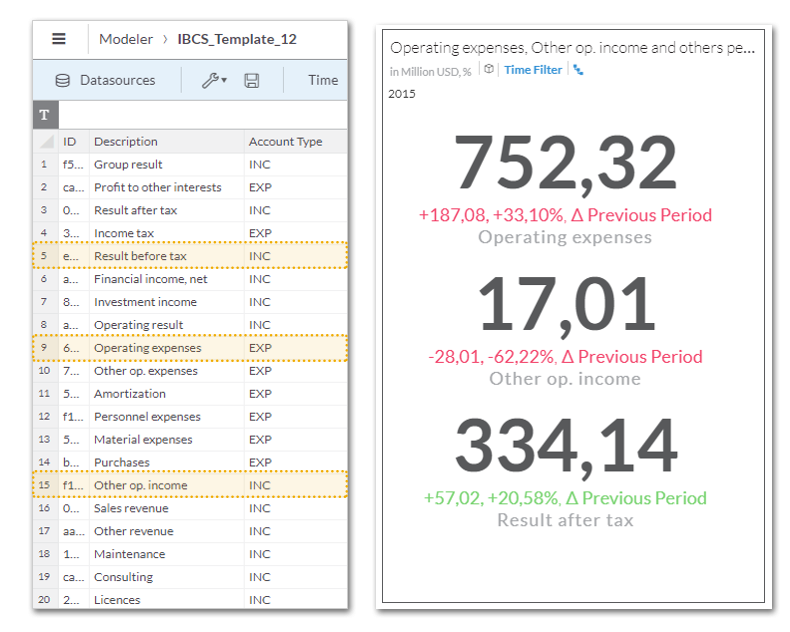
Learn more about variance charts
Warning before story deletion
To prevent the accidental deletion of stories that are used within a Digital Boardroom presentation, you will now receive a warning when you try to delete a story or page that is used within a Digital Boardroom presentation.
Learn more about stories
________________________________________________________________________________
Additional resources:
Previous feature summary blogs:
________________________________________________________________________________
**Legal disclaimer
SAP has no obligation to pursue any course of business outlined in this blog or any related presentation, or to develop or release any functionality mentioned therein. This blog, or any related presentation and SAP’s possible future developments, products and or platforms directions and functionality are all subject to change and may be changed by SAP at any time for any reason without notice. The information in this blog is not a commitment, promise or legal obligation to deliver any material, code, or functionality. This blog is provided without a warranty of any kind, either express or implied, including but not limited to, the implied warranties of merchantability, fitness for a particular purpose, or non-infringement. This blog is for informational purposes and may not be incorporated into a contract. SAP assumes no responsibility for errors or omissions in this document, except if such damages were caused by SAP’s willful misconduct or gross negligence.
All forward-looking statements are subject to various risks and uncertainties that could cause actual results to differ materially from expectations. Readers are cautioned not to place undue reliance on these forward-looking statements, and should not be relied upon in making purchasing decisions.
SAP Analytics Cloud agent version required for data import with this release:
- Version 1.0.85 for SAP Business Warehouse (BW)
- Version 1.0.82 for SAP ERP / SQL databases
- Version 1.0.75 for all other data source types
- Note: Although it is not required, you can upgrade to the new agent version 1.0.89, no matter what data import type you use. Do this to take advantage of updates made to SAP Analytics Cloud agent.
For more information, see System Requirements and Technical Prerequisites.
Note: The following new features delivered in 2018.01 for SAP HANA live connections require HANA revision upgrade:
- Advanced story calculations for live HANA models
- Variance support for live HANA models
- Point of interest & distance/intersection filter improvements
- Blending of live HANA models off of views in the same HANA system
Feature consumption will require customer's HANA systems to be upgraded to the following version pre-requisites:
- For customers on HANA 1.0 support, version support must be SPS12, Revision 122.14 or higher
- For customers on HANA 2.0 support, version support must be SPS01, Revision 012.02 or higher. Additionally, the latest available EPMMDS plugin must be installed. For more information on latest EPM plugin version availability, see SAP Note 2444261.
Highlights of this release:
- Planning: Apply inverse functions to formulas with restrict or lookup functions
- Planning: Improved mass data entry functionality
- Planning: New assign feature in forecast layouts
- Modeling: Fewer limitations on exception aggregations
- Data Integration: Asynchronous data import for file sources
- Data Integration: Navigation between the areas where schedules are managed
- Mobile: Share links to content from your mobile device
- Predictive: R server available to tenants in US-based data centers
- Digital Boardroom: Canvas zoom controls
- Digital Boardroom: Enhanced builder panel
- Digital Boardroom: Enhanced color formatting options
- Data Analysis, Stories, and Tables: Advanced story calculations for live HANA models
- Data Analysis, Stories, and Tables: Variance support for live HANA models
- Data Analysis, Stories, and Tables: Blending of live HANA models off of views in the same HANA syste...
- Data Analysis, Stories, and Tables: Point of interest & distance/intersection filter improvements
- Data Analysis, Stories, and Tables: Calculated dimensions
- Data Analysis, Stories, and Tables: Threshold conditions based on the percentage of another measure
- Data Analysis, Stories, and Tables: Text wrap for tables and input controls
- Data Analysis, Stories, and Tables: Reset to original story state
- Data Analysis, Stories, and Tables: Variance chart colors based on account type
- Data Analysis, Stories, and Tables: Warning before story deletion
Learn with our latest video tutorials
- Create a model from SuccessFactors Workforce Analytics
- Apply filters to a chart in a story
- Apply filters to a geo map in a story
- Full tutorial playlist >
Planning
Apply inverse functions to formulas with restrict or lookup functions
SAP Analytics Cloud now supports inverse formulas for accounts that use “Restrict” or “Lookup” functions. For example, you can enter data on the cost ratio between 2018 and 2017, where the ratio references the 2017 costs which are defined via “Lookup”.
Learn more about inverse formulas
Improved mass data entry functionality
Mass data entry accelerates your ability to input data by allowing you to enter multiple values in a table grid without having to wait for the system to update between entries. With this release, you can work even more efficiently using copy/paste and drag options to populate table cells.
Learn more about mass data entry
New assign feature in forecast layouts
You can now use auto-fill patterns to save time when you assign values to a calculated dimension. Additionally, you can assign “weights” or “amounts” and create specific spreading patterns, and the totals sections of the assign dialog are always displayed.
Learn more about forecast layouts
Modeling
Fewer limitations on exception aggregations
Previously, the number of dimensions allowed in an exception aggregation was limited to:
- 1 dimension for accounts without a formula
- 5 dimensions for accounts with a formula
These restrictions are now removed and you can have several dimensions of the model defined without restrictions.
Please note you are still limited to 1 dimension if the exception aggregation type is FIRST or LAST.
Learn more about exception aggregations
Data Integration
Asynchronous data import for file sources
You no longer have to wait for data imports from files (or SuccessFactors, Google BigQuery, Google Drive, OData, BW) into a new or existing model before you move on to a different task. Data acquisition from these sources now conveniently takes place in the background.
- You will need to keep the browser window open during the upload to avoid cancelling the process
- You will receive a notification once the import process is complete
- Once you have uploaded data, you have seven days to create a model from it
Learn more about data importing
Navigation between the areas where schedules are managed
We’ve improved the interface to help you access schedules more easily. Instead of going from Connections > Schedules to see the schedules for all models, you can now use the Datasources tab of a given model to see a list of all its queries and schedules.
Mobile
Share links to content from your mobile device
Want to share an SAP Analytics Cloud story with others, straight from your mobile device? You can now use the iOS functionality using other apps to share links to stories and Digital Boardroom presentations. If you are opening a shared link from another iOS app, the content will open automatically in the SAP Analytics Cloud mobile app.
Learn more about mobile
Predictive
R Server available to tenants in US-based data centers
Last August, we introduced a new SAP-hosted R environment that would allow you to build R visualizations without the hassle of having to set up your own R server. Previously, this was only available to our EU and APJ tenants. We’ve now expanded this service to our US-based tenants.
Digital Boardroom
Canvas zoom controls
With our new canvas zoom controls, you can now zoom in, zoom out, and center the root topic on a Digital Boardroom presentation. You can also pan the canvas to change the visible area of your presentation for an easier viewing experience whether you want to zoom out for an overview or zoom in for more detailed information on each topic.
Enhanced builder panel
You can now access a new builder panel on the canvas which allows you to easily edit presentation properties and change the order of child topics in your structure for more organization.
Enhanced color formatting options
Customize your digital boardroom colors with the new enhanced color formatting options. Colors for fonts, the background, highlights, and themes can be immediately previewed.
Data Analysis, Stories and Tables
Advanced story calculations for live HANA models
For live HANA models, you can now use aggregation calculations such as:
- Average
- Count
- Min/Max
You can also use time calculations such as:
- Previous Year/Quarter/Month
- Year/Quarter/Month to Date
- “Difference From” calculations such as Year over Year
HANA revision upgrade is required. Please see above note.
Learn more about advanced stories
Variance support for live HANA models
SAP Analytics Cloud now supports time, version, and measure-to-measure variances for live HANA models. You can use this feature for comparing your budget and forecast year over year, for example.
HANA revision upgrade is required. Please see above note.
Blending of live HANA models off of views in the same HANA system
You can now blend data from live data models for SAP HANA views that are located on the same system.
HANA revision upgrade is required. Please see above note.
Point of Interest & distance/intersection filter improvements
You can now do distance calculations and filtering between two geo-enriched models. This works either between SAP Analytics Cloud models or between live HANA models based off of views in the same HANA system
We now also have support for creating a Point of Interest (POI) from a geo-enriched model on a live HANA system.
HANA revision upgrade is required. Please see above note.
Learn more about geo maps
Calculated dimensions
Now you can create calculated dimensions by concatenating two different dimensions, or by grouping with IF statements. These calculated dimensions can be used like any regular dimensions for charts, tables, filters, or input controls.
Examples:
- ‘County, State’ = ‘County’ + ‘, ’ + ‘State’
- Group the States dimension into Region dimension according to East, West, North, South
Please note that this feature is not supported for live data models.
Learn more about calculations
Threshold conditions based on the percentage of another measure
We’ve amped up the power of thresholds! Now you can create a threshold condition based on the percentage range of another measure meaning you can create ranges with corresponding colors and names, and set the threshold condition relative to another measure.
You could, for example, set thresholds to see how you are doing in terms of your gross margin:
- If Gross Margin <= 95% of Previous_Gross Margin, then Red;
- If Gross Margin is between 95% and 105% of Previous_Gross Margin, then Yellow;
- If Gross Margin >=105% of Previous_Gross Margin, then green
Please note this feature is not yet available for SAP S/4HANA or SAP BW.
Learn more about thresholds
Text wrap for tables and input controls
You can now configure your tables and input controls to wrap their text so it’s easier to read and understand your data.
Reset to the original story state
This feature allows users that only have viewing rights to reset all changes made during view time to the original story state. This includes input control changes, chart/table filters created via interactions, and drill actions. Please note the ability to reset is disabled while you are in edit mode and this does not pertain to the data itself.
Variance chart colors based on account type
Variances are now automatically colored based on the account type set in the model. For example, you can easily see if your expenses are “in the red” if they’re greater than your previous period.
Learn more about variance charts
Warning before story deletion
To prevent the accidental deletion of stories that are used within a Digital Boardroom presentation, you will now receive a warning when you try to delete a story or page that is used within a Digital Boardroom presentation.
Learn more about stories
________________________________________________________________________________
Additional resources:
- Video tutorials
- Guided learning
- Events and recordings
- SAP Analytics Cloud help resources
- Official roadmap contains more info on future plans, subject to change.
Previous feature summary blogs:
- SAP Analytics Cloud release 2017.24
- SAP Analytics Cloud release 2017.23
- SAP Analytics Cloud release 2017.22
- SAP Analytics Cloud release 2017.21
- More >
________________________________________________________________________________
**Legal disclaimer
SAP has no obligation to pursue any course of business outlined in this blog or any related presentation, or to develop or release any functionality mentioned therein. This blog, or any related presentation and SAP’s possible future developments, products and or platforms directions and functionality are all subject to change and may be changed by SAP at any time for any reason without notice. The information in this blog is not a commitment, promise or legal obligation to deliver any material, code, or functionality. This blog is provided without a warranty of any kind, either express or implied, including but not limited to, the implied warranties of merchantability, fitness for a particular purpose, or non-infringement. This blog is for informational purposes and may not be incorporated into a contract. SAP assumes no responsibility for errors or omissions in this document, except if such damages were caused by SAP’s willful misconduct or gross negligence.
All forward-looking statements are subject to various risks and uncertainties that could cause actual results to differ materially from expectations. Readers are cautioned not to place undue reliance on these forward-looking statements, and should not be relied upon in making purchasing decisions.
- SAP Managed Tags:
- SAP Analytics Cloud
Labels:
3 Comments
You must be a registered user to add a comment. If you've already registered, sign in. Otherwise, register and sign in.
Labels in this area
-
ABAP CDS Views - CDC (Change Data Capture)
2 -
AI
1 -
Analyze Workload Data
1 -
BTP
1 -
Business and IT Integration
2 -
Business application stu
1 -
Business Technology Platform
1 -
Business Trends
1,661 -
Business Trends
88 -
CAP
1 -
cf
1 -
Cloud Foundry
1 -
Confluent
1 -
Customer COE Basics and Fundamentals
1 -
Customer COE Latest and Greatest
3 -
Customer Data Browser app
1 -
Data Analysis Tool
1 -
data migration
1 -
data transfer
1 -
Datasphere
2 -
Event Information
1,400 -
Event Information
65 -
Expert
1 -
Expert Insights
178 -
Expert Insights
280 -
General
1 -
Google cloud
1 -
Google Next'24
1 -
Kafka
1 -
Life at SAP
784 -
Life at SAP
11 -
Migrate your Data App
1 -
MTA
1 -
Network Performance Analysis
1 -
NodeJS
1 -
PDF
1 -
POC
1 -
Product Updates
4,577 -
Product Updates
330 -
Replication Flow
1 -
RisewithSAP
1 -
SAP BTP
1 -
SAP BTP Cloud Foundry
1 -
SAP Cloud ALM
1 -
SAP Cloud Application Programming Model
1 -
SAP Datasphere
2 -
SAP S4HANA Cloud
1 -
SAP S4HANA Migration Cockpit
1 -
Technology Updates
6,886 -
Technology Updates
408 -
Workload Fluctuations
1
Related Content
- 体验更丝滑!SAP 分析云 2024.07 版功能更新 in Technology Blogs by SAP
- Top Picks: Innovations Highlights from SAP Business Technology Platform (Q1/2024) in Technology Blogs by SAP
- What’s New in SAP Analytics Cloud Release 2024.08 in Technology Blogs by SAP
- Sneak Peek in to SAP Analytics Cloud release for Q2 2024 in Technology Blogs by SAP
- Deep dive into Q4 2023, What’s New in SAP Cloud ALM for Implementation Blog Series in Technology Blogs by SAP
Top kudoed authors
| User | Count |
|---|---|
| 13 | |
| 11 | |
| 10 | |
| 9 | |
| 9 | |
| 7 | |
| 6 | |
| 5 | |
| 5 | |
| 5 |