
- SAP Community
- Products and Technology
- Technology
- Technology Blogs by Members
- Application Telemetry with Prometheus
Technology Blogs by Members
Explore a vibrant mix of technical expertise, industry insights, and tech buzz in member blogs covering SAP products, technology, and events. Get in the mix!
Turn on suggestions
Auto-suggest helps you quickly narrow down your search results by suggesting possible matches as you type.
Showing results for
chairat_onyaem
Participant
Options
- Subscribe to RSS Feed
- Mark as New
- Mark as Read
- Bookmark
- Subscribe
- Printer Friendly Page
- Report Inappropriate Content
01-07-2018
7:25 AM

In my last blog, I've explained about deployment pipeline I built for Continuous Integration and Continuous Delivery in ABAP. Another thing that our team has built was the application monitoring.
For our Java Spring Boot services, it can seamlessly integrate Prometheus module in the POM file and then your application is ready to be monitored with built-in metrics.
I managed to create Prometheus client for ABAP. I will explain how you can setup one for yours below.
What is Prometheus?

Prometheus is a time series database. It stores your data stream and it also has a web interface so you can query and visualize the data e.g. into a graph.
Imagine a temperature measured from a thermometer at regular interval. This is a time series data. In IT operations, this can be like CPU usage, memory allocated, etc. But in our case, we just want to monitor our application.
The concept I like is that the server will poll the data from applications instead of getting applications sending the data to the server. This ensures that monitoring will never break your application. If the monitoring server down, your applications are still running fine.
Visit their website to learn more.
Why do we need to monitor our application?
Well, have you ever wondered about the feature that you build, how much is it used by the users? How fast or slow is it? What if you want to experiment which button color would attract the customer better?
To answer these questions, you need some kind of monitoring, some kind of metric that you can measure.
Let's start!
In this example, I will show you how we can monitor usage and response time of ABAP HelloWorld RESTful APIs.
Cloning repository
- Clone HelloWorld RESTful APIs using abapGit. Test and make sure it works. Follow this blog for more detail.
- Clone Prometheus client for ABAP using abapGit.
If you have a problem cloning the class and Shared Memory Area
ZCL_SHR_PROMETHEUS_AREA then you can create it on your own as this class is automatically generated from the transaction SHMA. Make sure you configure it precisely as shown below.
Recording metrics in your application
Prepare runtime for duration metric.
Create a new instance attribute for the timer instance.
DATA runtime TYPE REF TO if_abap_runtime.In the constructor, create the timer instance.
  METHOD constructor.

    super->constructor( ).

    me->runtime = cl_abap_runtime=>create_hr_timer( ).

  ENDMETHOD.
Create a new method in the REST resource class (ZCL_REST_RESOURCE).
    METHODS record_metric

      IMPORTING

        i_method   TYPE string

        i_response TYPE i.
The method accepts HTTP method and response status code which we will put in the metrics.
  METHOD record_metric.


    TRY.

        zcl_prometheus=>set_instance_from_request( me->mo_request ).

        zcl_prometheus=>write_multiple( VALUE #(

          ( key = |hello_count\{method="{ i_method }",status="{ i_response }"\}| value = '1' command = zif_prometheus=>c_command-increment )

          ( key = |hello_duration\{method="{ i_method }",status="{ i_response }"\}| value = me->runtime->get_runtime( ) ) ) ).

      CATCH cx_root.

    ENDTRY.


  ENDMETHOD.
set_instance* methods will set the Shared Memory Area instance that you can see in the transaction
SHMM. So you can use one instance for each application and the metrics can be kept and queried separately.set_instance_from_request will set the instance from the root endpoint by default (i.e. hello) if not explicitly specified by instance attribute or query parameter.
There are three fields you need to pass when you want to record metrics (via write* methods)
- key is the metric name and its label according to Prometheus data model and metric naming convention.
- value is the value to record
- command is optional and is 'overwrite' by default. Using increment will add value to the current so you don't need to read and write on your own.
Surround the method with try...catch... so this codes will (almost) never break your application.
Then you call this method at the end of each REST handler. Don't forget to start the timer at the beginning.
For example:
  METHOD if_rest_resource~get.

    me->runtime->get_runtime( ).

    .

    .

    .


    record_metric( i_method = mo_request->get_method( ) i_response = cl_rest_status_code=>gc_success_ok ).

  ENDMETHOD.
Creating the metrics endpoint
Next, you need an endpoint for Prometheus server to call and grab the metrics data.
In REST handler class (ZCL_REST_HANDLER), insert the following routing string in the method
if_rest_application~get_root_handler.lo_router->attach( iv_template = '/hello/metrics' iv_handler_class = zcl_prometheus_rest_resource=>c_class_name ).Testing your endpoint
Open your browser and open your /hello/metrics endpoint. You should see a blank page.

Try using your application so the metrics are recorded.
In case you’re using Postman to test the APIs you can import my Postman files from here.(Please note Postman is a commercial product but there’s a free version available)
After one GET and one POST request, refresh the metrics page and you should start seeing the data.

Now, your application is ready to be monitored
Setting up Prometheus Server
Installing Prometheus
Download Prometheus from this page. Extract the package and you can run the executable without installing.
Note: If you want to install as a window service, you can use NSSM.
Open browser and go to http://localhost:9090. and you should see its web UI.
Adding a new job to monitor your application
Now, your Prometheus server does not yet recognize your application so you need to configure it first.
Edit the file
prometheus.yml and add the following lines:- job_name: npl-test
params:
sap-client: ['001']
sap-language: ['EN']
metrics_path: /test/hello/metrics
basic_auth:
username: DEVELOPER
password: yourpassword
static_configs:
- targets:
- vhcalnplci.dummy.nodomain:8000
In your secured environment, you may want to use HTTPS like this:
  - job_name: npl-test


    scheme: https

    params:

      sap-client: ['001']

      sap-language: ['EN']

    metrics_path: '/test/hello/metrics'

    basic_auth:

      username: DEVELOPER

      password: yourpassword

    tls_config:

      insecure_skip_verify: true

    static_configs:

      - targets: ['vhcalnplci.dummy.nodomain:44300']
Please note that you should add one job for each application server. Don't use load balance URL as the metrics are bound for each application server. Go to transaction
SM51 to see the list of all application servers on the system.After saving, restart the service and access the web UI. Query for up metric and click Execute. If your job is setup properly, you should see the value 1.
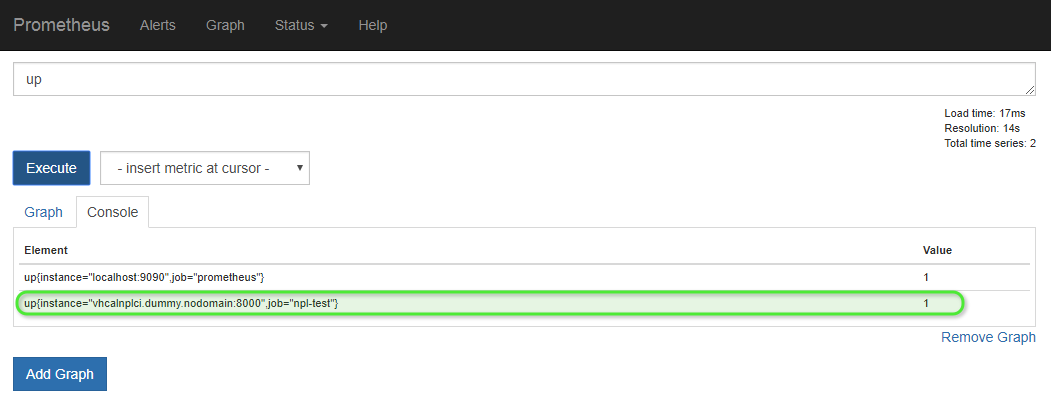
You may try querying your application metric e.g. hello_count.

Setting up Grafana
Prometheus is good at collecting and querying time series data but to have a better a visualization you may need Grafana.

Grafana Sample Dashboard
What is Grafana?
Grafana is a tool for data visualization & monitoring with support for Graphite, InfluxDB, Prometheus, Elasticsearch and many more databases. In short, Grafana will pull the data from Prometheus and visualize them on their dashboard web interface.
We setup a desktop PC with two monitoring screens and put it where the team can see easily.
Installation
Download from here. Extract and run it the same way you do for Prometheus.
Setting up data source
First, we need to setup Grafana to recognize Prometheus server.
Go to http://localhost:3000 and log in with default username and password (i.e. admin:admin). Select Data Source from the menu and click Add Data Source. Fill in the connection to your Prometheus server like below:

Setting up dashboard
We're going to setup 2 graphs to monitor API usage count and response time.
Select Dashboards from the menu, click Home and click
+ New Dashboard.Select Graph. Click the graph title and select Edit.
On tab General, name your graph title as you wish.
On tab Metrics, you will specify which metric data will be displayed on this graph. Fill in
hello_count and put {{method}} ({{status}}) in Legend format.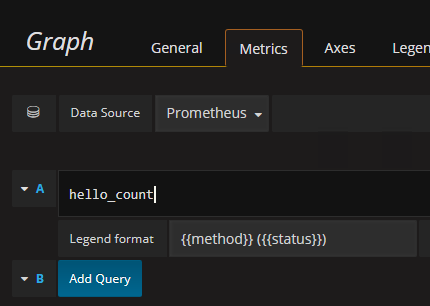
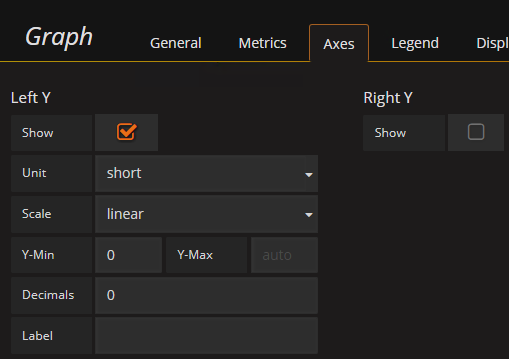
On tab Axes, you can customize the graph axes.
Once done customizing, click Back to dashboard on the top-right.
Click
+ ADD ROW to add a new row and create a new graph.Configure tab Metrics with
hello_duration with the same Legend format.Configure tab Axes like this:

Once done, you should see your dashboard like this.

Don't forget to set the time range and refresh rate so your monitor screen keeps refreshing with the latest data.

Try to use your application and see how the graph reflect.

- SAP Managed Tags:
- ABAP Development,
- NW ABAP Monitoring Tools
10 Comments
You must be a registered user to add a comment. If you've already registered, sign in. Otherwise, register and sign in.
Labels in this area
-
"automatische backups"
1 -
"regelmäßige sicherung"
1 -
"TypeScript" "Development" "FeedBack"
1 -
505 Technology Updates 53
1 -
ABAP
14 -
ABAP API
1 -
ABAP CDS Views
2 -
ABAP CDS Views - BW Extraction
1 -
ABAP CDS Views - CDC (Change Data Capture)
1 -
ABAP class
2 -
ABAP Cloud
2 -
ABAP Development
5 -
ABAP in Eclipse
1 -
ABAP Platform Trial
1 -
ABAP Programming
2 -
abap technical
1 -
absl
2 -
access data from SAP Datasphere directly from Snowflake
1 -
Access data from SAP datasphere to Qliksense
1 -
Accrual
1 -
action
1 -
adapter modules
1 -
Addon
1 -
Adobe Document Services
1 -
ADS
1 -
ADS Config
1 -
ADS with ABAP
1 -
ADS with Java
1 -
ADT
2 -
Advance Shipping and Receiving
1 -
Advanced Event Mesh
3 -
AEM
1 -
AI
7 -
AI Launchpad
1 -
AI Projects
1 -
AIML
9 -
Alert in Sap analytical cloud
1 -
Amazon S3
1 -
Analytical Dataset
1 -
Analytical Model
1 -
Analytics
1 -
Analyze Workload Data
1 -
annotations
1 -
API
1 -
API and Integration
3 -
API Call
2 -
Application Architecture
1 -
Application Development
5 -
Application Development for SAP HANA Cloud
3 -
Applications and Business Processes (AP)
1 -
Artificial Intelligence
1 -
Artificial Intelligence (AI)
5 -
Artificial Intelligence (AI) 1 Business Trends 363 Business Trends 8 Digital Transformation with Cloud ERP (DT) 1 Event Information 462 Event Information 15 Expert Insights 114 Expert Insights 76 Life at SAP 418 Life at SAP 1 Product Updates 4
1 -
Artificial Intelligence (AI) blockchain Data & Analytics
1 -
Artificial Intelligence (AI) blockchain Data & Analytics Intelligent Enterprise
1 -
Artificial Intelligence (AI) blockchain Data & Analytics Intelligent Enterprise Oil Gas IoT Exploration Production
1 -
Artificial Intelligence (AI) blockchain Data & Analytics Intelligent Enterprise sustainability responsibility esg social compliance cybersecurity risk
1 -
ASE
1 -
ASR
2 -
ASUG
1 -
Attachments
1 -
Authorisations
1 -
Automating Processes
1 -
Automation
2 -
aws
2 -
Azure
1 -
Azure AI Studio
1 -
B2B Integration
1 -
Backorder Processing
1 -
Backup
1 -
Backup and Recovery
1 -
Backup schedule
1 -
BADI_MATERIAL_CHECK error message
1 -
Bank
1 -
BAS
1 -
basis
2 -
Basis Monitoring & Tcodes with Key notes
2 -
Batch Management
1 -
BDC
1 -
Best Practice
1 -
bitcoin
1 -
Blockchain
3 -
bodl
1 -
BOP in aATP
1 -
BOP Segments
1 -
BOP Strategies
1 -
BOP Variant
1 -
BPC
1 -
BPC LIVE
1 -
BTP
12 -
BTP Destination
2 -
Business AI
1 -
Business and IT Integration
1 -
Business application stu
1 -
Business Application Studio
1 -
Business Architecture
1 -
Business Communication Services
1 -
Business Continuity
1 -
Business Data Fabric
3 -
Business Partner
12 -
Business Partner Master Data
10 -
Business Technology Platform
2 -
Business Trends
4 -
CA
1 -
calculation view
1 -
CAP
3 -
Capgemini
1 -
CAPM
1 -
Catalyst for Efficiency: Revolutionizing SAP Integration Suite with Artificial Intelligence (AI) and
1 -
CCMS
2 -
CDQ
12 -
CDS
2 -
Cental Finance
1 -
Certificates
1 -
CFL
1 -
Change Management
1 -
chatbot
1 -
chatgpt
3 -
CL_SALV_TABLE
2 -
Class Runner
1 -
Classrunner
1 -
Cloud ALM Monitoring
1 -
Cloud ALM Operations
1 -
cloud connector
1 -
Cloud Extensibility
1 -
Cloud Foundry
4 -
Cloud Integration
6 -
Cloud Platform Integration
2 -
cloudalm
1 -
communication
1 -
Compensation Information Management
1 -
Compensation Management
1 -
Compliance
1 -
Compound Employee API
1 -
Configuration
1 -
Connectors
1 -
Consolidation Extension for SAP Analytics Cloud
2 -
Control Indicators.
1 -
Controller-Service-Repository pattern
1 -
Conversion
1 -
Cosine similarity
1 -
cryptocurrency
1 -
CSI
1 -
ctms
1 -
Custom chatbot
3 -
Custom Destination Service
1 -
custom fields
1 -
Customer Experience
1 -
Customer Journey
1 -
Customizing
1 -
cyber security
3 -
cybersecurity
1 -
Data
1 -
Data & Analytics
1 -
Data Aging
1 -
Data Analytics
2 -
Data and Analytics (DA)
1 -
Data Archiving
1 -
Data Back-up
1 -
Data Flow
1 -
Data Governance
5 -
Data Integration
2 -
Data Quality
12 -
Data Quality Management
12 -
Data Synchronization
1 -
data transfer
1 -
Data Unleashed
1 -
Data Value
8 -
database tables
1 -
Datasphere
3 -
datenbanksicherung
1 -
dba cockpit
1 -
dbacockpit
1 -
Debugging
2 -
Delimiting Pay Components
1 -
Delta Integrations
1 -
Destination
3 -
Destination Service
1 -
Developer extensibility
1 -
Developing with SAP Integration Suite
1 -
Devops
1 -
digital transformation
1 -
Documentation
1 -
Dot Product
1 -
DQM
1 -
dump database
1 -
dump transaction
1 -
e-Invoice
1 -
E4H Conversion
1 -
Eclipse ADT ABAP Development Tools
2 -
edoc
1 -
edocument
1 -
ELA
1 -
Embedded Consolidation
1 -
Embedding
1 -
Embeddings
1 -
Employee Central
1 -
Employee Central Payroll
1 -
Employee Central Time Off
1 -
Employee Information
1 -
Employee Rehires
1 -
Enable Now
1 -
Enable now manager
1 -
endpoint
1 -
Enhancement Request
1 -
Enterprise Architecture
1 -
ETL Business Analytics with SAP Signavio
1 -
Euclidean distance
1 -
Event Dates
1 -
Event Driven Architecture
1 -
Event Mesh
2 -
Event Reason
1 -
EventBasedIntegration
1 -
EWM
1 -
EWM Outbound configuration
1 -
EWM-TM-Integration
1 -
Existing Event Changes
1 -
Expand
1 -
Expert
2 -
Expert Insights
2 -
Exploits
1 -
Fiori
14 -
Fiori Elements
2 -
Fiori SAPUI5
12 -
Flask
1 -
Full Stack
8 -
Funds Management
1 -
General
1 -
General Splitter
1 -
Generative AI
1 -
Getting Started
1 -
GitHub
8 -
Grants Management
1 -
GraphQL
1 -
groovy
1 -
GTP
1 -
HANA
6 -
HANA Cloud
2 -
Hana Cloud Database Integration
2 -
HANA DB
2 -
HANA XS Advanced
1 -
Historical Events
1 -
home labs
1 -
HowTo
1 -
HR Data Management
1 -
html5
8 -
HTML5 Application
1 -
Identity cards validation
1 -
idm
1 -
Implementation
1 -
input parameter
1 -
instant payments
1 -
Integration
3 -
Integration Advisor
1 -
Integration Architecture
1 -
Integration Center
1 -
Integration Suite
1 -
intelligent enterprise
1 -
iot
1 -
Java
1 -
job
1 -
Job Information Changes
1 -
Job-Related Events
1 -
Job_Event_Information
1 -
joule
4 -
Journal Entries
1 -
Just Ask
1 -
Kerberos for ABAP
8 -
Kerberos for JAVA
8 -
KNN
1 -
Launch Wizard
1 -
Learning Content
2 -
Life at SAP
5 -
lightning
1 -
Linear Regression SAP HANA Cloud
1 -
Loading Indicator
1 -
local tax regulations
1 -
LP
1 -
Machine Learning
2 -
Marketing
1 -
Master Data
3 -
Master Data Management
14 -
Maxdb
2 -
MDG
1 -
MDGM
1 -
MDM
1 -
Message box.
1 -
Messages on RF Device
1 -
Microservices Architecture
1 -
Microsoft Universal Print
1 -
Middleware Solutions
1 -
Migration
5 -
ML Model Development
1 -
Modeling in SAP HANA Cloud
8 -
Monitoring
3 -
MTA
1 -
Multi-Record Scenarios
1 -
Multiple Event Triggers
1 -
Myself Transformation
1 -
Neo
1 -
New Event Creation
1 -
New Feature
1 -
Newcomer
1 -
NodeJS
2 -
ODATA
2 -
OData APIs
1 -
odatav2
1 -
ODATAV4
1 -
ODBC
1 -
ODBC Connection
1 -
Onpremise
1 -
open source
2 -
OpenAI API
1 -
Oracle
1 -
PaPM
1 -
PaPM Dynamic Data Copy through Writer function
1 -
PaPM Remote Call
1 -
PAS-C01
1 -
Pay Component Management
1 -
PGP
1 -
Pickle
1 -
PLANNING ARCHITECTURE
1 -
Popup in Sap analytical cloud
1 -
PostgrSQL
1 -
POSTMAN
1 -
Process Automation
2 -
Product Updates
4 -
PSM
1 -
Public Cloud
1 -
Python
4 -
Qlik
1 -
Qualtrics
1 -
RAP
3 -
RAP BO
2 -
Record Deletion
1 -
Recovery
1 -
recurring payments
1 -
redeply
1 -
Release
1 -
Remote Consumption Model
1 -
Replication Flows
1 -
research
1 -
Resilience
1 -
REST
1 -
REST API
2 -
Retagging Required
1 -
Risk
1 -
Rolling Kernel Switch
1 -
route
1 -
rules
1 -
S4 HANA
1 -
S4 HANA Cloud
1 -
S4 HANA On-Premise
1 -
S4HANA
3 -
S4HANA_OP_2023
2 -
SAC
10 -
SAC PLANNING
9 -
SAP
4 -
SAP ABAP
1 -
SAP Advanced Event Mesh
1 -
SAP AI Core
8 -
SAP AI Launchpad
8 -
SAP Analytic Cloud Compass
1 -
Sap Analytical Cloud
1 -
SAP Analytics Cloud
4 -
SAP Analytics Cloud for Consolidation
3 -
SAP Analytics Cloud Story
1 -
SAP analytics clouds
1 -
SAP BAS
1 -
SAP Basis
6 -
SAP BODS
1 -
SAP BODS certification.
1 -
SAP BTP
21 -
SAP BTP Build Work Zone
2 -
SAP BTP Cloud Foundry
6 -
SAP BTP Costing
1 -
SAP BTP CTMS
1 -
SAP BTP Innovation
1 -
SAP BTP Migration Tool
1 -
SAP BTP SDK IOS
1 -
SAP Build
11 -
SAP Build App
1 -
SAP Build apps
1 -
SAP Build CodeJam
1 -
SAP Build Process Automation
3 -
SAP Build work zone
10 -
SAP Business Objects Platform
1 -
SAP Business Technology
2 -
SAP Business Technology Platform (XP)
1 -
sap bw
1 -
SAP CAP
2 -
SAP CDC
1 -
SAP CDP
1 -
SAP CDS VIEW
1 -
SAP Certification
1 -
SAP Cloud ALM
4 -
SAP Cloud Application Programming Model
1 -
SAP Cloud Integration for Data Services
1 -
SAP cloud platform
8 -
SAP Companion
1 -
SAP CPI
3 -
SAP CPI (Cloud Platform Integration)
2 -
SAP CPI Discover tab
1 -
sap credential store
1 -
SAP Customer Data Cloud
1 -
SAP Customer Data Platform
1 -
SAP Data Intelligence
1 -
SAP Data Migration in Retail Industry
1 -
SAP Data Services
1 -
SAP DATABASE
1 -
SAP Dataspher to Non SAP BI tools
1 -
SAP Datasphere
9 -
SAP DRC
1 -
SAP EWM
1 -
SAP Fiori
3 -
SAP Fiori App Embedding
1 -
Sap Fiori Extension Project Using BAS
1 -
SAP GRC
1 -
SAP HANA
1 -
SAP HCM (Human Capital Management)
1 -
SAP HR Solutions
1 -
SAP IDM
1 -
SAP Integration Suite
9 -
SAP Integrations
4 -
SAP iRPA
2 -
SAP LAGGING AND SLOW
1 -
SAP Learning Class
1 -
SAP Learning Hub
1 -
SAP Master Data
1 -
SAP Odata
2 -
SAP on Azure
1 -
SAP PartnerEdge
1 -
sap partners
1 -
SAP Password Reset
1 -
SAP PO Migration
1 -
SAP Prepackaged Content
1 -
SAP Process Automation
2 -
SAP Process Integration
2 -
SAP Process Orchestration
1 -
SAP S4HANA
2 -
SAP S4HANA Cloud
1 -
SAP S4HANA Cloud for Finance
1 -
SAP S4HANA Cloud private edition
1 -
SAP Sandbox
1 -
SAP STMS
1 -
SAP successfactors
3 -
SAP SuccessFactors HXM Core
1 -
SAP Time
1 -
SAP TM
2 -
SAP Trading Partner Management
1 -
SAP UI5
1 -
SAP Upgrade
1 -
SAP Utilities
1 -
SAP-GUI
8 -
SAP_COM_0276
1 -
SAPBTP
1 -
SAPCPI
1 -
SAPEWM
1 -
sapmentors
1 -
saponaws
2 -
SAPS4HANA
1 -
SAPUI5
5 -
schedule
1 -
Script Operator
1 -
Secure Login Client Setup
8 -
security
9 -
Selenium Testing
1 -
Self Transformation
1 -
Self-Transformation
1 -
SEN
1 -
SEN Manager
1 -
service
1 -
SET_CELL_TYPE
1 -
SET_CELL_TYPE_COLUMN
1 -
SFTP scenario
2 -
Simplex
1 -
Single Sign On
8 -
Singlesource
1 -
SKLearn
1 -
Slow loading
1 -
soap
1 -
Software Development
1 -
SOLMAN
1 -
solman 7.2
2 -
Solution Manager
3 -
sp_dumpdb
1 -
sp_dumptrans
1 -
SQL
1 -
sql script
1 -
SSL
8 -
SSO
8 -
Substring function
1 -
SuccessFactors
1 -
SuccessFactors Platform
1 -
SuccessFactors Time Tracking
1 -
Sybase
1 -
system copy method
1 -
System owner
1 -
Table splitting
1 -
Tax Integration
1 -
Technical article
1 -
Technical articles
1 -
Technology Updates
14 -
Technology Updates
1 -
Technology_Updates
1 -
terraform
1 -
Threats
2 -
Time Collectors
1 -
Time Off
2 -
Time Sheet
1 -
Time Sheet SAP SuccessFactors Time Tracking
1 -
Tips and tricks
2 -
toggle button
1 -
Tools
1 -
Trainings & Certifications
1 -
Transformation Flow
1 -
Transport in SAP BODS
1 -
Transport Management
1 -
TypeScript
2 -
ui designer
1 -
unbind
1 -
Unified Customer Profile
1 -
UPB
1 -
Use of Parameters for Data Copy in PaPM
1 -
User Unlock
1 -
VA02
1 -
Validations
1 -
Vector Database
2 -
Vector Engine
1 -
Visual Studio Code
1 -
VSCode
1 -
Vulnerabilities
1 -
Web SDK
1 -
work zone
1 -
workload
1 -
xsa
1 -
XSA Refresh
1
- « Previous
- Next »
Related Content
- Kyma Integration with SAP Cloud Logging. Part 2: Let's ship some traces in Technology Blogs by SAP
- SAP Cloud Logging Serviceでコンテナメトリクスを監視する in Technology Blogs by SAP
- Kyma Integration with SAP Cloud Logging. Part 1: Introduction and shipping Logs in Technology Blogs by SAP
- What's New in the Newly Repackaged SAP Integration Suite, advanced event mesh in Technology Blogs by SAP
- 10+ ways to reshape your SAP landscape with SAP Business Technology Platform – Blog Series in Technology Blogs by SAP
Top kudoed authors
| User | Count |
|---|---|
| 8 | |
| 5 | |
| 5 | |
| 4 | |
| 4 | |
| 4 | |
| 4 | |
| 4 | |
| 3 | |
| 3 |