
- SAP Community
- Products and Technology
- Technology
- Technology Blogs by SAP
- Create Planning Model from scratch in SAP Analytic...
Technology Blogs by SAP
Learn how to extend and personalize SAP applications. Follow the SAP technology blog for insights into SAP BTP, ABAP, SAP Analytics Cloud, SAP HANA, and more.
Turn on suggestions
Auto-suggest helps you quickly narrow down your search results by suggesting possible matches as you type.
Showing results for
Product and Topic Expert
Options
- Subscribe to RSS Feed
- Mark as New
- Mark as Read
- Bookmark
- Subscribe
- Printer Friendly Page
- Report Inappropriate Content
12-28-2017
5:57 PM
SAP Analytics Cloud (SAC): In this blog we will create Planning Model from scratch. To do this as the first step we will try to create Dimensions, after dimensions are created we will load Master Data into the Dimensions. After master data is loaded into Dimensions, save the Model to create Planning Model. As the last step we will try to load the Actual Data into the Planning Model.
SAP® Analytics Cloud is a next-generation software-as-a-service (SaaS) solution for Analytics, Planning and Predictive features. It is built on SAP HANA® Cloud Platform. SAC can connect to different types of on-prem and cloud based data sources. Within SAC we have 2 types of connections i.e. the Acquisition type of connection where data is downloaded into the SAC and Live connection where data is real time.
After the SAC tenant has been setup, next step is to create the connection between SAC and Data Source. Once the connection is established between SAC and Data source, the third step is to create models on top of Data sources. Once the Model is created, user can start creating Analytics or Planning or use Predictive features to generate some predictive analytics using the model.
In SAC we have 2 types of Models. The Analytical Model and Planning Model. A Model consists of Dimensions and Measures.
Analytical Model : It consists of Account dimension which is the required dimension and can have ‘n’ number of generic dimensions.
Planning Model: It consists of Time, Category, Account and Organizational dimensions which are the required dimensions. Like Analytical Model it can have ‘n’ number of generic dimensions.
As mentioned before we will create the Planning Model in this blog. Below are the step by step instructions on how to create the Planning Model in the SAP Analytics Cloud (SAC).
Planning Model:
To create Model in SAC, from the Main menu , let’s go to Home – Create – Model Page option. Select the Start with a blank model option and give name to the Model. Select the Enable Planning option if you want to create the Planning Model. If this option is not selected then by default Analytical Model will be created. We will select the Enable Planning option as we want to create the Planning Model

Figure 1
Let's select the Start with blank model option as we want to create the dimensions.

Figure 2
Provide a name to the Model and check the Enable Planning option

Figure 3
You can set the preferences for models under the settings option. Select the Wrench icon and click on the arrow facing downwards to open the Preferences as shown in the Figure 4
Model Preferences:

Figure 4

Figure 5

Figure 6
Next for the Time dimension select the lowest granularity i.e. Year or Quarter or Month and select the start and end time as shown in the Figure 7 and 8.

Figure 7

Figure 8
After selecting the Time dimension parameters, next when you scroll down you can see the Categories. Let’s define the versions frequency like Monthly for Actuals, Quarterly for Budgeting, Yearly forecasting so on depending on your Planning requirements. The Time and Categories dimensions are proposed by systems unlike other dimensions where you have to create each dimension manually.
When you click on the + icon besides the Account dimension, it gives the option to create new Account Dimension or select an existing Account dimension. If you create the Account dimension as public dimension then you can share the Account dimension between models else it will be available only to the model which you create.

Figure 9

Figure 10
Create a new Account Dimension by giving Name and Description. The Type should be Account type. The Type is automatically selected, if not make sure you select the Account from the dropdown.
Check the option Create as Public Dimension if you want to share the dimension between models.
Enable Data Access Control: Check this option if you want to apply restrictions to the data. When you check this option you will see additional columns in the dimension i.e. Read and Write columns. Using these columns you can apply the restrictions on data at the row level. Initially if you do not check this option while creating the dimension its ok because you can enable the same once the dimension is created under dimension preference settings as shown in the Figure 11 and 12.

Figure 11

Figure 12
Other settings which are available at the dimension level are :

Figure 13
Setting the Threshold: This option is used to set the Threshold or Apply conditional formatting on Accounts. This option is only available in the Account dimension. You can set the conditional formatting on Accounts at the story level or in the Model itself. The difference is, if you set the Threshold at the Model – Dimension level then it would apply the conditional formatting to the stories where the Dimension or Model is used else it will be specific to story.
Add columns and Rows : You can add additional columns and Rows to the dimension
Copy Rows icon : Select a row and use the Copy Row icon and paste it.
Delete Rows and Columns : Gives us the option to delete the Rows in the Account dimension
Next step is to add the Master data to the Account dimension. As you can see from the Figure 15, Account dimension has many columns. You can either type the members directly in the grid or you can prepare the master data in the Excel in the same format as Account dimension and simply copy and paste the members in the dimension grid.
If there are any errors then those will be highlighted in light pink color. For e.g. in the Figure 14 you can see the Unit and Currency cells show as % but the Aggregation type is set to SUM which is wrong so it highlighted cells in light pink color. Clear the data cell and type the correct Aggregation type. Here we are leaving it as empty.

Figure 14

Figure 15
On the Right side panel you can see the details of the selected Account member and the complete Hierarchy structure. This helps to make sure that the hierarchy between the members are correct.
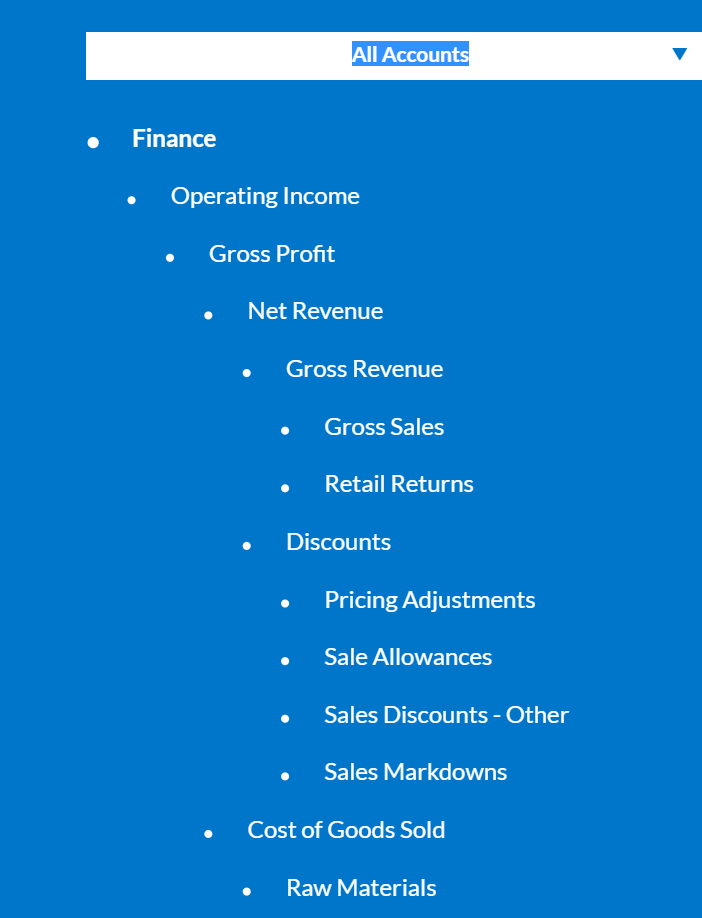
Figure 16
Select one Account member to see more details about the Account

Figure 17
Creating the dimensions workflow is more or less the same for all the dimensions but we will just try to create one more required dimensions briefly within the Planning Model.
Organizational dimension : For the Analytical Model this dimension is optional but for the Planning Model this is one of the required dimension. This dimension defines the organizational structure and helps in the analysis of the Account data. For e.g. take the Cost Center of a company, person responsible for CC and if the company is located worldwide then what currency is it using. Figure 20 shows the columns or the organizational dimension attributes and dimension members. By default the Hierarchy column is not created, you need to add the Hierarchy column from the dimension settings and then add members to the Hierarchy column (Figure 19). Add the master data to the dimension grid by typing or by using the copy and paste options.

Figure 18

Figure 19
You can type the dimension members directly in the cells or copy and paste the members

Figure 20
Generic Dimensions: A model can have multiple Generic Dimensions. The workflow to create the dimension is same as any other dimension. While creating the dimension make sure to select the type as “Generic”. Create the dimension and add the master data by adding the Master data from excel file or simply by typing the members in the dimension grid cells.

Figure 21

Figure 22
Once all the dimensions are created, click on Save icon to create the Model. We have successfully created a Planning model from scratch with Account, Time, Categories, Organizational and Generic dimensions in it.

Figure 23
Loading the Transaction Data into Model:
Once the Model is created with Master data, the next step is to Import the transaction data from the file. To do this , in the Modeling screen, select the Model you just created and next select the -> ] icon to see the option Import Data from File.

Figure 24
Select the data source file from your local machine and the sample data is loaded initially. All the data preparations and transformations done on the sample data will be applied to the entire dataset.

Figure 25

Figure 26
You can load the data into the existing model or new model. The data integration window shows the initial mappings of dimensions. If the mappings are not correct or needs to be changed then select the column and from the right-side Details panel – Quality issues panel you will have the option to do the mappings.
Select the Column under Mapping and select the correct column from Map To option
Dimensions have the option to add ID and Description attributes.
If you have the Geo dimensions info like Longitude and Latitude info or the region information (US only) then you can create the location dimensions / geo dimension.
Refer to the Blog to know more about the Data Integration window and Transformations :
https://blogs.sap.com/2017/12/22/create-analytical-model-using-excel-file-and-schedule-data-refresh-...

Figure 27
Once the dimensions are properly mapped, next work on the data transformation. You can select the data cell and create a transformations like split, replace or delete columns, Delete rows, convert to upper case or lower case so on.
Here we will try to use a sample transformation function on the Product dimension data.
There are lot of # in the Product dimension Data cells , so we will try to replace # with
PRD0006. To do this, click on the # data cell and you will see two icons: Triangle with overlapping square which is the transformation icon and Three Dots.
Click on the transformation icon and you can create a new function using the suggested options like : Concatenate, Split, Replace and Change or you can use the suggested smart transformations. We will try to use the suggested smart transformations i.e. “Replace # with PRD0006 as shown in the Figure 29.

Figure 28

Figure 29

Figure 30
Next go to the Model details pane which is the cube icon and in the same window under the Mapping Options click on View all options
Since this is the Planning model, so you have to change the Mapping Options. Under Mapping options choose the Convert value symbol by account type (Figure 32). Selecting this option shows how accounting data is handled in this import. Special data types for accounting data are available. These automatically apply negative signs to values in the database as necessary, although the data shown on screen is shown as a positive value (this applies to the types INC and LEQ). When this option is selected, the value symbol is matched to the account type. For example, expenses are negative values and revenues are positive values.

Figure 31

Figure 32

Figure 33
After all columns are mapped and transformations are applied to the data , validate the data for any data quality issues as shown in the Figure 34. Since there are no more data quality issues, we can go ahead and import the data into the Model.
One more important thing to remember is version mapping. Since this is a Planning Model so we will have different versions of data i.e. Actual Data or Forecast Data or Planning Data or Budget Data so on. Here we are loading Actual Data so under the Category option, select Actual from the left dropdown box and Version name Actual on right side. If you select a different version from Category dropdown box i.e. for e.g. Forecast , then on the right side type the Version name as Category so data will be loaded correctly into the right version. Check Figure 34.
In the Model details pane (Cube icon) you can select the type of Import Method option.
Update: Updates the Model with Data values.
Clean and Replace selected version data : Deletes the existing data and the new data is loaded into the model
Append : Just adds the values into the model. Even the duplicate records are added into the model.
We can select the Update option and click on Finish Mapping button. Data will be loaded into the created Model. It will also show number of records loaded and if there are any rejected records. You can open the rejected records and do further analysis as why records are rejected.

Figure 34

Figure 35
We have successfully created Account Dimension, Organizational Dimension, Generic Dimension, used generated Time and Category Dimensions. Loaded Master data and created a Planning Model. After Model is created we have imported the Transaction Data into the Model.
Refer to the following links to learn more about SAP Analytics Cloud:
https://help.sap.com/viewer/p/SAP_BusinessObjects_Cloud
Creating a Planning Model from scratch in SAC
SAP® Analytics Cloud is a next-generation software-as-a-service (SaaS) solution for Analytics, Planning and Predictive features. It is built on SAP HANA® Cloud Platform. SAC can connect to different types of on-prem and cloud based data sources. Within SAC we have 2 types of connections i.e. the Acquisition type of connection where data is downloaded into the SAC and Live connection where data is real time.
After the SAC tenant has been setup, next step is to create the connection between SAC and Data Source. Once the connection is established between SAC and Data source, the third step is to create models on top of Data sources. Once the Model is created, user can start creating Analytics or Planning or use Predictive features to generate some predictive analytics using the model.
In SAC we have 2 types of Models. The Analytical Model and Planning Model. A Model consists of Dimensions and Measures.
Analytical Model : It consists of Account dimension which is the required dimension and can have ‘n’ number of generic dimensions.
Planning Model: It consists of Time, Category, Account and Organizational dimensions which are the required dimensions. Like Analytical Model it can have ‘n’ number of generic dimensions.
As mentioned before we will create the Planning Model in this blog. Below are the step by step instructions on how to create the Planning Model in the SAP Analytics Cloud (SAC).
Planning Model:
To create Model in SAC, from the Main menu , let’s go to Home – Create – Model Page option. Select the Start with a blank model option and give name to the Model. Select the Enable Planning option if you want to create the Planning Model. If this option is not selected then by default Analytical Model will be created. We will select the Enable Planning option as we want to create the Planning Model
Figure 1
Let's select the Start with blank model option as we want to create the dimensions.
Figure 2
Provide a name to the Model and check the Enable Planning option
Figure 3
You can set the preferences for models under the settings option. Select the Wrench icon and click on the arrow facing downwards to open the Preferences as shown in the Figure 4
Model Preferences:
Figure 4
Figure 5
- Set the Default currency – As the name says, you can set the default currency to be applied to the data in the Model.
- Audit – When this option is switched on or turned on , then any changes made to the model will be recorded.
- Privacy – If this setting is turned on then the models will be visible only to the owner or the creator.
- Currency conversion – If you want to display the values in different currencies then you need to define all the currencies and exchange rates in a table and reference the table under the currency conversion option. We will select the already created Currency dimension from the dropdown box as shown in the figure 6.
- Maximum Currency Conversion limit – This shows the number of different currencies which can be displayed simultaneously side by side in a table.
- Pre-converted Actuals – This option is enabled only when currency conversion option is switched on. If you want to load the pre-converted values into SAC then those values will be shown as separate measure i.e. one measure for pre-calculated data and one for the local currency data. This is only applicable for the “Actuals” data.
Figure 6
Next for the Time dimension select the lowest granularity i.e. Year or Quarter or Month and select the start and end time as shown in the Figure 7 and 8.
Figure 7
Figure 8
After selecting the Time dimension parameters, next when you scroll down you can see the Categories. Let’s define the versions frequency like Monthly for Actuals, Quarterly for Budgeting, Yearly forecasting so on depending on your Planning requirements. The Time and Categories dimensions are proposed by systems unlike other dimensions where you have to create each dimension manually.
When you click on the + icon besides the Account dimension, it gives the option to create new Account Dimension or select an existing Account dimension. If you create the Account dimension as public dimension then you can share the Account dimension between models else it will be available only to the model which you create.
Figure 9
Figure 10
Create a new Account Dimension by giving Name and Description. The Type should be Account type. The Type is automatically selected, if not make sure you select the Account from the dropdown.
Check the option Create as Public Dimension if you want to share the dimension between models.
Enable Data Access Control: Check this option if you want to apply restrictions to the data. When you check this option you will see additional columns in the dimension i.e. Read and Write columns. Using these columns you can apply the restrictions on data at the row level. Initially if you do not check this option while creating the dimension its ok because you can enable the same once the dimension is created under dimension preference settings as shown in the Figure 11 and 12.
Figure 11
Figure 12
Other settings which are available at the dimension level are :
Figure 13
Setting the Threshold: This option is used to set the Threshold or Apply conditional formatting on Accounts. This option is only available in the Account dimension. You can set the conditional formatting on Accounts at the story level or in the Model itself. The difference is, if you set the Threshold at the Model – Dimension level then it would apply the conditional formatting to the stories where the Dimension or Model is used else it will be specific to story.
Add columns and Rows : You can add additional columns and Rows to the dimension
Copy Rows icon : Select a row and use the Copy Row icon and paste it.
Delete Rows and Columns : Gives us the option to delete the Rows in the Account dimension
Next step is to add the Master data to the Account dimension. As you can see from the Figure 15, Account dimension has many columns. You can either type the members directly in the grid or you can prepare the master data in the Excel in the same format as Account dimension and simply copy and paste the members in the dimension grid.
If there are any errors then those will be highlighted in light pink color. For e.g. in the Figure 14 you can see the Unit and Currency cells show as % but the Aggregation type is set to SUM which is wrong so it highlighted cells in light pink color. Clear the data cell and type the correct Aggregation type. Here we are leaving it as empty.
Figure 14
Figure 15
On the Right side panel you can see the details of the selected Account member and the complete Hierarchy structure. This helps to make sure that the hierarchy between the members are correct.
Figure 16
Select one Account member to see more details about the Account
Figure 17
Creating the dimensions workflow is more or less the same for all the dimensions but we will just try to create one more required dimensions briefly within the Planning Model.
Organizational dimension : For the Analytical Model this dimension is optional but for the Planning Model this is one of the required dimension. This dimension defines the organizational structure and helps in the analysis of the Account data. For e.g. take the Cost Center of a company, person responsible for CC and if the company is located worldwide then what currency is it using. Figure 20 shows the columns or the organizational dimension attributes and dimension members. By default the Hierarchy column is not created, you need to add the Hierarchy column from the dimension settings and then add members to the Hierarchy column (Figure 19). Add the master data to the dimension grid by typing or by using the copy and paste options.
Figure 18
Figure 19
You can type the dimension members directly in the cells or copy and paste the members
Figure 20
Generic Dimensions: A model can have multiple Generic Dimensions. The workflow to create the dimension is same as any other dimension. While creating the dimension make sure to select the type as “Generic”. Create the dimension and add the master data by adding the Master data from excel file or simply by typing the members in the dimension grid cells.
Figure 21
Figure 22
Once all the dimensions are created, click on Save icon to create the Model. We have successfully created a Planning model from scratch with Account, Time, Categories, Organizational and Generic dimensions in it.
Figure 23
Loading the Transaction Data into Model:
Once the Model is created with Master data, the next step is to Import the transaction data from the file. To do this , in the Modeling screen, select the Model you just created and next select the -> ] icon to see the option Import Data from File.
Figure 24
Select the data source file from your local machine and the sample data is loaded initially. All the data preparations and transformations done on the sample data will be applied to the entire dataset.
Figure 25
Figure 26
You can load the data into the existing model or new model. The data integration window shows the initial mappings of dimensions. If the mappings are not correct or needs to be changed then select the column and from the right-side Details panel – Quality issues panel you will have the option to do the mappings.
Select the Column under Mapping and select the correct column from Map To option
Dimensions have the option to add ID and Description attributes.
If you have the Geo dimensions info like Longitude and Latitude info or the region information (US only) then you can create the location dimensions / geo dimension.
Refer to the Blog to know more about the Data Integration window and Transformations :
https://blogs.sap.com/2017/12/22/create-analytical-model-using-excel-file-and-schedule-data-refresh-...
Figure 27
Once the dimensions are properly mapped, next work on the data transformation. You can select the data cell and create a transformations like split, replace or delete columns, Delete rows, convert to upper case or lower case so on.
Here we will try to use a sample transformation function on the Product dimension data.
There are lot of # in the Product dimension Data cells , so we will try to replace # with
PRD0006. To do this, click on the # data cell and you will see two icons: Triangle with overlapping square which is the transformation icon and Three Dots.
Click on the transformation icon and you can create a new function using the suggested options like : Concatenate, Split, Replace and Change or you can use the suggested smart transformations. We will try to use the suggested smart transformations i.e. “Replace # with PRD0006 as shown in the Figure 29.
Figure 28
Figure 29
Figure 30
Next go to the Model details pane which is the cube icon and in the same window under the Mapping Options click on View all options
Since this is the Planning model, so you have to change the Mapping Options. Under Mapping options choose the Convert value symbol by account type (Figure 32). Selecting this option shows how accounting data is handled in this import. Special data types for accounting data are available. These automatically apply negative signs to values in the database as necessary, although the data shown on screen is shown as a positive value (this applies to the types INC and LEQ). When this option is selected, the value symbol is matched to the account type. For example, expenses are negative values and revenues are positive values.
Figure 31
Figure 32
Figure 33
After all columns are mapped and transformations are applied to the data , validate the data for any data quality issues as shown in the Figure 34. Since there are no more data quality issues, we can go ahead and import the data into the Model.
One more important thing to remember is version mapping. Since this is a Planning Model so we will have different versions of data i.e. Actual Data or Forecast Data or Planning Data or Budget Data so on. Here we are loading Actual Data so under the Category option, select Actual from the left dropdown box and Version name Actual on right side. If you select a different version from Category dropdown box i.e. for e.g. Forecast , then on the right side type the Version name as Category so data will be loaded correctly into the right version. Check Figure 34.
In the Model details pane (Cube icon) you can select the type of Import Method option.
Update: Updates the Model with Data values.
Clean and Replace selected version data : Deletes the existing data and the new data is loaded into the model
Append : Just adds the values into the model. Even the duplicate records are added into the model.
We can select the Update option and click on Finish Mapping button. Data will be loaded into the created Model. It will also show number of records loaded and if there are any rejected records. You can open the rejected records and do further analysis as why records are rejected.
Figure 34
Figure 35
We have successfully created Account Dimension, Organizational Dimension, Generic Dimension, used generated Time and Category Dimensions. Loaded Master data and created a Planning Model. After Model is created we have imported the Transaction Data into the Model.
Refer to the following links to learn more about SAP Analytics Cloud:
https://help.sap.com/viewer/p/SAP_BusinessObjects_Cloud
- SAP Managed Tags:
- SAP Analytics Cloud,
- SAP Analytics Cloud for planning
13 Comments
You must be a registered user to add a comment. If you've already registered, sign in. Otherwise, register and sign in.
Labels in this area
-
ABAP CDS Views - CDC (Change Data Capture)
2 -
AI
1 -
Analyze Workload Data
1 -
BTP
1 -
Business and IT Integration
2 -
Business application stu
1 -
Business Technology Platform
1 -
Business Trends
1,661 -
Business Trends
85 -
CAP
1 -
cf
1 -
Cloud Foundry
1 -
Confluent
1 -
Customer COE Basics and Fundamentals
1 -
Customer COE Latest and Greatest
3 -
Customer Data Browser app
1 -
Data Analysis Tool
1 -
data migration
1 -
data transfer
1 -
Datasphere
2 -
Event Information
1,400 -
Event Information
64 -
Expert
1 -
Expert Insights
178 -
Expert Insights
267 -
General
1 -
Google cloud
1 -
Google Next'24
1 -
Kafka
1 -
Life at SAP
784 -
Life at SAP
10 -
Migrate your Data App
1 -
MTA
1 -
Network Performance Analysis
1 -
NodeJS
1 -
PDF
1 -
POC
1 -
Product Updates
4,579 -
Product Updates
315 -
Replication Flow
1 -
RisewithSAP
1 -
SAP BTP
1 -
SAP BTP Cloud Foundry
1 -
SAP Cloud ALM
1 -
SAP Cloud Application Programming Model
1 -
SAP Datasphere
2 -
SAP S4HANA Cloud
1 -
SAP S4HANA Migration Cockpit
1 -
Technology Updates
6,886 -
Technology Updates
388 -
Workload Fluctuations
1
Related Content
- Learning Material for - SAC Certification ? in Technology Q&A
- SAP Analytics Cloud for planning - Comparator Issue in Advanced Formulas in Technology Q&A
- SAP Analytics Cloud Planning - Converting data in Technology Blogs by SAP
- Join and innovate with the SAP Enterprise Support Advisory Council (ESAC) Program in Technology Blogs by SAP
- SAP Analytics Cloud Planning Data Action Advance Formula in Technology Q&A
Top kudoed authors
| User | Count |
|---|---|
| 17 | |
| 13 | |
| 11 | |
| 10 | |
| 9 | |
| 9 | |
| 9 | |
| 9 | |
| 9 | |
| 8 |