
- SAP Community
- Products and Technology
- Technology
- Technology Blogs by SAP
- Create a Analytical report in 5 min
Technology Blogs by SAP
Learn how to extend and personalize SAP applications. Follow the SAP technology blog for insights into SAP BTP, ABAP, SAP Analytics Cloud, SAP HANA, and more.
Turn on suggestions
Auto-suggest helps you quickly narrow down your search results by suggesting possible matches as you type.
Showing results for
former_member27
Explorer
Options
- Subscribe to RSS Feed
- Mark as New
- Mark as Read
- Bookmark
- Subscribe
- Printer Friendly Page
- Report Inappropriate Content
12-27-2017
9:06 AM
Hello everyone.
A picture speaks more than 1000 words. Similarly, an analytical report is much more understandable than an endlessly scrolling list report. You can get the right insights, without mining through the complete data set.
It saves all the pain of exporting the data to a Analytical tool like SAC for visualization purposes.

Purpose:
In this blog, I would like to share my experience of creating a simple analytical report. Believe me or not, it took more time to write this blog than to develop my first analytical report.
For the experienced users, who understand the lingo, follow the video tutorial and try it yourself.
Prerequisites
- REST service of SAP HANA views by SAP HANA Extended Application Services (SAP HANA XS). Follow this link for creating one.
https://blogs.sap.com/2013/01/22/rest-your-models-on-sap-hana-xs/
- OData url should be configured in your SAP Cloud account destination, So that you can use it, in your application.
https://www.sap.com/india/developer/tutorials/hcp-create-destination.html
Steps
- Backend
Create an xsodata service in SAP HANA XS application(link provided in prerequisites 1). I already have created the odata service exposing the details about the vehicles, like their trips and fuel consumed. After creating it successfully, you should get the metadata like this.

Please make sure you have the sap:aggregation-role attribute in your odata properties, Otherwise your chart will not display the data properly. That attribute can have only 2 types of value dimension or measure.
Dimension would come if you have mentioned that particular column as type Attribute in your calculation view and Measure would come if you have mentioned that particular column as type Measure in your calculation view.
- Frontend
Once we are done with the backend, creating a front end is our next task. As I said earlier we will use Analytical list report template for this purpose. It comes with features like sorting, filtering and much more.
Here we configure the view using one file called annotation.xml. Here we will not use any UI5 xml views we are familiar with. Rather this annotation.xml file will be used to manipulate the UI of the application.
For more details for annotation based UI refer to these blogs –
- https://blogs.sap.com/2016/11/27/fiori-elements-how-to-develop-a-list-report-using-local-annotations
1. Creating a template project. Follow this tutorial.
https://www.youtube.com/watch?v=crfnx3pw23E
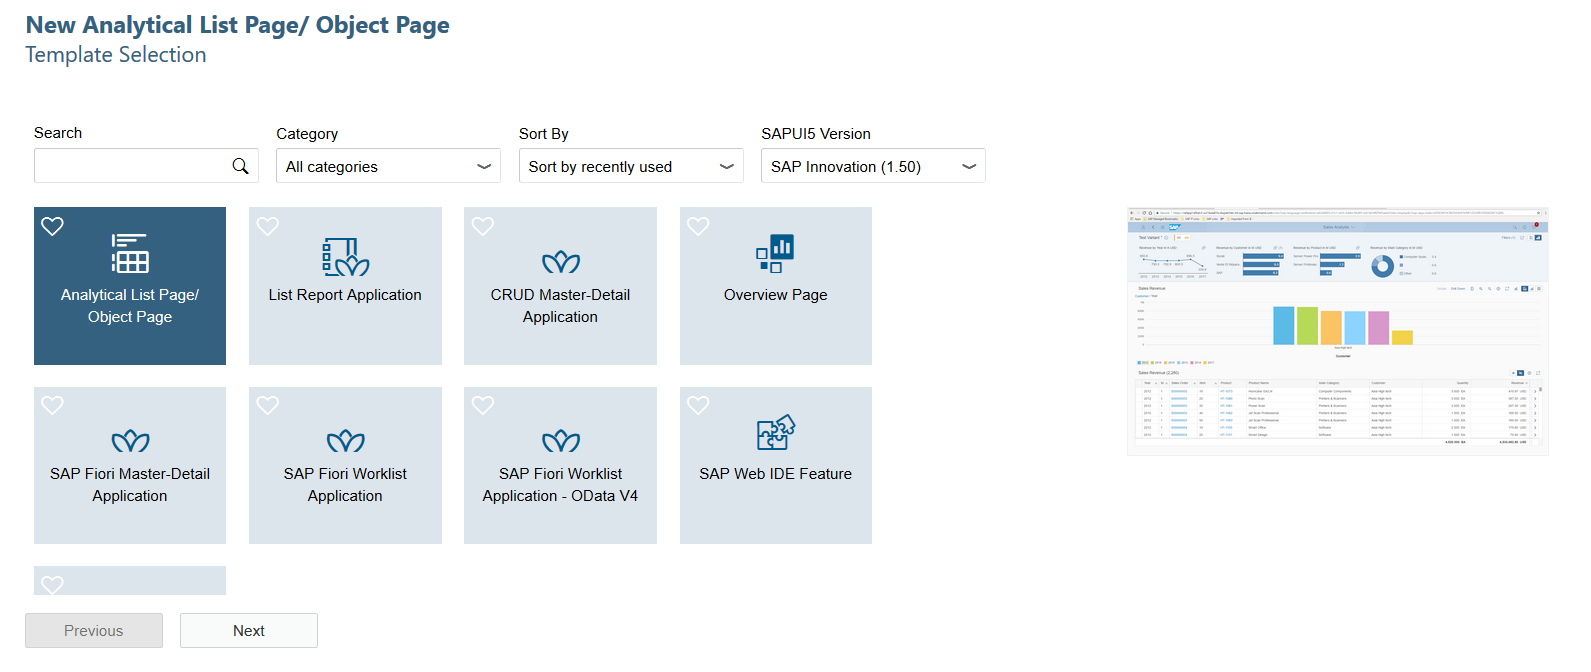
In template selection part select Analytical List Page / Object Page. And press next. Rest of the process will be same.
2. After creating the project, create the annotation.xml file inside the annotations folder under your webapp folder.
Right Click > New > Annotation File > Give a proper name > next and then click on finish.
Now if you run the application in this state, you should get an error popup like this.

Since you have not selected any column to view, this error is coming. You can either select the columns from the frontend by clicking on the setting button on top of the table and ticking the column names you want to see and then press ok. But for the obvious reason, this is not the ideal way of doing it. It is very annoying to select the column every time you render the page. To fix this issue we have an annotation term called UI.LineItem which is responsible for displaying the columns (Only those columns you have mentioned inside this annotation) as soon as you application is rendered in the browser. This part is very well explained in the link provided previously (https://blogs.sap.com/2016/11/27/fiori-elements-how-to-develop-a-list-report-using-local-annotations...)
3. Now we will focus on the most exciting part of this blog. Creating and configuring one chart view in this app.
- Click on the add button on Local Annotations row.
- Select Chart, and press OK.
- Under the UI.Chart Annotation, you can see the following properties
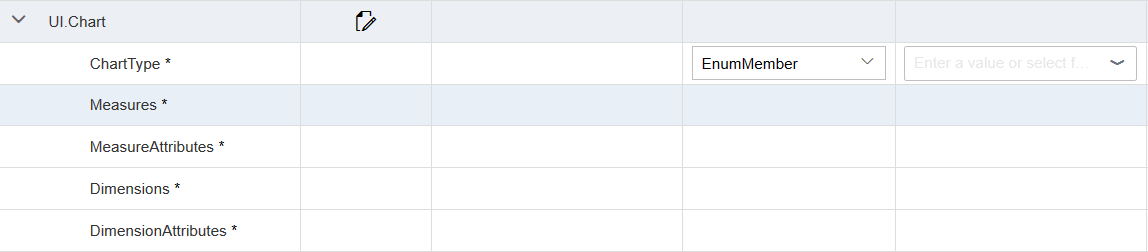
Each of the property have their own role to be played.
ChartType Represent the type of the chart; Column Chart, Bar Chart, Heat Map and there are many other options. For the simplicity of our chart we are selecting Column for Chart Type.
Measures- It is used for mentioning the OData properties, meaning the column names of database table or view, using which you want to draw the chart, meaning the data coming along Y axis of the chart. For example, if I want to see the kilometers travelled by each vehicle, I would select the column kilometer travelled as measure and vehicle ID as dimensions (Will be discussed later).
Click on the add button on the measures row, under UI.Chart annotation > Select Item > OK > I am selecting KMTravelled as PropertyPath (Please do it, as per your business scenario)

Measure Attributes – Now we need something called Measure Attributes, which specifies how we want to use the measures defined previously. Detail description of the properties of Measure Attributes is out of the scope of this blog. For simplicity we will learn by keeping it as simple as possible.
To add measure attributes click on the add button on measure attributes row > Select ChartMeasureAttributeType under records > OK > Again click on the add button on chart measure attribute type row > select measure and role > OK > In measure part select the property which you have select previously as measure (KMTravelled in my case ) and Select Axis 1 as Role
Dimensions – Let’s have a look at the Dimensions attribute. In my case it will be VehicleID, which comes along X axis. It is the attribute, based on which the data are distributed.
Click on the add button in the dimensions row > select Item > OK > Now select VehicleID as Propertypath
DimensionAttributes-
Same as Measure attributes, Dimension Attributes also specify how we want to use the Dimensions defined in previous section
Click add on DimensionAttributes > select Chart Dimension Attribute Type > OK > click on add on ChartDimensionAttributeType > select Dimension and Role > OK > Select VehicleID as dimension and Category as Role.
Now save the application in WebIDE and run the app.
My chart looks like this. Your chart will differ based on the attributes you have selected.

Hope this blog helped you. Please feel free to give any sort of feedback and comment. Happy Learning.
- SAP Managed Tags:
- SAPUI5
10 Comments
You must be a registered user to add a comment. If you've already registered, sign in. Otherwise, register and sign in.
Labels in this area
-
ABAP CDS Views - CDC (Change Data Capture)
2 -
AI
1 -
Analyze Workload Data
1 -
BTP
1 -
Business and IT Integration
2 -
Business application stu
1 -
Business Technology Platform
1 -
Business Trends
1,661 -
Business Trends
91 -
CAP
1 -
cf
1 -
Cloud Foundry
1 -
Confluent
1 -
Customer COE Basics and Fundamentals
1 -
Customer COE Latest and Greatest
3 -
Customer Data Browser app
1 -
Data Analysis Tool
1 -
data migration
1 -
data transfer
1 -
Datasphere
2 -
Event Information
1,400 -
Event Information
66 -
Expert
1 -
Expert Insights
178 -
Expert Insights
293 -
General
1 -
Google cloud
1 -
Google Next'24
1 -
Kafka
1 -
Life at SAP
784 -
Life at SAP
12 -
Migrate your Data App
1 -
MTA
1 -
Network Performance Analysis
1 -
NodeJS
1 -
PDF
1 -
POC
1 -
Product Updates
4,577 -
Product Updates
336 -
Replication Flow
1 -
RisewithSAP
1 -
SAP BTP
1 -
SAP BTP Cloud Foundry
1 -
SAP Cloud ALM
1 -
SAP Cloud Application Programming Model
1 -
SAP Datasphere
2 -
SAP S4HANA Cloud
1 -
SAP S4HANA Migration Cockpit
1 -
Technology Updates
6,886 -
Technology Updates
415 -
Workload Fluctuations
1
Related Content
- SAP Analytics Cloud Excel Add In - Multiple Tables in Technology Q&A
- Improvising Time Management in SAP S/4HANA Cloud: A Co-Innovation Solution in Technology Blogs by SAP
- SAP HANA Cloud's Vector Engine vs. HANA on-premise in Technology Blogs by Members
- Streamlining Time Sheet Approvals in SuccessFactors: Time Sheet Approval Center in Technology Blogs by Members
- 10+ ways to reshape your SAP landscape with SAP BTP - Blog 4 Interview in Technology Blogs by SAP
Top kudoed authors
| User | Count |
|---|---|
| 29 | |
| 21 | |
| 10 | |
| 7 | |
| 7 | |
| 6 | |
| 6 | |
| 5 | |
| 5 | |
| 5 |