
- SAP Community
- Products and Technology
- Technology
- Technology Blogs by SAP
- Dynamic Apps in Lumira 2.1 – Iterating Over a Resu...
Technology Blogs by SAP
Learn how to extend and personalize SAP applications. Follow the SAP technology blog for insights into SAP BTP, ABAP, SAP Analytics Cloud, SAP HANA, and more.
Turn on suggestions
Auto-suggest helps you quickly narrow down your search results by suggesting possible matches as you type.
Showing results for
reiner_hille-do
Active Contributor
Options
- Subscribe to RSS Feed
- Mark as New
- Mark as Read
- Bookmark
- Subscribe
- Printer Friendly Page
- Report Inappropriate Content
12-19-2017
1:30 PM
In the first part of my little blog series on dynamic Lumira apps, I have shortly explained the Components API that allows to create components dynamically. However, this doesn’t help a lot if you don’t have a way to create components based on your analytical data.
Therefore, we have also implemented a new feature to iterate over a resultset. But what is a resultset and what does “iterate” mean?
A resultset is more or less what you see in a crosstab:
It consists of four quadrants:
Note that Measures are members of the “Measures” dimension – but the Measures dimension usually does not show a label in quadrant 1.
Summary: quadrant 1 contains dimension names. In quadrant 2 and 3 you find members that usually form a tree. The combination of all members on a axis is called axis tuple. And finally: at the crossing point of a row and a column axis tuple you find a data cell in quadrant 4.
You could combine the two tuples from rows and column to a big tuple with the same effect: select a single data cell. Such a "big tuple" selection also survive some changes, e.g. if a dimension is moved from rows to columns or if axes are swapped.
Such a "single tuple" approach is used in Lumira to select data cells. If you have created Lumira or Design Studio apps before, you will probably know the APIs getDataAsString and getData, which return a data cell (quadrant 4). You pass in a single tuple in a JavaScript JSON notation (key-value pairs in angle brackets).
Here is an example:
If we apply the color coding from above, the script looks as follows:
var cell =
DS_1.getData("", {"gender":"F","(MEASURES_DIMENSION)":"store_cost","marital_status":"M","store_city":"9606 Julpum Loop"});

Inside of the forEach loop you will receive a data selection JSON for each row of the Store Sales column - or to be more precise - for each member of the "store_city" dimension. The measure member is repeated in each selection:
If you replace "*" with "?", the totals member is skipped an thus the line of the table above would not exist.
The selection JSONs in the sample above contain internal keys for all members. In my data source they are quite understandable, but for most other data sources such a key it not what a human reader would understand. Lumira runtime has the concept of "presentations" for each member, e.g. internalKey, externalKey and texts with different length. Moreover each member could contain several display attribute members.
To access those member-specific information we have another new script API getMember. To getMember you pass a data selection and the ID of a dimension. As a result you receive a nice "Member" object that gives you access to all presentations and display attributes. Let's extend the sample with some dimension labels:
For JavaScript exerts: The effect of getMember is similar to selection.<dimId> or selection["<memberId>"], and taking the returned internal key as lookup for member details object.
I will write more about getMember and the older getMembers in another blog.
The full power of dynamic apps you achieve if you combine resultset iteration with Components-API: you iterate over the result set and create components for each data selection. We call this concept the "repeater pattern", because you repeat some components for each selection from the resultset. Typically you would not iterate over all cells of the resutset. As I already mentioned, you can select bigger blocks - and create one or more component for each block.
The next sample uses the same HANA view as before but has the "customer_id" dimension on the rows axis. We iterate over this dimension and thus get one data selection per row in the form {"customer_id":"188"} etc. From this selection we get a member and some "birthday" attribute. We also do some simple math to calculate a trend icon. The result is a table without using a table component - simply from Text and Icon components.
Here is how it looks:

If you iterate over block containing many resultset cells, it makes sense to create a chart for each block. The result is a kind of hand-made trellis chart. Key for this feature is the setDattaSelection API that our chart component has. Also many other builtin and SDK component have such and API.
For a sample let's go back to the very first resultset, having gender and measures on columns and marital status and store city on rows.
For the following simple script we can create one chart per marital status:
The result shows two charts, one with all data for married customers, and one for singles:
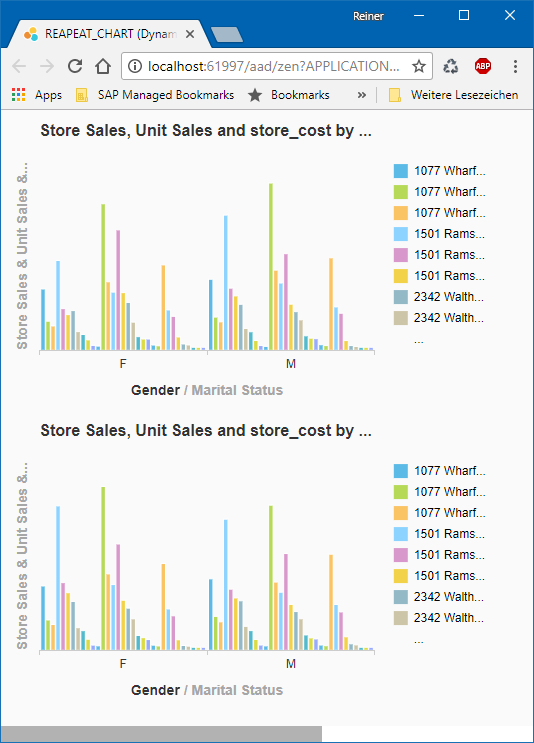
But we can also iterate over multiple dimensions together. If we iterate over both, marital status and store city, we create one data selection per row of our resultset. This is a genera rule of thumb: If you want to iterate over all rows, iterate over all dimensions that you currently have on you rows axis.
This time we also include subtotals and overall totals and configure the chart to accept also totals.
The result is a long page with many charts - one per line of the resultset. But each chart only shows the distribution of sales and costs for a single store city. Here is the start of the screen:

If you iterate over multiple dimensions, the data selections are returned in "English reading order", first left-to-right and then top-to-bottom. If there are duplicates (two data selections are identical), they are removed automatically.
If you need some special behavior, you can also nest iterations. The following script does almost the same as the one before, but is much harder to understand 😞 .
And I did lie a bit so far about data selections: as you could have multiple members selected for a dimension, the data selection JSON contains the members wrapped in arrays. During iteration you typically have exactly one member in a data selection, but if you loop over the content you will see the difference. Here is a not 100% correct script to convert a selection to a string and show it in a dialog. Maybe in a future release we could provide such a JSON.stringify as a builtin feature.
I have only touched the possibilities that you get with the new feature. Some are shown in the excellent Dashboard Sample that my collegue Christina Mast have created and which comes as a template in Lumira Designer 2.1. E.g. you can combine the repeater pattern with the Adaptive Layout container. You find this in the app "SAP_DEMO_CITY_ANALSIS". This app also uses COMPONENT.copyProperties to apply several properties from a "template" chart to the newly created chart.
Or you could create a composite and repeat instances of it. A sample can be found in "SAP_DEMO_CITY_ANALSIS_ADVANCED". That app needs some preparation, because the component type of the repeated composite depends on the document name/cuid. Instructions are shown when you open the app in Designer.
Again I'm looking forward for your comments, questions, or suggestions.
I plan a few more blogs, maybe you have some ideas or requests.
Therefore, we have also implemented a new feature to iterate over a resultset. But what is a resultset and what does “iterate” mean?
Resultsets
A resultset is more or less what you see in a crosstab:
It consists of four quadrants:
| Number | Name | Contains |
| 1 | Dimension Header | Dimension names |
| 2 | Column Header | Combination of Members (“Tuples”) from Columns axis |
| 3 | Row Header | Combination of Members (“Tuples”) from Rows axis |
| 4 | Data | Data Cells |
Note that Measures are members of the “Measures” dimension – but the Measures dimension usually does not show a label in quadrant 1.
Summary: quadrant 1 contains dimension names. In quadrant 2 and 3 you find members that usually form a tree. The combination of all members on a axis is called axis tuple. And finally: at the crossing point of a row and a column axis tuple you find a data cell in quadrant 4.
You could combine the two tuples from rows and column to a big tuple with the same effect: select a single data cell. Such a "big tuple" selection also survive some changes, e.g. if a dimension is moved from rows to columns or if axes are swapped.
Data Selections
Such a "single tuple" approach is used in Lumira to select data cells. If you have created Lumira or Design Studio apps before, you will probably know the APIs getDataAsString and getData, which return a data cell (quadrant 4). You pass in a single tuple in a JavaScript JSON notation (key-value pairs in angle brackets).
Here is an example:
var cell = DS_1.getData("", {"gender":"F","(MEASURES_DIMENSION)":"store_cost","marital_status":"M","store_city":"9606 Julpum Loop"});

var formattedValue = cell.formattedValue;
The JSON expression is called a "data selection", because it selects some data from quadrant 4 using a selection criteria using dimensions (quadrant 1) and their members (from quadrant 2 and 3).
If we apply the color coding from above, the script looks as follows:
var cell =
DS_1.getData("", {"gender":"F","(MEASURES_DIMENSION)":"store_cost","marital_status":"M","store_city":"9606 Julpum Loop"});
Note: You might have passed the measure id as first parameter. But since quite a while you can keep this parameter empty and pass the measure in the data selection.
Data selections will not always select a single cell: if you omit some dimension/member combinations, you would select a whole block even some checker board like pattern of data cells. If you are interested, you find some samples in our SDK guide.
Iterating
Iterating means to loop over. Iterating over a resultset means that you are interested in the tuples on the axes and in the data of the data cells. As Design Studio didn't provide anything out of the box, mike.howles4 from the community created an Data Iterator SDK component. This component is quite popular; we even find it in customer apps asking for SAP support.
There are several ways how you could iterate over a result set, e.g. row by row, column by column or both. Mike's solution iterates over rows and allows to extract data from quadrant 3 using the getDimensionValueKey function. Data from quadrant 4 could be retrieved using getMeasureValue. Of course there are much more functions and features in Mike's solution.
The solution in Lumira 2.1 however is not based on rows or columns. It iterates over members. And it consists of the single API getDataSelections. Like getData, getDataSelections receives a data selection as input. However for at least one of the dimensions, you don't specify a specify member ID, but the placeholder "*" or "?". The return value of getDataSelections is an array of data selections, replacing the "*"/"?" with all members found in the resultset.
Simple Resulset
Let's first start with a simple resultset - much simpler than the sample above:
The column axis only contains two measures and the row axis a single dimension "Store City".
Now we can simply iterate over the first column of the resultset and e.g. fill a Text Area component:
var selections = DS_1.getDataSelections({

	"store_city": "*",

	"(MEASURES_DIMENSION)":"store_sales"

});


selections.forEach(function(selection, index) {

	var cell = DS_1.getData("", selection);

	TEXTAREA_1.setValue(TEXTAREA_1.getValue() + cell.formattedValue + "\n");

});
Inside of the forEach loop you will receive a data selection JSON for each row of the Store Sales column - or to be more precise - for each member of the "store_city" dimension. The measure member is repeated in each selection:
| index | selection | cell value |
| 0 | {"(MEASURES_DIMENSION)":"store_sales", "store_city":"1077 Wharf Drive"} | 28,328.56 |
| 1 | {"(MEASURES_DIMENSION)":"store_sales", "store_city":"1501 Ramsey Circle"} | 52,896.30 |
| ... | ||
| 10 | {"(MEASURES_DIMENSION)":"store_sales", "store_city":"9606 Julpum Loop"} | 566.50 |
| 11 | {"(MEASURES_DIMENSION)":"store_sales", "store_city":"(RESULT_MEMBER)"} | 276,540.40 |
If you replace "*" with "?", the totals member is skipped an thus the line of the table above would not exist.
Adding Member Information
The selection JSONs in the sample above contain internal keys for all members. In my data source they are quite understandable, but for most other data sources such a key it not what a human reader would understand. Lumira runtime has the concept of "presentations" for each member, e.g. internalKey, externalKey and texts with different length. Moreover each member could contain several display attribute members.
To access those member-specific information we have another new script API getMember. To getMember you pass a data selection and the ID of a dimension. As a result you receive a nice "Member" object that gives you access to all presentations and display attributes. Let's extend the sample with some dimension labels:
var selections = DS_1.getDataSelections({

	"store_city": "?",

	"(MEASURES_DIMENSION)":"store_sales"

});


selections.forEach(function(selection, index) {

	var cell = DS_1.getData("", selection);

	var member = DS_1.getMember("store_city", selection);

	TEXTAREA_1.setValue(TEXTAREA_1.getValue() + member.text + ":\t" +  cell.formattedValue + "\n");

});
For JavaScript exerts: The effect of getMember is similar to selection.<dimId> or selection["<memberId>"], and taking the returned internal key as lookup for member details object.
I will write more about getMember and the older getMembers in another blog.
Repeater Pattern
The full power of dynamic apps you achieve if you combine resultset iteration with Components-API: you iterate over the result set and create components for each data selection. We call this concept the "repeater pattern", because you repeat some components for each selection from the resultset. Typically you would not iterate over all cells of the resutset. As I already mentioned, you can select bigger blocks - and create one or more component for each block.
The next sample uses the same HANA view as before but has the "customer_id" dimension on the rows axis. We iterate over this dimension and thus get one data selection per row in the form {"customer_id":"188"} etc. From this selection we get a member and some "birthday" attribute. We also do some simple math to calculate a trend icon. The result is a table without using a table component - simply from Text and Icon components.
var s = DS_1.getDataSelections({

	"customer_id": "?"

});


s.forEach(function(sel, index) {

    var pos = index * 25 + 40;

	var m = DS_1.getMember("customer_id", sel);

	var tText = COMPONENTS.createComponent(ComponentType.Text);

	tText.setText(m.text);

	tText.setWidth(150);

	tText.setTopMargin(pos);

	tText.setLeftMargin(10);


	var tBirthdate = COMPONENTS.createComponent(ComponentType.Text);

	var birthdayString = m.getAttributeMember("birthdate").text;

	tBirthdate.setText(birthdayString.substring(0, birthdayString.length - 9));

	tBirthdate.setTopMargin(pos);

	tBirthdate.setLeftMargin(150);

	tBirthdate.setWidth(200);


	var sales = DS_1.getData("", {"(MEASURES_DIMENSION)":"store_sales","customer_id": m.internalKey});

	var cost = DS_1.getData("", {"(MEASURES_DIMENSION)":"store_cost","customer_id": m.internalKey});


	var icon = COMPONENTS.createComponent(ComponentType.com_sap_ip_bi_Icon);

	icon.setTopMargin(pos);

	icon.setWidth(20);

	icon.setHeight(20);

	icon.setLeftMargin(300);

	if (sales.value / cost.value > 2.5) {

	  icon.setIconUri("sap-icon://trend-up");

	  icon.setBackgroundColor("green");

	} else {

	  icon.setIconUri("sap-icon://trend-down");

  	  icon.setBackgroundColor("red");

	}


	var tSales = COMPONENTS.createComponent(ComponentType.Text);

	tSales.setText(sales.formattedValue);

	tSales.setTopMargin(pos);

	tSales.setLeftMargin(400);

	tSales.setWidth(50);

	tSales.setCSSClass("bold right");

});
Here is how it looks:
Repeating Charts
If you iterate over block containing many resultset cells, it makes sense to create a chart for each block. The result is a kind of hand-made trellis chart. Key for this feature is the setDattaSelection API that our chart component has. Also many other builtin and SDK component have such and API.
For a sample let's go back to the very first resultset, having gender and measures on columns and marital status and store city on rows.
For the following simple script we can create one chart per marital status:
var selections = DS_1.getDataSelections({

	  "marital_status":"?"

});


selections.forEach(function(selection, index) {

  var chart = COMPONENTS.createComponent(ComponentType.com_sap_ip_bi_VizFrame);

  chart.setDataSource(DS_1);

  chart.setDataSelection(selection);

  chart.setTopMargin(index * 300);

});
The result shows two charts, one with all data for married customers, and one for singles:
But we can also iterate over multiple dimensions together. If we iterate over both, marital status and store city, we create one data selection per row of our resultset. This is a genera rule of thumb: If you want to iterate over all rows, iterate over all dimensions that you currently have on you rows axis.
var selections = DS_1.getDataSelections({

	  "marital_status":"*",

	  "store_city": "*"

});


selections.forEach(function(selection, index) {

  var chart = COMPONENTS.createComponent(ComponentType.com_sap_ip_bi_VizFrame);

  chart.setDataSource(DS_1);

  chart.setDataSelection(selection);

  chart.setTopMargin(index * 300);

  chart.showTotals(true);

});
This time we also include subtotals and overall totals and configure the chart to accept also totals.
The result is a long page with many charts - one per line of the resultset. But each chart only shows the distribution of sales and costs for a single store city. Here is the start of the screen:
Some Expert Facts
If you iterate over multiple dimensions, the data selections are returned in "English reading order", first left-to-right and then top-to-bottom. If there are duplicates (two data selections are identical), they are removed automatically.
If you need some special behavior, you can also nest iterations. The following script does almost the same as the one before, but is much harder to understand 😞 .
var selections = DS_1.getDataSelections({

	  "marital_status":"*"

});

// outer: iterate over marital status

selections.forEach(function(selection, index) {

   var selectionsInner = DS_1.getDataSelections({

   	"marital_status": selection["marital_status"],

   	"store_city": "*"

   });

   // inner: iterate over store city

   selectionsInner.forEach(function(selectionInner, indexInner) {

    	var chart = COMPONENTS.createComponent(ComponentType.com_sap_ip_bi_VizFrame);

        chart.setDataSource(DS_1);

        chart.setDataSelection(selectionInner);

        chart.setTopMargin(index * indexInner * 300);

        chart.showTotals(true);

   });

});
And I did lie a bit so far about data selections: as you could have multiple members selected for a dimension, the data selection JSON contains the members wrapped in arrays. During iteration you typically have exactly one member in a data selection, but if you loop over the content you will see the difference. Here is a not 100% correct script to convert a selection to a string and show it in a dialog. Maybe in a future release we could provide such a JSON.stringify as a builtin feature.
var selections = DS_1.getDataSelections({

	  "marital_status": ["M", "S"],

	  "store_city": "*"

});

selections.forEach(function(selection) {

	var s = "{";

	selection.forEach(function(members, dim) {

		s = s + dim + ": [";

		members.forEach(function(member) {

			s = s + member + ",";

		});

		s = s + "],";

	});

	s = s + "}";

	APPLICATION.alert(s);

});
Conclusion
I have only touched the possibilities that you get with the new feature. Some are shown in the excellent Dashboard Sample that my collegue Christina Mast have created and which comes as a template in Lumira Designer 2.1. E.g. you can combine the repeater pattern with the Adaptive Layout container. You find this in the app "SAP_DEMO_CITY_ANALSIS". This app also uses COMPONENT.copyProperties to apply several properties from a "template" chart to the newly created chart.
Or you could create a composite and repeat instances of it. A sample can be found in "SAP_DEMO_CITY_ANALSIS_ADVANCED". That app needs some preparation, because the component type of the repeated composite depends on the document name/cuid. Instructions are shown when you open the app in Designer.
Again I'm looking forward for your comments, questions, or suggestions.
I plan a few more blogs, maybe you have some ideas or requests.
- SAP Managed Tags:
- SAP BusinessObjects Design Studio,
- SAP Lumira
24 Comments
You must be a registered user to add a comment. If you've already registered, sign in. Otherwise, register and sign in.
Labels in this area
-
ABAP CDS Views - CDC (Change Data Capture)
2 -
AI
1 -
Analyze Workload Data
1 -
BTP
1 -
Business and IT Integration
2 -
Business application stu
1 -
Business Technology Platform
1 -
Business Trends
1,658 -
Business Trends
93 -
CAP
1 -
cf
1 -
Cloud Foundry
1 -
Confluent
1 -
Customer COE Basics and Fundamentals
1 -
Customer COE Latest and Greatest
3 -
Customer Data Browser app
1 -
Data Analysis Tool
1 -
data migration
1 -
data transfer
1 -
Datasphere
2 -
Event Information
1,400 -
Event Information
66 -
Expert
1 -
Expert Insights
177 -
Expert Insights
299 -
General
1 -
Google cloud
1 -
Google Next'24
1 -
Kafka
1 -
Life at SAP
780 -
Life at SAP
13 -
Migrate your Data App
1 -
MTA
1 -
Network Performance Analysis
1 -
NodeJS
1 -
PDF
1 -
POC
1 -
Product Updates
4,577 -
Product Updates
344 -
Replication Flow
1 -
RisewithSAP
1 -
SAP BTP
1 -
SAP BTP Cloud Foundry
1 -
SAP Cloud ALM
1 -
SAP Cloud Application Programming Model
1 -
SAP Datasphere
2 -
SAP S4HANA Cloud
1 -
SAP S4HANA Migration Cockpit
1 -
Technology Updates
6,873 -
Technology Updates
423 -
Workload Fluctuations
1
Related Content
- JAVA Application generated CSV from HANA tables and save in a place. in Technology Blogs by Members
- Create Value Mapping using API in Technology Blogs by Members
- SAP Data Warehouse Cloud and Google Big Query with large datasets in Technology Blogs by SAP
- Lumira Data Reload on Hierarchy Drill-Down in Technology Q&A
- Building Dropdown list using Value help in CDS views with validations - ABAP Restful Application Programming Model in Technology Blogs by SAP
Top kudoed authors
| User | Count |
|---|---|
| 40 | |
| 25 | |
| 17 | |
| 14 | |
| 8 | |
| 7 | |
| 7 | |
| 7 | |
| 6 | |
| 6 |