
- SAP Community
- Products and Technology
- Technology
- Technology Blogs by SAP
- What’s New in SAP Analytics Cloud and SAP Digital ...
Technology Blogs by SAP
Learn how to extend and personalize SAP applications. Follow the SAP technology blog for insights into SAP BTP, ABAP, SAP Analytics Cloud, SAP HANA, and more.
Turn on suggestions
Auto-suggest helps you quickly narrow down your search results by suggesting possible matches as you type.
Showing results for
Product and Topic Expert
Options
- Subscribe to RSS Feed
- Mark as New
- Mark as Read
- Bookmark
- Subscribe
- Printer Friendly Page
- Report Inappropriate Content
12-12-2017
10:13 AM
This blog covers some of the latest new features and enhancements in SAP Analytics Cloud* and SAP Digital Boardroom release 2017.24. Please note that the Analytics Cloud Help documentation is updated at the same time as the upgrade to this release, so the links here may not yet reflect what is described below until after the upgrade is complete.
SAP Analytics Cloud agent version required for data acquisition with this release:
For more information, see System Requirements and Technical Prerequisites.
New SAP Analytics Cloud content
New content is now available for SAP Analytics Cloud! Content innovation 6 was just released on December 4. We added new Line of Business and industry Digital Boardrooms have been added- please check below for details and the content library.
Highlights of this release:
Learn with our latest video tutorials
Commenting usability enhancements
Collaboration is now even more user friendly with usability enhancements:
Learn more about collaborating with others
Build more complex queries with S/4HANA
We now have a new dedicated S/4HANA cloud driver for acquiring data based on the OData Web API. This allows you to access S/4HANA-specific filter operators and build more complex queries.

Learn more about building a query
You can now view the timeline of all jobs that were run for a model. You can also drill into more detail for each job, including the time it was run, the duration, and even the number of rows that were acquired (except for BPC). Additionally, all the files containing rejected rows are available for download.
Please note that files are excluded as they cannot be scheduled.

Learn more about modeler
Share access with your colleagues within the same tenant
You can now share SFSF, OData, BW, and BigQuery connections along with the credentials entered by the owner. Please note that the connection is private upon creation but the administrator can choose to share read-only access with other users.

Learn more about sharing stories with other users
Analyze data in your story directly from more sources
With this release, you can now directly import data from Google BigQuery, SAP BW, Google Drive, OData, SuccessFactors and S/4HANA within stories for analysis. You no longer need to start with a model, saving you more time. When you are done with your analysis, a public model can be published from the curated data set. This will allow you to share your findings with your colleagues.

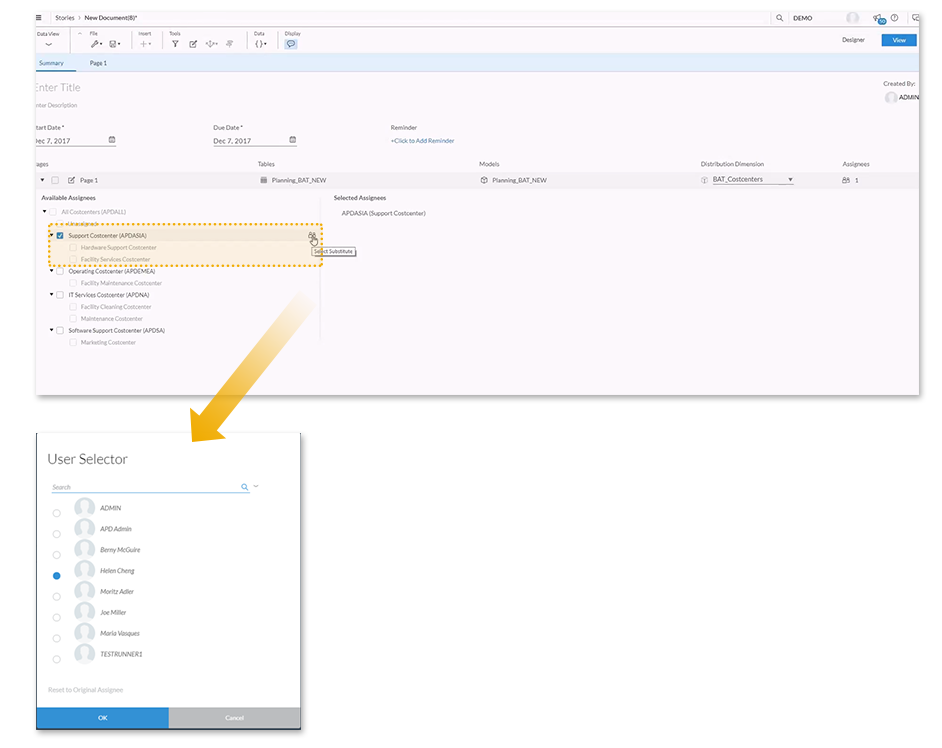
Choose a different assignee during input task
You can now choose different assignees from the distribution dimension. Previously, you would have had to do this through the model. With this new feature, assignees can be quickly and easily changed during the input task itself making the process a lot more user friendly.
Populate private versions based on filters
You can now populate your private versions based on filters, to focus on the content and optimize performance. You can choose between the current filter or apply a new filter. You can also save time by selectively copying the data and only using what is relevant to your task.

Administrators can now restore previously deleted files, stories and boardrooms. This means that you can restore old files and configure the default retention period changing it to the needs of your business.

Refresh data across multiple stories
In this new release, we made it easier for you to update your story; with one click, you can now refresh your stories.

We have updated scaling in our geo bubbles to remove outliers. Now you can organize your data with minimum and maximum values to scale the range. You can also use the reset option to return to the default scale.

Learn more about adding the Bubble Layer
Our page and story filters are now easier to use. You can now filter multiple dimensions together using “AND” or “OR”. You can also specify the number of dimension members to include or exclude within a given selection. These filters can be applied to your stories and pages.

Learn more about Story and Page Filters
Bar Position and Color per Measure
In this release, we enhanced the ways you can customize your measures. You can now assign the color and pattern per measure and place them automatically in the color feed. This means you can create IBCS charts and overlay patterns and bars using measures only.

Support for booking settings in charts
As with tables, you can now have charts that show unbooked data. Chart types that support this feature include:
You can now use dynamic text in your chart titles and subtitles. Chart filters can be inserted as dynamic text, and for your convenience, subtitles are automatically copied if the chart is copied. You can also style different parts of the title and subtitle individually to suit the needs of your presentation.

Learn more about adding Dynamic Text
Support for time calculations
You can now do time calculations without actually including time in the dimension axis, if there is a filter that selects a single time value. This allows you to use dynamic time calculations that were previously not supported before.


Learn more about Time Calculations
Our new waterfall charts can show you time-based variance if the waterfall chart is filtered on a single-time value.

Enhanced formatting for waterfall charts
In this release, the waterfall variance is automatically based on the account that is set in the model. EXP and LEQ increases are displayed in red representing a negative impact and decreases are green, representing a positive impact.

Account expansion and hierarchical dimension in waterfall chart
Simply by hovering over the tooltip, you will see an explanation of the variance created by comparing the baseline to dimension members. You can now also drill deeper into waterfall charts by account or dimension. Drilling will automatically calculate the variance between dimension bars and provide you with more granular insights on your data.

Enhanced control for variance charts
With this new release, you now have better control over the space redistribution for the base chart, ABS and % of variance. Now when you resize a chart, the container size and scaling has been enhanced so now the entire chart scales appropriately. You can also minimize the base chart to hide it and focus on what is most important.

Learn more about Variance Charts
Variance on exception aggregations
You can now create variance on exception aggregations such as average, sum, maximum, minimum and count.

Cross Calculations on Charts
In this release, you can now add cross calculations to charts. This means that any calculation that you do will be applied to all the measures in the chart, even if you have added measures through the measure input control – you can save a lot of time this way. However, please note that forecast and rolling forecast cross calculations cannot be created in charts but they can be consumed if created as a table. Currency conversion cross calculations are not yet supported at this time.

________________________________________________________________________________
Additional resources:
Previous feature summary blogs:
________________________________________________________________________________
*SAP Analytics Cloud was previously known as SAP BusinessObjects Cloud
**Legal disclaimer
SAP has no obligation to pursue any course of business outlined in this blog or any related presentation, or to develop or release any functionality mentioned therein. This blog, or any related presentation and SAP’s possible future developments, products and or platforms directions and functionality are all subject to change and may be changed by SAP at any time for any reason without notice. The information in this blog is not a commitment, promise or legal obligation to deliver any material, code, or functionality. This blog is provided without a warranty of any kind, either express or implied, including but not limited to, the implied warranties of merchantability, fitness for a particular purpose, or non-infringement. This blog is for informational purposes and may not be incorporated into a contract. SAP assumes no responsibility for errors or omissions in this document, except if such damages were caused by SAP’s willful misconduct or gross negligence.
All forward-looking statements are subject to various risks and uncertainties that could cause actual results to differ materially from expectations. Readers are cautioned not to place undue reliance on these forward-looking statements, and should not be relied upon in making purchasing decisions.
SAP Analytics Cloud agent version required for data acquisition with this release:
- Version 1.0.85 for SAP Business Warehouse (BW)
- Version 1.0.82 for SAP ERP / SQL databases
- Version 1.0.75 for all other data source types
- Note: Although it is not required, you can upgrade to the new agent version 1.0.87, no matter what data acquisition type you use. Do this to take advantage of updates made to SAP Analytics Cloud agent.
For more information, see System Requirements and Technical Prerequisites.
New SAP Analytics Cloud content
New content is now available for SAP Analytics Cloud! Content innovation 6 was just released on December 4. We added new Line of Business and industry Digital Boardrooms have been added- please check below for details and the content library.
Highlights of this release:
- Commenting usability enhancements
- Build more complex queries with S/4HANA
- Enhanced viewing options in modeler
- Share access with your colleagues within the same tenant
- Analyze data in your story directly from more sources
- Choose a different assignee during the input task
- Populate private versions based on filters
- Restore deleted files within a specified number of days
- Refresh data across multiple stories
- Scaling of geo bubble size
- Advanced page and story filters
- Bar position and color per measure
- Support for booking settings in charts
- Support for time calculations
- Waterfall variance based on time
- Enhanced formatting for waterfall charts
- Account expansion and hierarchical dimension in waterfall chart
- Enhanced control for variance charts
- Variance on exception aggregations
- Cross calculations on charts
Learn with our latest video tutorials
- Create a model from SuccessFactors Workforce Analytics
- Apply filters to a chart in a story
- Apply filters to a geo map in a story
- Full tutorial playlist >
Collaboration
Commenting usability enhancements
Collaboration is now even more user friendly with usability enhancements:
- When a story is opened, comment mode is on by default
- The data point comment indicator in a table is now a wedge at the top right of the data cell
- Widget and data-point comment indicator numbers have been replaced with a comment icon
- You can now delete the first comment in a thread without deleting the entire thread

Learn more about collaborating with others
Data Integration
Build more complex queries with S/4HANA
We now have a new dedicated S/4HANA cloud driver for acquiring data based on the OData Web API. This allows you to access S/4HANA-specific filter operators and build more complex queries.
Learn more about building a query
Enhanced viewing options in modeler
You can now view the timeline of all jobs that were run for a model. You can also drill into more detail for each job, including the time it was run, the duration, and even the number of rows that were acquired (except for BPC). Additionally, all the files containing rejected rows are available for download.
Please note that files are excluded as they cannot be scheduled.
Learn more about modeler
Share access with your colleagues within the same tenant
You can now share SFSF, OData, BW, and BigQuery connections along with the credentials entered by the owner. Please note that the connection is private upon creation but the administrator can choose to share read-only access with other users.
Learn more about sharing stories with other users
Analyze data in your story directly from more sources
With this release, you can now directly import data from Google BigQuery, SAP BW, Google Drive, OData, SuccessFactors and S/4HANA within stories for analysis. You no longer need to start with a model, saving you more time. When you are done with your analysis, a public model can be published from the curated data set. This will allow you to share your findings with your colleagues.
Planning
Choose a different assignee during input task
You can now choose different assignees from the distribution dimension. Previously, you would have had to do this through the model. With this new feature, assignees can be quickly and easily changed during the input task itself making the process a lot more user friendly.
Populate private versions based on filters
You can now populate your private versions based on filters, to focus on the content and optimize performance. You can choose between the current filter or apply a new filter. You can also save time by selectively copying the data and only using what is relevant to your task.
Infrastructure
Restore deleted files within a specified number of days
Administrators can now restore previously deleted files, stories and boardrooms. This means that you can restore old files and configure the default retention period changing it to the needs of your business.
Digital Boardroom
Refresh data across multiple stories
In this new release, we made it easier for you to update your story; with one click, you can now refresh your stories.
Data Analysis, Stories and Tables
Scaling of geo bubble sizes
We have updated scaling in our geo bubbles to remove outliers. Now you can organize your data with minimum and maximum values to scale the range. You can also use the reset option to return to the default scale.
Learn more about adding the Bubble Layer
Advanced page and story filters
Our page and story filters are now easier to use. You can now filter multiple dimensions together using “AND” or “OR”. You can also specify the number of dimension members to include or exclude within a given selection. These filters can be applied to your stories and pages.
Learn more about Story and Page Filters
Bar Position and Color per Measure
In this release, we enhanced the ways you can customize your measures. You can now assign the color and pattern per measure and place them automatically in the color feed. This means you can create IBCS charts and overlay patterns and bars using measures only.
Support for booking settings in charts
As with tables, you can now have charts that show unbooked data. Chart types that support this feature include:
- (Stacked) Bar/Column Charts
- Combination (stacked) Column/Line charts
- Line chart
- Area chart
- Numeric Point Chart

Dynamic text for charts and subtitles
You can now use dynamic text in your chart titles and subtitles. Chart filters can be inserted as dynamic text, and for your convenience, subtitles are automatically copied if the chart is copied. You can also style different parts of the title and subtitle individually to suit the needs of your presentation.
Learn more about adding Dynamic Text
Support for time calculations
You can now do time calculations without actually including time in the dimension axis, if there is a filter that selects a single time value. This allows you to use dynamic time calculations that were previously not supported before.
Learn more about Time Calculations
Waterfall variance based on time
Our new waterfall charts can show you time-based variance if the waterfall chart is filtered on a single-time value.
Enhanced formatting for waterfall charts
In this release, the waterfall variance is automatically based on the account that is set in the model. EXP and LEQ increases are displayed in red representing a negative impact and decreases are green, representing a positive impact.
Account expansion and hierarchical dimension in waterfall chart
Simply by hovering over the tooltip, you will see an explanation of the variance created by comparing the baseline to dimension members. You can now also drill deeper into waterfall charts by account or dimension. Drilling will automatically calculate the variance between dimension bars and provide you with more granular insights on your data.
Enhanced control for variance charts
With this new release, you now have better control over the space redistribution for the base chart, ABS and % of variance. Now when you resize a chart, the container size and scaling has been enhanced so now the entire chart scales appropriately. You can also minimize the base chart to hide it and focus on what is most important.
Learn more about Variance Charts
Variance on exception aggregations
You can now create variance on exception aggregations such as average, sum, maximum, minimum and count.
Cross Calculations on Charts
In this release, you can now add cross calculations to charts. This means that any calculation that you do will be applied to all the measures in the chart, even if you have added measures through the measure input control – you can save a lot of time this way. However, please note that forecast and rolling forecast cross calculations cannot be created in charts but they can be consumed if created as a table. Currency conversion cross calculations are not yet supported at this time.
________________________________________________________________________________
Additional resources:
- Video tutorials
- Guided learning
- Events and recordings
- SAP Analytics Cloud help resources
- Official roadmap contains more info on future plans, subject to change.
Previous feature summary blogs:
- SAP Analytics Cloud release 2017.23
- SAP Analytics Cloud release 2017.22
- SAP Analytics Cloud release 2017.21
- More >
________________________________________________________________________________
*SAP Analytics Cloud was previously known as SAP BusinessObjects Cloud
**Legal disclaimer
SAP has no obligation to pursue any course of business outlined in this blog or any related presentation, or to develop or release any functionality mentioned therein. This blog, or any related presentation and SAP’s possible future developments, products and or platforms directions and functionality are all subject to change and may be changed by SAP at any time for any reason without notice. The information in this blog is not a commitment, promise or legal obligation to deliver any material, code, or functionality. This blog is provided without a warranty of any kind, either express or implied, including but not limited to, the implied warranties of merchantability, fitness for a particular purpose, or non-infringement. This blog is for informational purposes and may not be incorporated into a contract. SAP assumes no responsibility for errors or omissions in this document, except if such damages were caused by SAP’s willful misconduct or gross negligence.
All forward-looking statements are subject to various risks and uncertainties that could cause actual results to differ materially from expectations. Readers are cautioned not to place undue reliance on these forward-looking statements, and should not be relied upon in making purchasing decisions.
- SAP Managed Tags:
- SAP Analytics Cloud
1 Comment
You must be a registered user to add a comment. If you've already registered, sign in. Otherwise, register and sign in.
Labels in this area
-
ABAP CDS Views - CDC (Change Data Capture)
2 -
AI
1 -
Analyze Workload Data
1 -
BTP
1 -
Business and IT Integration
2 -
Business application stu
1 -
Business Technology Platform
1 -
Business Trends
1,658 -
Business Trends
91 -
CAP
1 -
cf
1 -
Cloud Foundry
1 -
Confluent
1 -
Customer COE Basics and Fundamentals
1 -
Customer COE Latest and Greatest
3 -
Customer Data Browser app
1 -
Data Analysis Tool
1 -
data migration
1 -
data transfer
1 -
Datasphere
2 -
Event Information
1,400 -
Event Information
66 -
Expert
1 -
Expert Insights
177 -
Expert Insights
293 -
General
1 -
Google cloud
1 -
Google Next'24
1 -
Kafka
1 -
Life at SAP
780 -
Life at SAP
13 -
Migrate your Data App
1 -
MTA
1 -
Network Performance Analysis
1 -
NodeJS
1 -
PDF
1 -
POC
1 -
Product Updates
4,577 -
Product Updates
340 -
Replication Flow
1 -
RisewithSAP
1 -
SAP BTP
1 -
SAP BTP Cloud Foundry
1 -
SAP Cloud ALM
1 -
SAP Cloud Application Programming Model
1 -
SAP Datasphere
2 -
SAP S4HANA Cloud
1 -
SAP S4HANA Migration Cockpit
1 -
Technology Updates
6,873 -
Technology Updates
417 -
Workload Fluctuations
1
Related Content
- 体验更丝滑!SAP 分析云 2024.07 版功能更新 in Technology Blogs by SAP
- Top Picks: Innovations Highlights from SAP Business Technology Platform (Q1/2024) in Technology Blogs by SAP
- What’s New in SAP Analytics Cloud Release 2024.08 in Technology Blogs by SAP
- Sneak Peek in to SAP Analytics Cloud release for Q2 2024 in Technology Blogs by SAP
- Deep dive into Q4 2023, What’s New in SAP Cloud ALM for Implementation Blog Series in Technology Blogs by SAP
Top kudoed authors
| User | Count |
|---|---|
| 34 | |
| 25 | |
| 12 | |
| 7 | |
| 7 | |
| 6 | |
| 6 | |
| 6 | |
| 5 | |
| 4 |