Value Driver Trees (VDT) in SAP Analytics Cloud (SAC) is a very effective simulation/What-If analysis process tool used on planning models.
We start with the assumption that the data model for planning scenario already exists within SAC, and the scenario for our VDT Process is to calculate the
Changes to Total Expenses based on a Driver.

In this blog, I will show you how you can create a VDT process for manipulating the Total Expenses as we change the Driver % for Expenses.
Please note: You can also create a similar process for Revenues and calculate Net Revenue.
In my current scenario, I will build the following formula to calculate the Total Expenses based on the user input Driver% increase or decrease:

Steps:
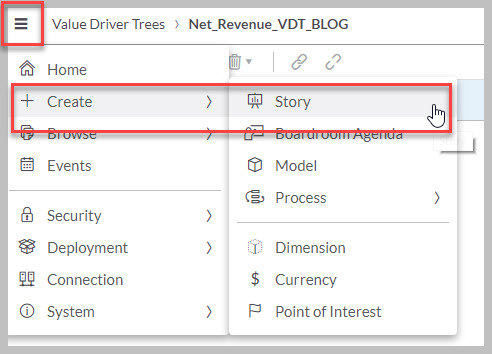
- From the Home menu, select Create --> Process -->Value Driver Tree

2. Provide a name and select the planning model and press Create.

3. In the Time & Model tab, I have granularity set to year, and the selected time period shows 2017. As I have only 2017 data, I will leave the selections as is:

4. Next we select the Calculation tab and start building our VDT process.
NOTE: For adding nodes use the "+" icon in the menu:

5. I will start by defining an existing node as a data source node, which is basically the source of data. In my case, this is going to be Driver% for Expenses, which I will use to input data for manipulating my expenses.

6. I will also define the next node as my Data Source Node which will be Total Expenses. This data
point is coming from my transaction data file.

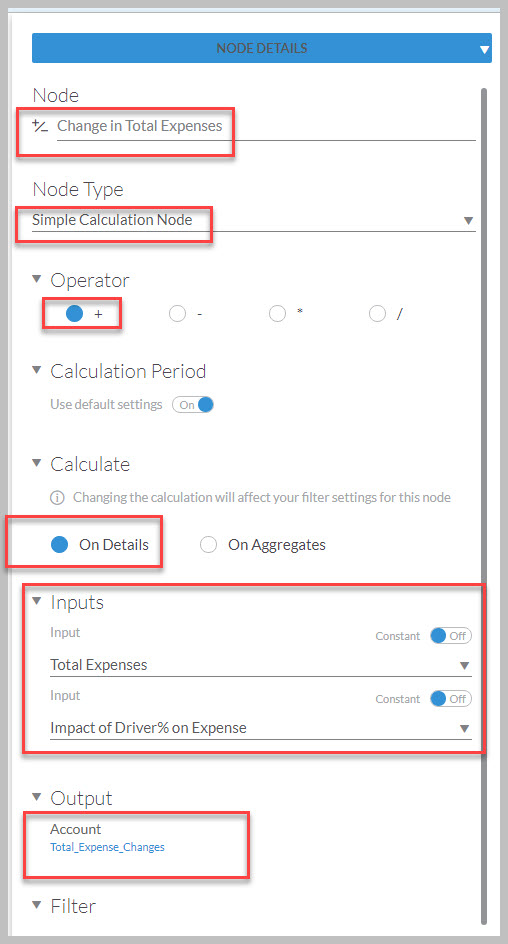
7. Now we combine the previous 2 nodes using a calculation node and specify an operation to
leverage the user input (Driver% for Expenses) data to manipulate the transaction data i.e. Total
Expenses. We start by creating a node and specify it as a Calculation node: Impact of Driver% on
Expense

8. The change (increase or decrease) in expenses derived from previous step needs to be added to
the existing expenses to get a final change in total expenses. In this step, I add 2 nodes:
a.Total Expenses Data source node which has the actual
b. Calculation node to sum the Total Expenses and the Impact of Driver% on Expense to derive
the Change in Total Expenses.
i) Total Expenses

ii) Change in Total Expenses
9. This completes the process of building the VDT. As a next step we copy this model for
consumption:

10. Click on Consumption tab to see the flow copied:

11. Save the model and click on the main menu and select create stories:
12. Add a Canvas Page, and select a table:


13. Assign a data source and select appropriate dimensions and measures:

14. Next insert the VDT model which we have created:


15. VDT model is now added to the canvas:

16. Start by copying the Actual to a Plan Version under Version management:

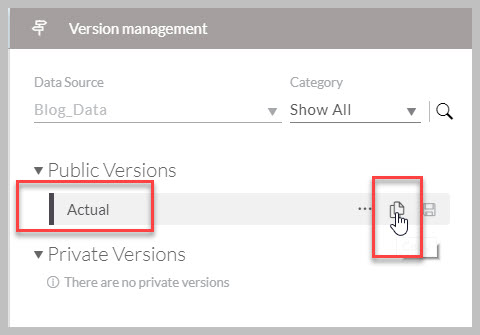
17. Give a name to the private version:

18. Filter the category dimension to choose Plan version.

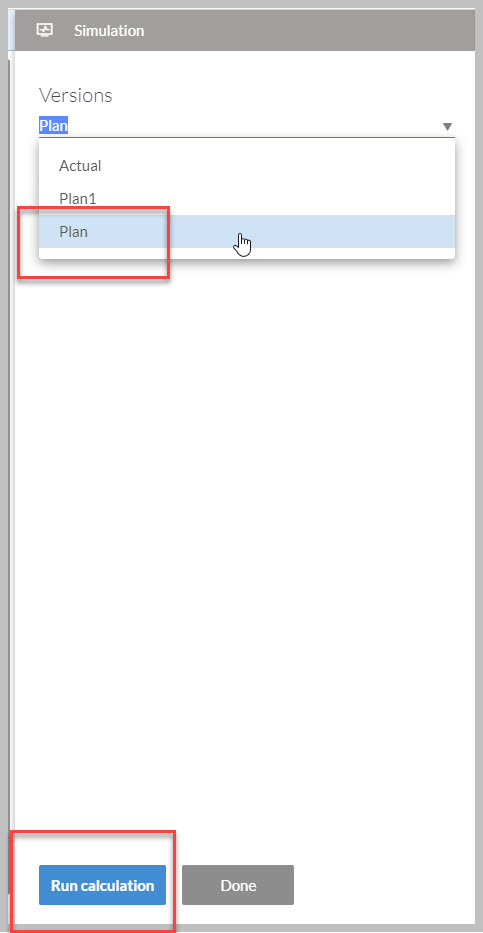
19. Filter the Plan version for the VDT:

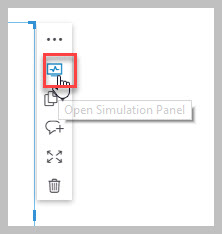
20. Change the Driver% for Expenses within VDT and Run the Simulation

Final Output After the Simulation:

Once the simulation run is complete, you will notice the changes to the values highlighted in yellow.
This concludes the blog. Hope you can use this functionality in your scenarios as well. Happy Simulations!!
See Also
