
- SAP Community
- Products and Technology
- Technology
- Technology Blogs by SAP
- KPI-Dashboard with Lumira 2.0 - Demo - Update Lumi...
Technology Blogs by SAP
Learn how to extend and personalize SAP applications. Follow the SAP technology blog for insights into SAP BTP, ABAP, SAP Analytics Cloud, SAP HANA, and more.
Turn on suggestions
Auto-suggest helps you quickly narrow down your search results by suggesting possible matches as you type.
Showing results for
Product and Topic Expert
Options
- Subscribe to RSS Feed
- Mark as New
- Mark as Read
- Bookmark
- Subscribe
- Printer Friendly Page
- Report Inappropriate Content
11-27-2017
12:15 PM
Please also see my 2nd Blog about SAC und DSP: SAP Community
The dashboard at hand is supposed to provide insights into the new Lumira 2.x features: The new composites, the integration of offline data and the adaptive containers are most important to note. Hence, this demo aims at showing how these features work in combination. Moreover, it serves as an inspiration and can be regarded as a template. Data used in dashboard is dummy data only. Visualizations have been chosen randomly to show a variety of chart types (e.g. radar, tag cloud, doughnut). The chosen type may therefore not match the type actually recommended for use for a specific KPI. Feel free to visit this blog regularly to stay up-to-date with the new Lumira innovations. The lumx-file can be downloaded at the end of the page.

Video (without audio):
Features:
Update 08.01.2018 (Lumira 2.1):
Update 12.01.2018 (Lumira 2.1):
Update 05.07.2018 (Lumira 2.1):

Update 16.10.2018 (Lumira 2.2):


If you like this blog, please click on the like-button.
The tile composite can be used either with or without chart area. It has the following features / properties:

All relevant elements are binded to the composite properties, so no script is needed here. There is only some script in the formatter functions and for the central function setValues to set the composite properties from outside the composite.
Update 12.01.2018 (Lumira 2.1):
I added the option to show a crosstab instead of chart and data labels for charts:

Each page of the TabStrip makes use of an adaptive container. In this demo, the adaptive container was configured in a way that it matches tablets, desktops and large desktop screens. There is also a fourth viewport used for smartphones, but it seems that smartphones does not support composites.
It is important to note, that due to the architecture of the adaptive container, tiles with charts should always be displayed at the beginning of a block in order to enable an optimal design. The different block size decides whether the lower part of the tile (the chart) is displayed or not.

Update 08.01.2018 (Lumira 2.1):
In the 2.0 version I allowed to scroll the page of tab-strip via css. In Lumira 2.1 there is a new component called scroll-container. So every adaptive container is embedded in a scroll container.
Tiles are initialized with the following command:
The value “1000” corresponds to the internal ID of the KPI. "KPI_TILE" is the technical name of the tile composite.
The values are read from a central DataSource and transferred to each tile via script. The tile itself does not have a data connection, it rather obtains its data using the consuming app and the respective DataSource. If you use a DataSource in a tile, the DataSource is loaded per instance of tile. Therefore, I would not recommend to use DataSources in Composites if you want to use the same composite more than once per Application.
In order to display chart data in the tile, the function setChartConfig is invoked within the tile. In this step, the type of the chart and the DataSources from the app are transferred to the tile (Update 12.01.2018: data labels can now also be configured).

The original solution was based on BW and the usage of attributes (KPI as main info object). To simulate attributes i decided to store all masterdata concatenated in one field separated by a "|".
In the onstartup-Event the function "splitMasterdata" is called. In this function the masterdata is read from the DataSource and splitted among the different arrays.

The following illustration exemplary shows how master data is used:

For each KPI, one can jump to a detail screen. This detail screen consists of the following areas: monthly progress, description and further evaluation of the KPI (if available).

The monthly progress shows the actuals, average and plan values. The description displays a long text for the KPI. The comment field on this page does not have a function. In the original BW-based solution, the text was written back to the BW using a specific planning function type from the BW-IP.
The detailed evaluation is always displayed in the same way. This area surely requires revision. However, it does show how KPI-specific evaluations can be integrated in a dashboard of this kind.

As Lumira 2.0 also provides an enhancement of the map component, a map illustration on the level of buildings was implemented for the KPI “Ø Enegy Costs per Building”:

The map can be found on third tab. Switch to the chart, activate navigation and choose in the chart type picker the map. From technical point of view the chart is set to invisible and the map-component gets visible. Sure, the third tab needs a little bit of rework.
Update 08.01.2018 (Lumira 2.1):
I added a commentary solution to the tab "Description". It is based on the new comment-function in Lumira 2.1 and the corresponding component "feed list".
The comments are bound to kpi-members and public.
Update 12.01.2018 (Lumira 2.1):
The "extended evaluation" has been completely redesigned. Some features have been copied from the Generic-Anaylsis-Template.

In the demo data, several KPIs distributed along the four tabs were already illustrated. If the end user searches for a specific KPI and does not want to click through all of the tabs, he or she can use the search function to directly navigate the desired KPI. The search can alternatively be invoked using CTRL+F.
This is just a very simple search solution based on Stringsearch.

Each user can select and save his favorite KPIs with the Dashboard start page.
Up to nine tiles can be stored. Tiles can also be deleted using the ‘delete’-symbol. The ordering is displayed in accordance to the time stamp of recording. Here, the new bookmarks from Lumira 2.0 are used. In the background, solely the IDs (1000,1001, etc.) of the selected tiles are saved and the tiles are rebuild with every start.

Update 08.01.2018 (Lumira 2.1):
With Lumira 2.1 it is possible to create components during runtime, composites included. So it is a nice feature to reimplement my home-tab.

I only created an empty adaptive container at design time, the tiles and the plus-sign are created during runtime. Because each tile consists of a block and a custom component we must create in the first step a block and in step 2 the custom component in the previous created block:
Because there is no API to config the block via Script I copied the settings from a blank block (BLOCK_HOME_EMPTY_TEMPLATE) which was configured in design time. Same for my tile component because after dynamic creation the script for my interface function "openPopup" is empty. The function copyProperties also copies this type of properties.
With the new feature of dynamic creation of components and this new approch there is no limit for tiles on the home-page.

Please do not rename the lumx-file to avoid script errors during lumira 2.x runtime. Just copy it to your lumira documents folder.
LUMX-File
If you want to upload the lumx-file to your BIP, please keep in mind to change the following:
GS_TILES->calcTile looks like:
"LUM_C88EE0E557C0A60833590B6DAD6626FA_KPI_TILE" is generated by Lumira Designer so you have to change it. Please use content assistant to find the right one (should be begin with LUM*).
Same in GS_TILES-> calcAllTiles. Replace all occurrences of "LUM_C88EE0E557C0A60833590B6DAD6626FA_KPI_TILE" with your new Tile-ID.
There are a few more places where the ID schould be replaced:
In 2.0 SP2 PL1 it looks like there is an issue with composites as type in input paramaters of functions so I decided to use generic type "component" and cast it to the right type via "as".
Update 08.01.2018 (Lumira 2.1):
I added a new file to the share for Lumira 2.1. In same folder there is also the "old" 2.0 version if you are running 2.0 (but sure, without new features).
Update 16.10.2018 (Lumira 2.2):
I did not change the name of the file for 2.2.
Introduction
The dashboard at hand is supposed to provide insights into the new Lumira 2.x features: The new composites, the integration of offline data and the adaptive containers are most important to note. Hence, this demo aims at showing how these features work in combination. Moreover, it serves as an inspiration and can be regarded as a template. Data used in dashboard is dummy data only. Visualizations have been chosen randomly to show a variety of chart types (e.g. radar, tag cloud, doughnut). The chosen type may therefore not match the type actually recommended for use for a specific KPI. Feel free to visit this blog regularly to stay up-to-date with the new Lumira innovations. The lumx-file can be downloaded at the end of the page.
Video (without audio):
Features:
- Offline-data imported via Lumira Discovery
- KPI-tiles as custom components
- Fiori 2.0 Look & Feel
- Details for all KPIs
- Built-in search functionality for KPIs
- Freely configurable Home-Page
- KPI-specific reports incl. map
Update 08.01.2018 (Lumira 2.1):
- The application has been translated into English (all screenshots in this blog have been replaced)
- Dynamic creation of tiles for Home-Page
- Comments
- Comments application-based (copied from 2.1 Feature Samples) - first icon top right
- Comments on Crosstabs (copied from 2.1 Feature Samples) - open context menu for crosstab
- Comments on Members for tab "Description" in details
- New Scroll-Container
Update 12.01.2018 (Lumira 2.1):
- Redesign of "Extended Evaluation"
- Data Labels in Tiles
- Crosstabs in Tiles
Update 05.07.2018 (Lumira 2.1):
- New App based on Belize Theme (default app)
- New help-function, which can be activated by clicking the help-icon top right
Update 16.10.2018 (Lumira 2.2):
- New area "Sales"
- New feature for tiles: switch dimension for charts
- New table configurator. Just bind the composite to a crosstab.
- Composite in Composite
- Search for dimensions
- Sort dimensions
- Show/hide dimensions
If you like this blog, please click on the like-button.
Custom Components for Tiles
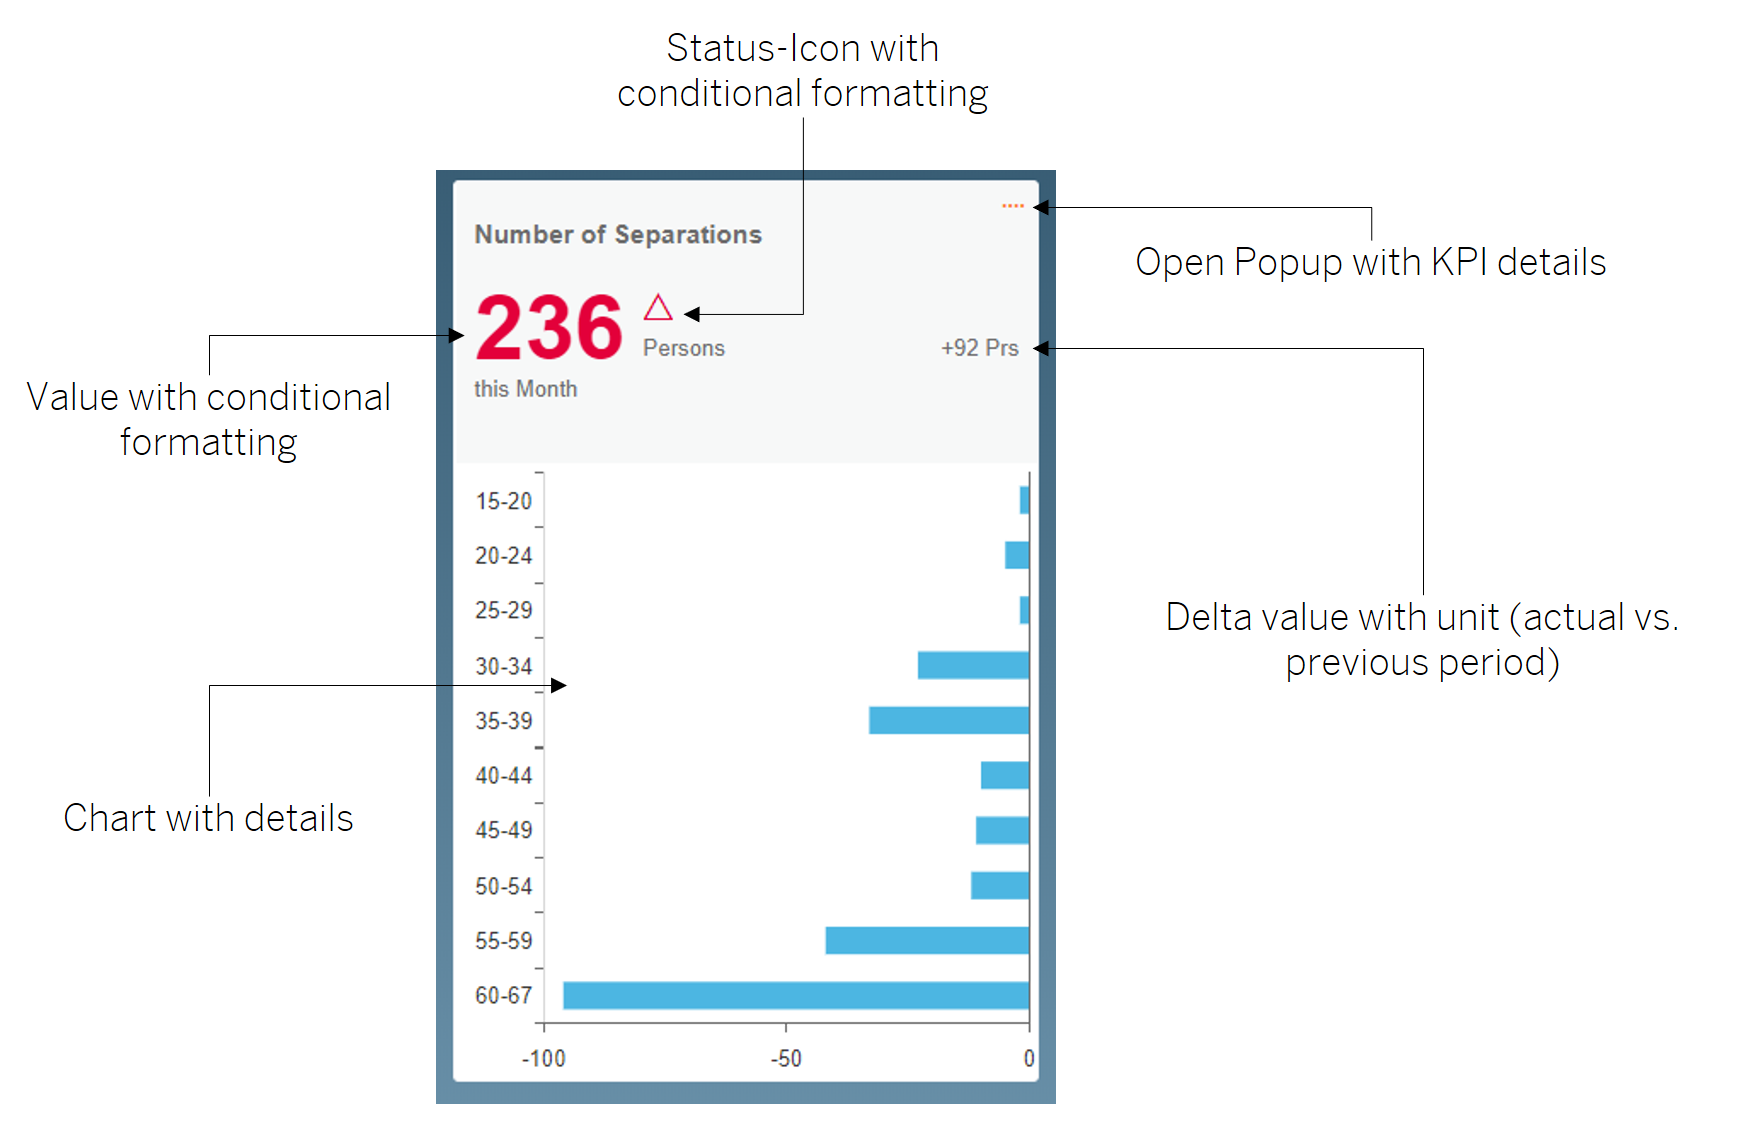
The tile composite can be used either with or without chart area. It has the following features / properties:
- Display of KPI name
- Display of values, optionally with color code
- Unit of KPI
- Trend icon and value
- Link to KPI details
All relevant elements are binded to the composite properties, so no script is needed here. There is only some script in the formatter functions and for the central function setValues to set the composite properties from outside the composite.
Update 12.01.2018 (Lumira 2.1):
I added the option to show a crosstab instead of chart and data labels for charts:
Adaptive Container
Each page of the TabStrip makes use of an adaptive container. In this demo, the adaptive container was configured in a way that it matches tablets, desktops and large desktop screens. There is also a fourth viewport used for smartphones, but it seems that smartphones does not support composites.
It is important to note, that due to the architecture of the adaptive container, tiles with charts should always be displayed at the beginning of a block in order to enable an optimal design. The different block size decides whether the lower part of the tile (the chart) is displayed or not.
Update 08.01.2018 (Lumira 2.1):
In the 2.0 version I allowed to scroll the page of tab-strip via css. In Lumira 2.1 there is a new component called scroll-container. So every adaptive container is embedded in a scroll container.
Usage of Tiles
Tiles are initialized with the following command:
GS_TILES.calcTile(„1000“, KPI_TILE)The value “1000” corresponds to the internal ID of the KPI. "KPI_TILE" is the technical name of the tile composite.
The values are read from a central DataSource and transferred to each tile via script. The tile itself does not have a data connection, it rather obtains its data using the consuming app and the respective DataSource. If you use a DataSource in a tile, the DataSource is loaded per instance of tile. Therefore, I would not recommend to use DataSources in Composites if you want to use the same composite more than once per Application.
In order to display chart data in the tile, the function setChartConfig is invoked within the tile. In this step, the type of the chart and the DataSources from the app are transferred to the tile (Update 12.01.2018: data labels can now also be configured).
The original solution was based on BW and the usage of attributes (KPI as main info object). To simulate attributes i decided to store all masterdata concatenated in one field separated by a "|".
In the onstartup-Event the function "splitMasterdata" is called. In this function the masterdata is read from the DataSource and splitted among the different arrays.
The following illustration exemplary shows how master data is used:
- column A: key of kpi
- column B: description
- column C: area (used for search-function to find tab)
- column 😧 category (not used)
- column E: sub-category (not used)
- column F: unit for kpi
- column G: delta-unit for kpi
- column H: color of the arrow when the value increases compared to the previous period
- column I: number of decimal places for kpi
- column J: scaling factor
- column K-end: ranges for conditional format of kpi
Details
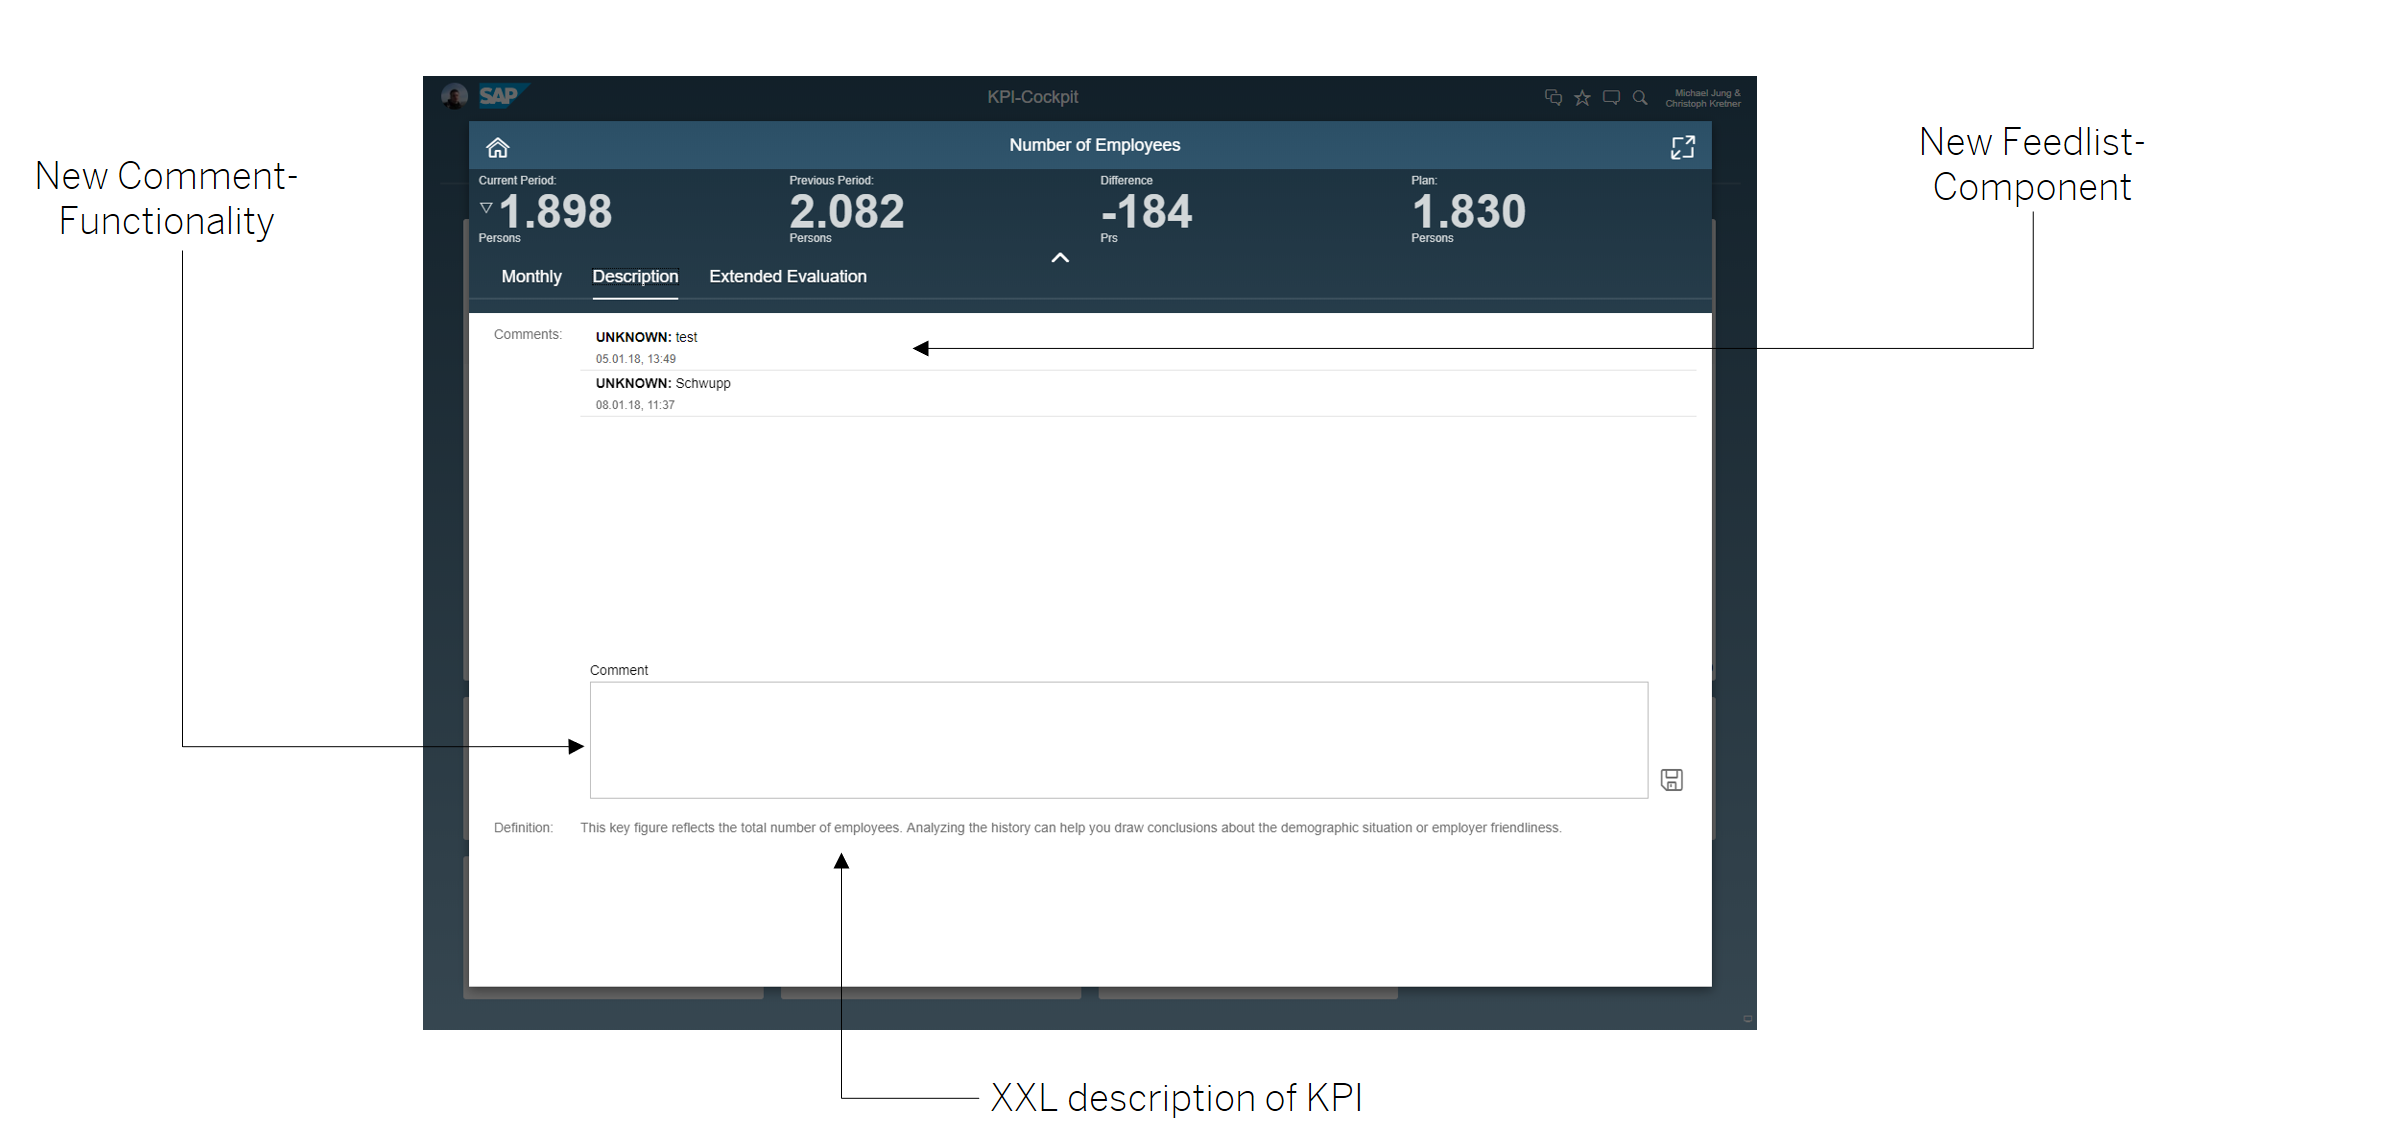
For each KPI, one can jump to a detail screen. This detail screen consists of the following areas: monthly progress, description and further evaluation of the KPI (if available).
The monthly progress shows the actuals, average and plan values. The description displays a long text for the KPI. The comment field on this page does not have a function. In the original BW-based solution, the text was written back to the BW using a specific planning function type from the BW-IP.
The detailed evaluation is always displayed in the same way. This area surely requires revision. However, it does show how KPI-specific evaluations can be integrated in a dashboard of this kind.
As Lumira 2.0 also provides an enhancement of the map component, a map illustration on the level of buildings was implemented for the KPI “Ø Enegy Costs per Building”:
The map can be found on third tab. Switch to the chart, activate navigation and choose in the chart type picker the map. From technical point of view the chart is set to invisible and the map-component gets visible. Sure, the third tab needs a little bit of rework.
Update 08.01.2018 (Lumira 2.1):
I added a commentary solution to the tab "Description". It is based on the new comment-function in Lumira 2.1 and the corresponding component "feed list".
The comments are bound to kpi-members and public.
var text = COMMENTS_TEXT.getValue();

COMMENTS_TEXT.setValue("");

APPLICATION.createInfoMessage(gv_selected_kpi);


var commentId = COMMENTS.create(text,{

    "context": {"(MEASURES_DIMENSION)":"DS:60,MEAS:id_169","DS:60,DIM:id_151":gv_selected_kpi} ,

    "contextType": CommentContextType.MEMBER,

    "dataSource": DS_TRANSACTIONAL_DATA,

    "isPublic": true

	});


COMMENTS_FEEDLIST_GLOBAL.addItem(COMMENTS.getComment(commentId),true);
Update 12.01.2018 (Lumira 2.1):
The "extended evaluation" has been completely redesigned. Some features have been copied from the Generic-Anaylsis-Template.
KPI-Search
In the demo data, several KPIs distributed along the four tabs were already illustrated. If the end user searches for a specific KPI and does not want to click through all of the tabs, he or she can use the search function to directly navigate the desired KPI. The search can alternatively be invoked using CTRL+F.
This is just a very simple search solution based on Stringsearch.
Home
Each user can select and save his favorite KPIs with the Dashboard start page.
Up to nine tiles can be stored. Tiles can also be deleted using the ‘delete’-symbol. The ordering is displayed in accordance to the time stamp of recording. Here, the new bookmarks from Lumira 2.0 are used. In the background, solely the IDs (1000,1001, etc.) of the selected tiles are saved and the tiles are rebuild with every start.
Update 08.01.2018 (Lumira 2.1):
With Lumira 2.1 it is possible to create components during runtime, composites included. So it is a nice feature to reimplement my home-tab.
I only created an empty adaptive container at design time, the tiles and the plus-sign are created during runtime. Because each tile consists of a block and a custom component we must create in the first step a block and in step 2 the custom component in the previous created block:
block = COMPONENTS.createComponent(ComponentType.Block,ADAPTIVE_LAYOUT_HOME);

// copy properties from an empty block, otherwise the content of block is copied too

COMPONENTS.copyProperties(BLOCK_HOME_EMPTY_TEMPLATE, block);

tile = COMPONENTS.createComponent(ComponentType.LUM_9BB26EB2E9EFB499D479C4E19E5C7AB5_KPI_TILE, block);

// we need the standard script for onClickNewTile... there is no api so we copy from existing newTile

COMPONENTS.copyProperties(KPI_TILE_HOME_TEMPLATE, tile);
Because there is no API to config the block via Script I copied the settings from a blank block (BLOCK_HOME_EMPTY_TEMPLATE) which was configured in design time. Same for my tile component because after dynamic creation the script for my interface function "openPopup" is empty. The function copyProperties also copies this type of properties.
With the new feature of dynamic creation of components and this new approch there is no limit for tiles on the home-page.
Misc
Download
Please do not rename the lumx-file to avoid script errors during lumira 2.x runtime. Just copy it to your lumira documents folder.
LUMX-File
If you want to upload the lumx-file to your BIP, please keep in mind to change the following:
GS_TILES->calcTile looks like:
I_TILE.as(ComponentType.LUM_C88EE0E557C0A60833590B6DAD6626FA_KPI_TILE).setValues(Convert.floatToStringUsingLocale(actual_value.value / scaling_factor,number_decimal_places), description, unit, delta, deltaValue , time, I_KPI, valueCondFormat, details, deltacolor,xxl_text);"LUM_C88EE0E557C0A60833590B6DAD6626FA_KPI_TILE" is generated by Lumira Designer so you have to change it. Please use content assistant to find the right one (should be begin with LUM*).
Same in GS_TILES-> calcAllTiles. Replace all occurrences of "LUM_C88EE0E557C0A60833590B6DAD6626FA_KPI_TILE" with your new Tile-ID.
There are a few more places where the ID schould be replaced:
- GS_SEARCH--> select
- ICON_HOME_TILE_1_DELETE - ICON_HOME_TILE_9_DELETE -> onClick
- TIMER_SEARCH -> onTime
In 2.0 SP2 PL1 it looks like there is an issue with composites as type in input paramaters of functions so I decided to use generic type "component" and cast it to the right type via "as".
Update 08.01.2018 (Lumira 2.1):
I added a new file to the share for Lumira 2.1. In same folder there is also the "old" 2.0 version if you are running 2.0 (but sure, without new features).
Update 16.10.2018 (Lumira 2.2):
I did not change the name of the file for 2.2.
- SAP Managed Tags:
- SAP BusinessObjects Design Studio,
- SAP Lumira,
- SAP Lumira, desktop edition
Labels:
151 Comments
- « Previous
-
- 1
- 2
- 3
- 4
- Next »
You must be a registered user to add a comment. If you've already registered, sign in. Otherwise, register and sign in.
Labels in this area
-
ABAP CDS Views - CDC (Change Data Capture)
2 -
AI
1 -
Analyze Workload Data
1 -
BTP
1 -
Business and IT Integration
2 -
Business application stu
1 -
Business Technology Platform
1 -
Business Trends
1,661 -
Business Trends
85 -
CAP
1 -
cf
1 -
Cloud Foundry
1 -
Confluent
1 -
Customer COE Basics and Fundamentals
1 -
Customer COE Latest and Greatest
3 -
Customer Data Browser app
1 -
Data Analysis Tool
1 -
data migration
1 -
data transfer
1 -
Datasphere
2 -
Event Information
1,400 -
Event Information
64 -
Expert
1 -
Expert Insights
178 -
Expert Insights
269 -
General
1 -
Google cloud
1 -
Google Next'24
1 -
Kafka
1 -
Life at SAP
784 -
Life at SAP
10 -
Migrate your Data App
1 -
MTA
1 -
Network Performance Analysis
1 -
NodeJS
1 -
PDF
1 -
POC
1 -
Product Updates
4,578 -
Product Updates
317 -
Replication Flow
1 -
RisewithSAP
1 -
SAP BTP
1 -
SAP BTP Cloud Foundry
1 -
SAP Cloud ALM
1 -
SAP Cloud Application Programming Model
1 -
SAP Datasphere
2 -
SAP S4HANA Cloud
1 -
SAP S4HANA Migration Cockpit
1 -
Technology Updates
6,886 -
Technology Updates
389 -
Workload Fluctuations
1
Related Content
- Unveiling SAP BusinessObjects BI 4.3 SP04 ! in Technology Blogs by SAP
- KPI-Dashboard with SAC and Datasphere in Technology Blogs by SAP
- Managing the Update and Migration Challenge for SAP BusinessObjects BI Platform: Staying Aligned with SAP Roadmap for Analytics in Technology Blogs by SAP
- SAP Analytics Business Intelligence Statement of Direction – October 2023 update in Technology Blogs by SAP
- Where do the Lumira Plugin reside on the BO Server in Technology Q&A
Top kudoed authors
| User | Count |
|---|---|
| 12 | |
| 11 | |
| 11 | |
| 9 | |
| 9 | |
| 9 | |
| 9 | |
| 8 | |
| 7 | |
| 7 |