Skip to Content
Author's profile photo Thomas Paulus

SAP Solution Manager 7.2 Dashboard Builder – new features with SP06

In this blog I want to introduce some of the new features we provide with SAP Solution Manager 7.2 SP06. Below you can find the video which includes the following new features:

  • Icon support for numeric tiles
  • Performance improvements for table controls
  • Auto-refresh
  • Interaction between drill-down views
  • Color definition based on standard Fiori color palette
  • Support of additional chart types
  • Filter icon highlighted in case filter is set

Icon support for numeric tiles

For numeric tiles it’s now possible to select an icon that will be shown within the tile. The selection is based on the standard SAPUI5 icon library.

Performance improvements for table controls

Especially for huge data sets we faced issues with the performance in case all data records are loaded at once. In order to avoid this issue we introduced paging for table controls. In that case only the first data records are loaded and displayed in the table control. If you scroll down the additional data records are loaded from the backend. This way we can improve the performance concerning the initial loading and display of tables.
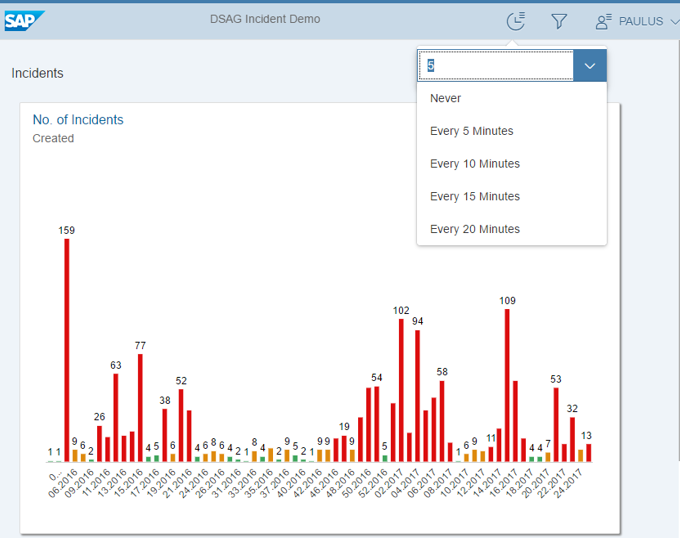
Auto-refresh

With SP05 it is already possible to define an auto-refresh in minutes in the configuration of the Dashboard Builder. With SP06 we provide now the possibility for end users to disable the auto-refresh and to change the refresh interval.

Interaction between drill-down views

If you use multiple Drill-Down views in a detail page you can now jump from one drill-down view to another one passing over the filter. For example you have a drill-down that shows the number of Incidents per priority in a column chart. If you click on a column (e.g. Priority “Very high”) you get a pop-over where you can select the drill-down view where you want to jump to.

In the example above we choose the drill-down view “Per status per week”. In that case the selection (priority “Very high”) will be passed over as filter to the drill-down view “Per status per week”. You always see the current context and the selections in the header of the page. Using the header you can also navigate back to the previous drill-down view.

Color definition based on standard Fiori color palette

In SP06 it was already possible to define colors for charts based on a color picker control. Now we provide the option to choose the colors based on the standard Fiori color palette. In the example below we use the sequential color palette for visualize the priorities from dark blue to light blue.

This is how the result looks like in a bar chart.

Support of additional chart types

For the dashboard tiles and the drill-down views we support now additional chart types. Below you can find a list with all visualizations that can be selected:

  • 100% Stacked Bar chart
  • 100% Stacked Column chart
  • Bar chart
  • Column chart
  • Combination chart (Column and Line)
  • Donut chart
  • Heatmap
  • Horizontal Stacked Combination chart
  • Horizontal Waterfall chart
  • Line chart
  • Micro-Column chart
  • Micro-Comparison chart
  • Micro-Line chart
  • Number-based
  • Pie Chart
  • Stacked Column chart
  • Stacked Combination chart
  • Table
  • Waterfall chart

Filter icon highlighted in case filter is set

In some cases it is not clear whether a global filter is set (either as a default value defined in the configuration or if a filter was set by the end user). With SP06 we highlight the filter icon in the header in case any filter is applied.

In case you have feedback to the new features or if you have any suggestion to further improve the Dashboard Builder, please let me know (just add a comment below the blog). I’m also more than happy to answer your questions.

More Information

Assigned Tags

      61 Comments
      You must be Logged on to comment or reply to a post.
      Author's profile photo Balaji Rajendran
      Balaji Rajendran

      How do you do anonymous login to dashboard, so that we can provide visibility to anyone without a solution manager account

      Author's profile photo Thomas Paulus
      Thomas Paulus
      Blog Post Author

      You can define an anonymous login to the dashboard by setting the user id and password in the transaction SICF. The following services are related to the Dashboard Builder:

      • AGS_DSH_CHAR_SEARCH_HELP_SRV
      • AGS_DSH_CURRENCY_VP_SRV
      • AGS_DSH_KPI_DATA_SRV
      • AGS_DSH_META_DATA_SRV
      • AGS_DSH_TILE_META_DATA_SRV
      • dsh_builder_ui5

      It could be that additional UI services used by the Dashboard Builder need to be set accordingly.

      Best regards, Thomas

      Author's profile photo Balaji Rajendran
      Balaji Rajendran

      Performed the above settings and still asks me for user id and password.

      Does it need a restart or refresh somewhere

      Author's profile photo Thomas Paulus
      Thomas Paulus
      Blog Post Author

      No, there should be no restart required. Maybe there is another service that needs to be considered in the transaction sicf. I would suggest to create an Incident so that my colleagues can check it and support you.

      Author's profile photo Babu Subramaniam
      Babu Subramaniam

      Thanks for the detailed blog.  This is very good.  In your earlier blog you have referred that fiori tiles cannot be included in the personal dashboard and to use the dashboard URL for the end user consumption of these tiles.   Can you tell me where I get this URL.  I tried to open the 'View Mode' that is next to Global Filters, to see if this URL can be given to end users, but however the page results in a blank page (both in blue crystal and high contrast black).  I have tested this in IE and Chrome but same blank page.  Can you tell me how to generate a URL for end user?  I am in SP04.

      Author's profile photo Thomas Paulus
      Thomas Paulus
      Blog Post Author

      Thanks. You should normally get the URL for end users if you click on "View Mode". E.g. to access the Tile-based Template-Dashboard, the URL should look like this:

      https://server:port/sap/bc/ui5_ui5/sap/dsh_builder_ui5/index.html?DSH_ID=HNQUY37DEFGHIJKL

      (for this the sicf-sevice "dsh_builder_ui5" needs to be active).

      Maybe you can check it again. Do you get any http request error in your browser?


      Author's profile photo Babu Subramaniam
      Babu Subramaniam

      Thanks again.

      Below is the URL that is opened in a separate browser when I click the view mode.

      http://<servername>:port/sap/bc/ui5_ui5/sap/dsh_builder_ui5/index.html?DSH_ID=ZW5L9UC2F45R78E1&sap-language=EN&sap-ui-theme=sap_bluecrystal.

      SICF Service 'dsh_builder_ui5' is already active..

      There is no http request error.  As soon as I click the view mode, I see a separate browser opened with that URL with blue screen that has SAP Logo and the User Preference Icon.  In the content area it is just a blank blue screen.  From an authorization perspective, the user I use is a powerful user which was used to build these tiles.


      Author's profile photo Thomas Paulus
      Thomas Paulus
      Blog Post Author

      We would need to check the requests on gateway-side. If you haven't done so, please create an Incident, so that my colleagues can check and analyze the issue.

      Best regards, Thomas

      Author's profile photo Oscar Maina
      Oscar Maina

      Hello Paul,

      Thanks to your blog I have made steps in using SAP dashboard builder. I got this issue while creating a standard tile using KPI catalog. The Catolog is blank, what could be the issue? see attached screenshot.


      Regards


      Author's profile photo Terry Huang
      Terry Huang

      Hello Oscar,


      You can take a look at SAP note 2382629 - KPI Catalog not available when called from applications.

      In this note it tell you need to install a S-user certification to you browser and how to.


      Best regards,

      Terry

      Author's profile photo Oscar Maina
      Oscar Maina

      Hello Terry,

      Thanks for you response, I did implement the SAP note but the issue persists.


      Regards

      Author's profile photo Thomas Paulus
      Thomas Paulus
      Blog Post Author

      Hello Oscar,

      have you installed a S-User certificate as described in the following note?

      https://launchpad.support.sap.com/#/notes/1296615

      If the issue still persists, I would recommend to create an Incident so that our we can analyze the issue.

      Best regards, Thomas

      Author's profile photo Axel Börke
      Axel Börke

      Hi Thomas,


      thanks a lot for your informative blogs regarding ITSM Dashboard. We have just implemented a custom Dashboard using Badi and are very happy with the results!

      Once question - is it somehow possible to show a timestamp of the current system time of the dashboard? Background: We are on SP04 and are doing the auto-refresh using a Chrome Plugin.

      It would be nice to see that the data that is shown is actually up-to-date, otherwise e.g. lets assume the system freezes, you wouldnt be able to tell that it's not showing current data anymore.

      Author's profile photo Thomas Paulus
      Thomas Paulus
      Blog Post Author

      Hi Axel,

      thank you. I agree, it would make sense to show the current system time for dashboards that have an auto-refresh enabled. I will add this to our backlog. Once I know in which SP we can provide it, I can inform you.

      Maybe as a workaround in SP04 you could create a BAdI that just provides the sy-uzeit and maybe just a constant 1 as key figure so that you could use it in a tile. This would e.g. look like this:

      I hope this helps. Thanks again for your comment, we are always interested in feedback and further improvements.

      Best regards, Thomas

      Author's profile photo Axel Börke
      Axel Börke

      Hi Thomas,

      that sound like a feasable workaround. Thanks a lot, we will try this!

      Author's profile photo Thomas Paulus
      Thomas Paulus
      Blog Post Author

      Hi Axel,

      you're welcome. We also plan to show the current system time in the header area in case an auto-refresh is enabled for a dashboard with SAP Solution Manager 7.2 SP07.

      Best regards, Thomas

      Author's profile photo Anton Malaiko
      Anton Malaiko

      Hello Thomas, in Dushboard Builder in  Change Management category i find dushboar analitycs in charm, how can i add this dushboar to home page in fiori lunchpad or in change management catalog? When i try edit home page and seek this dushboard in change management category i did't find it.


      Author's profile photo Thomas Paulus
      Thomas Paulus
      Blog Post Author

      Hello Anton,

      not all dashboards are available in the change management catalog in the Launchpad by default. But you can add predefined or newly created dashboards to the SAP Solution Manager Launchpad yourself. You can find some information on how to do it in this blog.

      In the Dashboard Builder you only need the URL in the view mode and then you can create new tiles in the Launchpad like described in the blog.

      Let me know in case of questions.

      Best regards, Thomas

      Author's profile photo PIYUSH JAIN
      PIYUSH JAIN

      Thanks Thomas, nice to see such flexibility in Dashboard Builder.

      Would like to understand if below few things can be done using Dashboard Builder

      1) Change Control Analytics shows reporting based on Transaction Type like ZMHF,ZMMJ etc. Rather than transaction type, can we display similar results based on Description of Transaction type like Urgent Change, Normal Change etc.

      2) Also can we filter based on category wised Change Documents and further detailed drill down if possible.

      Regards,
      Piyush Jain

      Author's profile photo Thomas Paulus
      Thomas Paulus
      Blog Post Author

      Hi Pijush,

      1. Yes, you can display also the description of the transaction types. In order to do so you have to change the BW Infoobject properties in the Query Designer so that the description is displayed by default. The technical name of the InfoObject is 0SPRTTYPE.
      2. Generally you can use the global filter to filter on all available characteristics. This depends on which characteristics are included in the underlying BW Query. Also you can use the Drilldown-Views or the Smart view for further drill down. You can also check in the KPI catalog which KPI's and which characteristics are available.

      Let me know in case of additional questions.

      Best regards, Thomas

      Author's profile photo Former Member
      Former Member

      Hello Thomas,


      thanks for this blog ! We just upgrade to SP05 and do not plan to install SP06 before the end of year.. If we would like to improve our dashboard with some of those nice functionnalities, can we found them in some notes ?


      Thanks in advance,

      Géraldine

      Author's profile photo Thomas Paulus
      Thomas Paulus
      Blog Post Author

      Hello Géraldine,

      I'm sorry to tell you that the new functionalities are only available in SP06. Unfortunately we could not provide notes for these functionalities in SP05.

      Best regards, Thomas

      Author's profile photo Former Member
      Former Member

      Thanks for your fast answer. We will have to wait for the next upgrade then !

      Author's profile photo Marc Sittler
      Marc Sittler

      Hi Thomas,


      just a question - how can I make a self-created dashboard accessable for everyone?


      Kind regards


      Marc


      Author's profile photo Thomas Paulus
      Thomas Paulus
      Blog Post Author

      Hi Marc,

      if you stored the self-created dashboard under a category that is included in the standard SAP end user role for the dashboard builder (SAP_SM_DSH_DISP), then end users should see it automatically (all the SAP delviered categories are included in the role SAP_SM_DSH_DISP.

      If you used another category, you need to include the category id in the end user role. You can find the required IDs of the categories in table AGS_DSH_CAT.

      The related authorization objects are described in the SAP Help Portal.

      Let me know in case you have questions on that.

      Best regards, Thomas


      Author's profile photo Kai Bauer
      Kai Bauer

      Hi Thomas, Hello everyone,

      does anyone know a simple way to create number-based Tiles like:

      • Total Count of all ABAP Systems
      • Total Count of all Java Systems
      • Total Count of all other Systems
      • Number of Systems that have a synchronization timestamp older than 30 days

      or is it necessary to write a function module according to

      'DSH_SAMPLE_FM_DATASET - test function module for dashboard builder'

      that reads the information from Database Table 'LAPI_TECH_SYSTEM'?

      Thanks for this very usefull blogpost,
      Kai

      Author's profile photo Thomas Paulus
      Thomas Paulus
      Blog Post Author

      Hi Kai,

      as far as I know there are no standard BW Queries available that could be used. Within the transaction LMDB you can also access information about the technical systems and the related types. Via the link LMDB Charts you can also access some visualizations e.g. to display the Number of systems per system type. But I'm not sure how the data is accessed for this Web Dynpro application.

      So if you want to use the Dashboard Builder it might be best to create your own Function module or BAdI.

      Best regards, Thomas

      Author's profile photo Kai Bauer
      Kai Bauer

      Solved by a custom function module:

      https://blogs.sap.com/2018/04/24/how-to-realize-a-solution-manager-lmdb-system-overview-in-dashboard-builder/

      Author's profile photo Niranjan Renjala Upadhyaya
      Niranjan Renjala Upadhyaya


      Hi Thomas,


      I have configured few monitoring objects with application KPIs for Business Process Monitoring in SolMan 7.2 SP06. When I try to create dashboard with Dashboard Builder, I am unable to see the "Business Process Monitoring" as a Data Source. All the mandatory configurations and Basic BPO configurations in solman_setup are completed successfully.


      Thanks,

      Niranjan

      Author's profile photo Thomas Paulus
      Thomas Paulus
      Blog Post Author


      Hi Niranjan,

      can you please check whether your user has the roles SAP_SM_DSH_CONF and SAP_SM_BI_DSH_CONF assigned? This should include the authorization to use “Business Process Monitoring” as a Data Source in the Dashboard Builder.

      You can also find some information concerning the creation of Business Process Monitoring dashboards in the following Wiki page: https://wiki.scn.sap.com/wiki/display/SM/8.+Dashboards+for+BPMon

      In case the roles are already assigned, I would suggest to create an Incident in order to check the issue.

      Best regards, Thomas

      Author's profile photo Niranjan Renjala Upadhyaya
      Niranjan Renjala Upadhyaya


      Hi Thomas,


      I had assigned these authorizations, but still had the issue. When I checked today, I could see the BPMon as a data source without me doing anything.

      Thanks,

      Niranjan

      Author's profile photo Ulrike Hormann
      Ulrike Hormann

      Hi Niranjan,

      most likely this is due to an inactive service. Can you make sure that all service containing BPM are active in SICF? It could also be an inactive oData Service or a missing system alias in one of the oData services.

      Best regards,
      Ulrike


      Author's profile photo Niranjan Renjala Upadhyaya
      Niranjan Renjala Upadhyaya


      Hi Thomas,


      In the Number based tile, it populates the decimal numbers like 150.000 or any number with ".000". How can we remove the decimal numbers in the dashboard?

      I have another question. If I have 2 monitoring objects configured with same KPIs but with different filters, how can we differentiate between then while creating the tile, as it only displays the Metric ID.

      For e.g. I have configured 2 monitoring objects with the metric Number of Notifications Completed with one having a filter on Notification Type M1 and another with Notification type M2. Now when I try to create a dashboard tile with line chart and trying to select the metric, I can see only the metric names and not the monitoring object names. I want to see only the measured values of the monitoring object with the notification type M1. How do I do this?


      Thanks,

      Niranjan

      Thanks,

      Niranjan

      Author's profile photo Ulrike Hormann
      Ulrike Hormann

      Hi Niranjan,

      maybe I can help with your second question.

      In order to create a tile that only shows the measured value for the metric monitoring notification type M1, you create a tile for key figure "Number of Notifications Completed". Afterwards you provide a filter for the Monitoring Object ID in your tile and restrict the display to the monitoring object checking notification type M1. When you use the value help in setting the filter for the Monitoring ObjectID, you will see the names of the monitoring objects, so finding the right object should be fairly easy.

      You can also use the Monitoring Object ID as a  characteritic in "Rows" or "Columns", but only if you do not use the number based tile.

      Please also keep in mind that many key figures in source BPMon return several values (usually MAX, AVG, SUM and LAST), so if you use the number based tile, you might have to filter on ONE key figure so the dashboard builder knows which number to display.

      For details, see https://wiki.scn.sap.com/wiki/display/SM/8.+Dashboards+for+BPMon.

      Author's profile photo Former Member
      Former Member

      Hi Thomas,

      I need your help to understand the calculation formula applied to calculate the ratio of Request for Change. Please have a look on below images.

      How to calculate 118% from Created RFC and Closed RFC?

      It is showing different result in DataGrid tab.

      Author's profile photo Terry Huang
      Terry Huang

      Hi Garg,


      Have you noticed that the filter on the dashboard head? Maybe you can set a same filter on the grid data. And check it again.

      Author's profile photo Kamel Soumeur
      Kamel Soumeur


      Hi Tomas and everyone

      Thanks for the blog Thomas!

      I have two questions:

      Q1: Is there a standard BW Query to the display the Average RFC response time of a system. I was able to find the BW query to display the Dialog Response Time but not the one for the RFC Response time.

      Q2: In interactive reporting in Solman 7.1, I used to have graphs to display the Read and Write access times per access to the database. I am not able to exact same thing. I was able to see some BW queries which mention response time for Asynchroneous reads, Synchroneous reads etc but not a simple measure as Average time per access.

      Thanks.

      Author's profile photo Kamel Soumeur
      Kamel Soumeur

      Hello Thomas and all

      Just wanted to tell everyone know that I found the BW Query which gives the read and write access times to the database as well as the number of accesses and the numbers of rows accessed. The BW Query is called 0CCMAW/0E2EREP_ABAP_DB_USAGE_DAY. The only problem is that it has mandatory fields and this is not supported by Dashboards, at least in Solman 7.2 SPS6.

      I am still looking for a BW Query to display the Average RFC response time.

      Any help would be appreciated.

      Thanks.

      KS.


      Author's profile photo Thomas Paulus
      Thomas Paulus
      Blog Post Author

      Hello Kamel,

      thanks for the update. With SP07 we provide the the possibility to use BW Queries with mandatory variables (see my latest blog). As a workaround you might copy the Query 0CCMAW/0E2EREP_ABAP_DB_USAGE_DAY and remove the mandatory variable in the BW Query Designer.

      I'm not 100% sure about the Average RFC response time. But you might check the Time profile InfoProvider 0CCMAW. E.g. there is a query with the technical name 0E2EREP_RETICOMP that provides the response times for the task type DIALOG. But you could change the task type from DIALOG to RFC. Maybe you can check whether this would fit. I hope that helps you in finding a suitable solution.

      Best regards, Thomas

      Author's profile photo Penny Nguyen
      Penny Nguyen

      Hello Thomas,

      • I'd like to create dashboard to monitor ABAP batch jobs status (canceled, finished ...) Which "data source type" and "Data Source Name" should I select?
      • When I select Data source type = Function Module and Data Source Name = SMOE_DISPLAY_JOB_IN_SM37 -> it displays "dataset of function module SMOE_DISPLAY_JOB_IN_SM37 is missing". I checked in tcode SE37, and see that Function module SMOE_DISPLAY_JOB_IN_SM37 in Solution Manager. Please give me advice on this.

      Thanks so much for your blogs!

      Penny


      Thanks for your help!


      Author's profile photo Thomas Paulus
      Thomas Paulus
      Blog Post Author

      Hello Penny,

      if you want to use a function module, it needs to fulfill certain criterias. You can find more information about in the SAP Help Portal.

      You might also use a BW Query. The related InfoProviders (depending whether you can to report on hourly, daily or weekly data)) can be found under the InfoArea 0SM_JSM.

      Best regards, Thomas

      Author's profile photo Vishwanath Vishwanath
      Vishwanath Vishwanath

      Hi Thomas,


      I have a requirement to populate all finished and cancelled jobs for a particular SID. System monitoring is setup and all data is populated correctly. Now I want to setup a tile for Jobs using the BW query as given in the attachment below. But in the overview screen, I am getting "No data". Could you please help where am i missing something? If I understand this correctly, then I can add tiles for other metrics as well. I am not sure where to put the SID in? it didnt ask for me any where to filter the SID.


      Regards,

      Vishwanath

      Author's profile photo Thomas Paulus
      Thomas Paulus
      Blog Post Author

      Hi Vishwanath,

      the configuration of the tile looks fine from my point of view. Do you get data if you execute the Query e.g. via transaction rsrt?

      Best regards, Thomas

      Author's profile photo Kamel Soumeur
      Kamel Soumeur

      Hello Thomas and all

      Just wanted to let everyone know that the BW Query suggested by Thomas (0E2EREP_RETICOMP) does indeed give the Average RFC response time. You need to put a filter on the Task Type = RFC and Key Figures = Response Time [s].

      When we tried it in our Solman Dev system where we don't have too much data, it worked. In our Solman Prod system where we have much more monitored systems and thus much more data, it was working as long as we did not put a filter on the Instance Name. We even added the instance name in the Columns and we were able to display the graphs for all the systems. However, as soon as we added a filter on Instance Name to display the Avg RFC response time for a particular system or instance, it was not able to display the graphs. The hourglass would never come back. Our DBAs had to add the following indexes to get it to work:

      CREATE INDEX SAPPM1."/BI0/ACCMDAWDD00~Z01" ON SAPPM1."/BI0/ACCMDAWDD00" ("SMD_SINA" ASC) ALLOW REVERSE SCANS COLLECT SAMPLED DETAILED STATISTICS;
      CREATE INDEX SAPPM1."/BI0/ACCMDAWWH00~Z01" ON SAPPM1."/BI0/ACCMDAWWH00" ("SMD_SINA" ASC) ALLOW REVERSE SCANS COLLECT SAMPLED DETAILED STATISTICS;
      CREATE INDEX SAPPM1."/BI0/ACCMDAWWD00~Z01" ON SAPPM1."/BI0/ACCMDAWWD00" ("SMD_SINA" ASC) ALLOW REVERSE SCANS COLLECT SAMPLED DETAILED STATISTICS;
      CREATE INDEX SAPPM1."/BI0/ACCMDAWMH00~Z01" ON SAPPM1."/BI0/ACCMDAWMH00" ("SMD_SINA" ASC) ALLOW REVERSE SCANS COLLECT SAMPLED DETAILED STATISTICS;
      CREATE INDEX SAPPM1."/BI0/ACCMDAWMD00~Z01" ON SAPPM1."/BI0/ACCMDAWMD00" ("SMD_SINA" ASC) ALLOW REVERSE SCANS COLLECT SAMPLED DETAILED STATISTICS;
      CREATE INDEX SAPPM1."/BI0/ACCMDAWDH00~Z01" ON SAPPM1."/BI0/ACCMDAWDH00" ("SMD_SINA" ASC) ALLOW REVERSE SCANS COLLECT SAMPLED DETAILED STATISTICS;
      CREATE UNIQUE INDEX SAPPM1."/BI0/SSMD_SINA~Z01" ON SAPPM1."/BI0/SSMD_SINA" ("SMD_SINA" ASC) INCLUDE ("SID") ALLOW REVERSE SCANS COLLECT SAMPLED DETAILED STATISTICS;
      CREATE UNIQUE INDEX SAPPM1."/BI0/TSMD_SINA~Z01" ON SAPPM1."/BI0/TSMD_SINA" ("SMD_SINA" ASC, "LANGU" ASC) INCLUDE ("TXTSH") ALLOW REVERSE SCANS COLLECT SAMPLED DETAILED STATISTICS;

      Best regards.

      Author's profile photo Thomas Paulus
      Thomas Paulus
      Blog Post Author

      Hello Kamel,

      I'm glad that it works. And thanks a lot for sharing it with everybody.

      Best regards, Thomas

      Author's profile photo Mirco Langhorst
      Mirco Langhorst

      Dear Thomas,

      I am trying to create a tile in Dashboard Builder > Change Control Management that provides an overview of all Change Documents that are currently in process and would like to use the relevant Change cycles as a filter criterion (see also attached Mockup). The issue I am currently facing is that I have not yet found a way to consider Change cycles in my tiles/Charts.

      Could you please advise how to proceed in order to Display and filter open Change documents per Change cycle?

      Thanks a lot for your support in advance & Kind regards,
      ​Mirco

      Author's profile photo Thomas Paulus
      Thomas Paulus
      Blog Post Author

      Dear Mirco,

      unfortunately the Change cycle has not been included in the BW data model for Change Control Management so far. With SAP Solution Manager 7.2 SP08 a new dashboard called "Cross Build Analytics" will be provided that includes the change cycle. It is based on a BAdI and you would be able e.g. to filter on Change cycles in the Smart View detail page (unfortunately the field cannot be used as global filter because the BAdI doesn't support it with SP08).

      Best regards, Thomas

      Author's profile photo Mirco Langhorst
      Mirco Langhorst

      Dear Thomas,

      Thanks a lot for your quick response and clarification - very much appreciated.

      Since change cycles are not included in the BW data model, is there a way to consider the relevant system information instead?

      Thanks again & kind regards,
      Mirco

      Author's profile photo Susanne Lippe
      Susanne Lippe

      Dear Thomas,

      thank your for your helpful blogs.

      We are currently facing the problem that we whant to use the ChaRM dashboard but are not able to make ZMIR available via SolMan Setup.
      ZMIR is the Change Request in our Process and w/o it the dashboard us useless.

      Could you please tell me how to make ZMIR available.
      Thank you in advance for your reply
      Regards

      Susanne

      Author's profile photo Saud Jabri
      Saud Jabri

      Hi Thomas;

      I am working on ITSM Setup in Solman 7.2 sp06, and in ITSM Analytics i am not able to pull the Incident created counts in the dashboard all in the dashboard shows as 0 and never shows the created count for Incident and Service request, could you please guide here to resolve this issue.

      Thank you

      Saud Khalid Jabri

      Author's profile photo Thomas Paulus
      Thomas Paulus
      Blog Post Author

      Hi Saud,

      maybe you can check the required steps in the ITSM Setup. The following Wiki page describes the prerequisites: https://wiki.scn.sap.com/wiki/display/SAPITSM/ITSM+Analytics

      If you cannot identify the issue, please create an Incident so that our support team can check the issue.

      Best regards, Thomas

      Author's profile photo Saud Jabri
      Saud Jabri

      Thanks Thomas;

      I am now able to see the count of tickets.

      I would also be like to know if there is a way with which we could add Two Dashboards in one page like for ITSM Incident Management Dashboad and Service Request Management Dashboard In one page, i am able to copy the tiles one by one but wanted to Merge two dashboards in one go .

      Thank you

      Saud Bin Khalid Jabri

      Author's profile photo Thomas Paulus
      Thomas Paulus
      Blog Post Author

      Hi Saud,

      sorry for the late reply. Unfortunately it‘s currently not possible to merge two dashboards into one page.

      Best regards, Thomas

      Author's profile photo HanumanthaRao Chundu
      HanumanthaRao Chundu

      Hi Thomas,


      I am working on BPM(Business Process Monitoring) in Solman 7.2. I am trying to create Custom KPI and Custom alert but not find any proper documents or blogs on it.

      Is it possible to create Custom KPI and Alert in Solution Manager 7.2? Our Solman Version is, "Solman 7.2 SP05" and it is a Pre-configured CAL(Cloud Appliance Library) system provided by SAP.

      If it is possible can you please provide some reference blog or documents!


      Regards,

      Hanumanth


      Author's profile photo Thomas Paulus
      Thomas Paulus
      Blog Post Author

      Hi Hanumanth,

      first of all I'm sorry for the late reply. Please find below a Wiki page with a lot of information concerning Business Process Monitoring Setup in SAP Solution Manager 7.2. I hope this information is helpful for you.

      Best regards, Thomas

      Author's profile photo Erich Weirich
      Erich Weirich

      Hi Thomas,

      Currently working on Dashboards for ITSM and ChaRM, I was looking for the combination charts. Is there any way to influence the behaviour of these charts. e.g. which element to display as bar and which as line or to change the colour of an element? I could not find anything in the Dashboad Builder itself nor on help.sap.com.

      Kind regards

      Erich

      Author's profile photo Thomas Paulus
      Thomas Paulus
      Blog Post Author

      Hi Erich,

      sorry, for the late reply. The behaviour of the combination chart depends on the sequence of the key figures. The first key figure is visualized as column chart whereas all other key figures are visualized as line charts.

      Unfortunately the color definition is currently not supported for some of the chart types including the combination chart.

      Kind regards, Thomas


      Author's profile photo Erich Weirich
      Erich Weirich

      Hi Thomas,

      thank you for the clarification. Just one more question: What is "the first key figure"? Is it the first key figure in the query behind, or the first one in the filter in the KPI?

      Kind regards

      Erich

      Author's profile photo Thomas Paulus
      Thomas Paulus
      Blog Post Author

      Hi Erich,

      it's the first key figure in the KPI filter in the tile configuration. The sequence in the BW query is not relevant.

      Kind regards, Thomas

      Author's profile photo BASIS Team
      BASIS Team

      Hello,


      Could you have document for configure Dashboard in solman 7.2 for ABAP, JAVA and other sap systems

      Author's profile photo Sam Sun
      Sam Sun

      Hi Colleagues,

      Could you refer to document in Help Portal by following URL:

      https://help.sap.com/viewer/82f6dd44db4e4518aad4dfce00116fcf/7.2.06/en-US/d0c91556d22c0033e10000000a44538d.html

      Best Regards,

      Sun Sam