

- SAP Community
- Products and Technology
- Technology
- Technology Blogs by SAP
- What’s New in SAP Analytics Cloud and SAP Digital ...
Technology Blogs by SAP
Learn how to extend and personalize SAP applications. Follow the SAP technology blog for insights into SAP BTP, ABAP, SAP Analytics Cloud, SAP HANA, and more.
Turn on suggestions
Auto-suggest helps you quickly narrow down your search results by suggesting possible matches as you type.
Showing results for
Former Member
Options
- Subscribe to RSS Feed
- Mark as New
- Mark as Read
- Bookmark
- Subscribe
- Printer Friendly Page
- Report Inappropriate Content
11-13-2017
7:30 PM
This blog covers some of the latest new features and enhancements in SAP Analytics Cloud* and SAP Digital Boardroom release 2017.22. Please note that the Analytics Cloud Help documentation is updated at the same time as the upgrade to this release, so the links here may not yet reflect what is described below until after the upgrade is complete.
SAP Analytics Cloud agent version required for data acquisition with this release:
For more information, see System Requirements and Technical Prerequisites.
Highlights of this release:
Learn with our latest video tutorials
When setting options for the time dimension in a model, you can now specify the default hierarchy that the time dimension will display in story tiles and filters.

You can now configure the time dimension for a model to use a fiscal year starting in the month of your choice, instead of the calendar year.


With this release, we’ve revamped the experience of importing data – now, you can use the card view to more easily map your uploaded data to an existing model.
You can now show or hide columns of the source data when creating a model or importing data.

When you add a comment on a data point, the comment now includes the original value if the data is updated in the cell – this now makes it easy for you and others to see what has changed.

The layout of the SAP Analytics Cloud mobile app now adapts to the edge-to-edge display of the iPhone X.

You can now create folders in the Save / Save As dialog when saving a story or a Digital Boardroom. By default, folders will be directly created under “My Files”. If you create folders within an existing folder (i.e. a public folder, team folder, or any other folder that is already shared), it will inherit the same security settings of its parent folder. You can also search to locate a specific subfolder to save into, or a specific story or boardroom to overwrite.

In release 2017.14, we introduced in-cell charts so that you can embed bar/column charts in your table cells. We’ve expanded on this capability so that you can now also include variance bar charts and variance pins (for % variance) in table cells. Plus and minus (+/-) signs in data labels are also supported.

Version patterns can now be used in variance bars and pins, in accordance with IBCS (International Business Communication Standards) standards. For a forecast-actual variance, the forecast pattern is shown in the bar or pin and the actual pattern is shown in the variance axis.
Version patterns will now be preserved when you apply thresholds on a chart. You can use the legend to quickly distinguish between patterns.

In this release, you now have better control over the display of threshold values and cells in a table.

You can now specify the number of decimal places used for measures and calculations in tables.

Geo maps now look better when you size them down in your stories. Improvements include:

*SAP Analytics Cloud was previously known as SAP BusinessObjects Cloud
**Legal disclaimer
SAP has no obligation to pursue any course of business outlined in this blog or any related presentation, or to develop or release any functionality mentioned therein. This blog, or any related presentation and SAP’s possible future developments, products and or platforms directions and functionality are all subject to change and may be changed by SAP at any time for any reason without notice. The information in this blog is not a commitment, promise or legal obligation to deliver any material, code, or functionality. This blog is provided without a warranty of any kind, either express or implied, including but not limited to, the implied warranties of merchantability, fitness for a particular purpose, or non-infringement. This blog is for informational purposes and may not be incorporated into a contract. SAP assumes no responsibility for errors or omissions in this document, except if such damages were caused by SAP’s willful misconduct or gross negligence.
All forward-looking statements are subject to various risks and uncertainties that could cause actual results to differ materially from expectations. Readers are cautioned not to place undue reliance on these forward-looking statements, and should not be relied upon in making purchasing decisions.
SAP Analytics Cloud agent version required for data acquisition with this release:
- Version 1.0.82 for SAP Business Warehouse (BW)
- Version 1.0.82 for SAP ERP / SQL databases
- Version 1.0.75 for all other data source types
- Note: Although it is not required, you can upgrade to the new agent version 1.0.82, no matter what data acquisition type you use. Do this to take advantage of updates made to SAP Analytics Cloud agent.
For more information, see System Requirements and Technical Prerequisites.
Highlights of this release:
- Specify the default hierarchy for the time dimension
- Support for fiscal years in the time dimension
- Map an uploaded dataset to an existing model using the card view
- Show/hide columns when preparing data
- Display updated values in data point comments
- Support for iPhone X
- Search and create folders when saving a story or Digital Boardroom
- Display variance charts in table cells
- Version patterns on variance bars and pins
- Thresholds support version patterns
- Table threshold formatting improvements
- Custom decimal places for table measures and calculations
- Improved look for smaller geo visualizations
Learn with our latest video tutorials
- Work with draft data
- Get sample and business content from the Content Library
- Create a Digital Boardroom agenda
- Create a Digital Boardroom dashboard
- Full tutorial playlist >
Planning
Specify the default hierarchy for the time dimension
When setting options for the time dimension in a model, you can now specify the default hierarchy that the time dimension will display in story tiles and filters.
Support for fiscal years in the time dimension
You can now configure the time dimension for a model to use a fiscal year starting in the month of your choice, instead of the calendar year.
- Charts, tables, value driver trees, and filters based on the model will display the time dimension based on your fiscal year configuration.
- Time-based calculations performed on the fiscal year hierarchy will use fiscal time as boundaries.
- You can filter across models even if they do not have the same fiscal time offset. In this case, the filtering is done based on the calendar time.
- Blending on models with fiscal time is done based on the period name, so use caution if the models have a different fiscal period offset.
Data Integration
Map an uploaded dataset to an existing model using the card view
With this release, we’ve revamped the experience of importing data – now, you can use the card view to more easily map your uploaded data to an existing model.
- Models are now represented as cards.
- Dimensions with attributes are now displayed in stacks – simply double-click a dimension to reveal a “drawer” with all its attributes expanded.
- An advantage of this new card view is you can now use drag-and-drop functionality to move unmapped source columns into the target model entity, and you can sort the list of source objects to see what is still unmapped.
- Any errors are highlighted immediately to help you quickly identify and make corrections.
Show/hide columns when preparing data
You can now show or hide columns of the source data when creating a model or importing data.
- You can easily hide selected columns via the quick action menu.
- A new panel is available to help you see and manage columns that are hidden.
Collaboration
Display updated values in data point comments
When you add a comment on a data point, the comment now includes the original value if the data is updated in the cell – this now makes it easy for you and others to see what has changed.
- Learn how to pin and comment on a data point in a story (video)
- Learn how to add comments to a story (video)
Mobile
Support for iPhone X
The layout of the SAP Analytics Cloud mobile app now adapts to the edge-to-edge display of the iPhone X.
Infrastructure
Search and create folders when saving a story or Digital Boardroom
You can now create folders in the Save / Save As dialog when saving a story or a Digital Boardroom. By default, folders will be directly created under “My Files”. If you create folders within an existing folder (i.e. a public folder, team folder, or any other folder that is already shared), it will inherit the same security settings of its parent folder. You can also search to locate a specific subfolder to save into, or a specific story or boardroom to overwrite.
Data Analysis, Stories, and Tables
Display variance charts in table cells
In release 2017.14, we introduced in-cell charts so that you can embed bar/column charts in your table cells. We’ve expanded on this capability so that you can now also include variance bar charts and variance pins (for % variance) in table cells. Plus and minus (+/-) signs in data labels are also supported.
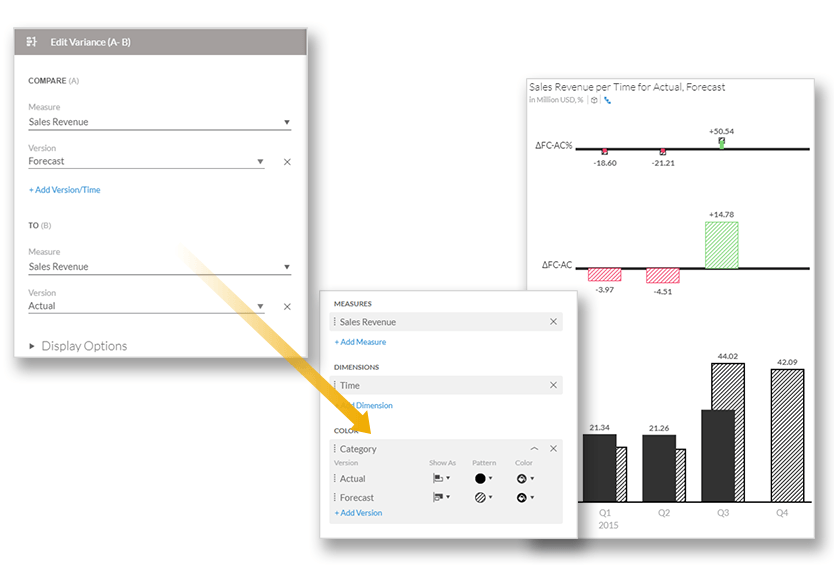
Version patterns on variance bars and pins
Version patterns can now be used in variance bars and pins, in accordance with IBCS (International Business Communication Standards) standards. For a forecast-actual variance, the forecast pattern is shown in the bar or pin and the actual pattern is shown in the variance axis.
Thresholds support version patterns
Version patterns will now be preserved when you apply thresholds on a chart. You can use the legend to quickly distinguish between patterns.
Table threshold formatting improvements
In this release, you now have better control over the display of threshold values and cells in a table.
- Symbols, font colors, and cell background colors can now be used to indicate thresholds.
- Threshold styles can be saved as story preferences.
Custom decimal places for table measures and calculations
You can now specify the number of decimal places used for measures and calculations in tables.
Improved look for smaller geo visualizations
Geo maps now look better when you size them down in your stories. Improvements include:
- Automatic hiding of legends once a map becomes smaller than the optimal size.
- Automatic hiding of interactive navigation options (e.g. zoom) when the geo map is not selected/in focus.
- Learn how to create a geo map (video)
- Learn how to create a point of interest layer to display in geo maps (video)
Additional resources:
- Video tutorials
- Guided learning
- Events and recordings
- SAP Analytics Cloud help resources
- Official roadmap contains more info on future plans, subject to change.
Previous feature summary blogs:
- SAP Analytics Cloud release 2017.21
- SAP Analytics Cloud release 2017.20
- SAP Analytics Cloud release 2017.19
- More >
*SAP Analytics Cloud was previously known as SAP BusinessObjects Cloud
**Legal disclaimer
SAP has no obligation to pursue any course of business outlined in this blog or any related presentation, or to develop or release any functionality mentioned therein. This blog, or any related presentation and SAP’s possible future developments, products and or platforms directions and functionality are all subject to change and may be changed by SAP at any time for any reason without notice. The information in this blog is not a commitment, promise or legal obligation to deliver any material, code, or functionality. This blog is provided without a warranty of any kind, either express or implied, including but not limited to, the implied warranties of merchantability, fitness for a particular purpose, or non-infringement. This blog is for informational purposes and may not be incorporated into a contract. SAP assumes no responsibility for errors or omissions in this document, except if such damages were caused by SAP’s willful misconduct or gross negligence.
All forward-looking statements are subject to various risks and uncertainties that could cause actual results to differ materially from expectations. Readers are cautioned not to place undue reliance on these forward-looking statements, and should not be relied upon in making purchasing decisions.
- SAP Managed Tags:
- SAP Analytics Cloud
You must be a registered user to add a comment. If you've already registered, sign in. Otherwise, register and sign in.
Labels in this area
-
ABAP CDS Views - CDC (Change Data Capture)
2 -
AI
1 -
Analyze Workload Data
1 -
BTP
1 -
Business and IT Integration
2 -
Business application stu
1 -
Business Technology Platform
1 -
Business Trends
1,658 -
Business Trends
92 -
CAP
1 -
cf
1 -
Cloud Foundry
1 -
Confluent
1 -
Customer COE Basics and Fundamentals
1 -
Customer COE Latest and Greatest
3 -
Customer Data Browser app
1 -
Data Analysis Tool
1 -
data migration
1 -
data transfer
1 -
Datasphere
2 -
Event Information
1,400 -
Event Information
66 -
Expert
1 -
Expert Insights
177 -
Expert Insights
298 -
General
1 -
Google cloud
1 -
Google Next'24
1 -
Kafka
1 -
Life at SAP
780 -
Life at SAP
13 -
Migrate your Data App
1 -
MTA
1 -
Network Performance Analysis
1 -
NodeJS
1 -
PDF
1 -
POC
1 -
Product Updates
4,577 -
Product Updates
344 -
Replication Flow
1 -
RisewithSAP
1 -
SAP BTP
1 -
SAP BTP Cloud Foundry
1 -
SAP Cloud ALM
1 -
SAP Cloud Application Programming Model
1 -
SAP Datasphere
2 -
SAP S4HANA Cloud
1 -
SAP S4HANA Migration Cockpit
1 -
Technology Updates
6,873 -
Technology Updates
421 -
Workload Fluctuations
1
Related Content
- Composite Data Source Configuration in Optimized Story Experience in Technology Blogs by SAP
- 体验更丝滑!SAP 分析云 2024.07 版功能更新 in Technology Blogs by SAP
- Top Picks: Innovations Highlights from SAP Business Technology Platform (Q1/2024) in Technology Blogs by SAP
- What’s New in SAP Analytics Cloud Release 2024.08 in Technology Blogs by SAP
- Sneak Peek in to SAP Analytics Cloud release for Q2 2024 in Technology Blogs by SAP
Top kudoed authors
| User | Count |
|---|---|
| 38 | |
| 25 | |
| 17 | |
| 13 | |
| 7 | |
| 7 | |
| 7 | |
| 7 | |
| 6 | |
| 6 |