
- SAP Community
- Products and Technology
- Technology
- Technology Blogs by SAP
- Enriching SAP BW with SAP Predictive Analytics - T...
Technology Blogs by SAP
Learn how to extend and personalize SAP applications. Follow the SAP technology blog for insights into SAP BTP, ABAP, SAP Analytics Cloud, SAP HANA, and more.
Turn on suggestions
Auto-suggest helps you quickly narrow down your search results by suggesting possible matches as you type.
Showing results for
Product and Topic Expert
Options
- Subscribe to RSS Feed
- Mark as New
- Mark as Read
- Bookmark
- Subscribe
- Printer Friendly Page
- Report Inappropriate Content
10-17-2017
8:59 AM
This is the second blog in a series of three about enriching SAP BW with SAP Predictive Analytics:
In the previous blog we explained how SAP Predictive Analytics adds value to your SAP BW. In this document we look at the technical side of things.
There are two different options available on creating forecasts.
This blogs describes the scheduling concept. Forecasts are produced on a regular basis and written into SAP HANA. This article is focusing on the technical workflow, assuming for example that you have already identified a clear business case for a specific prediction.

Technical prerequisites for this scenario are:
Optional components:
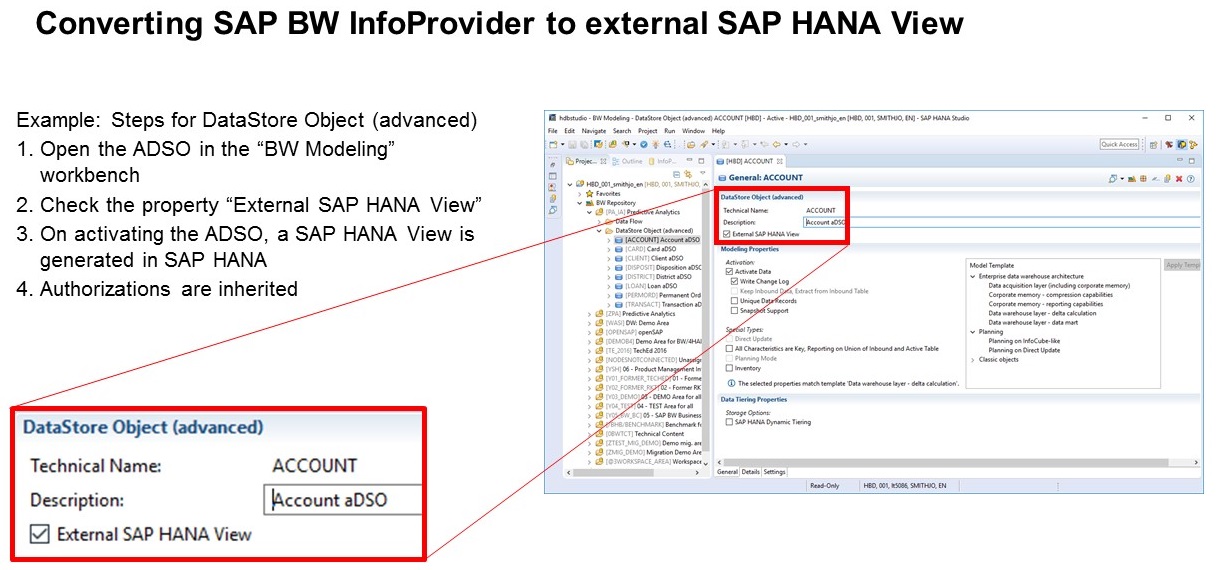
To save time and effort we want to leverage the existing logic of your SAP BW system. This is achieved by exposing the SAP BW objects as SAP HANA Calculation Views, using the SAP BW functionality you might already be familiar with. In the properties of an Advanced DataStore Object for example, just select the option "External SAP HANA View".
Many different SAP BW objects can be exposed as SAP HANA View. SAP NetWeaver 7.5 SPS09 for instance allows to generate SAP HANA Views for the following objects: SAP HANA-optimized InfoCube, DataStore object (classic), DataStore object (advanced), InfoObject, query as InfoProvider, CompositeProvider, local CompositeProvider in BW Workspace, Open ODS view as PartProvider of a CompositeProviders and query.
On activation you will see the corresponding Calculation View in SAP HANA's "Content" structure.

At this point we can connect with SAP Predictive Analytics to the data. If your data is already structured for the predictive purposes, that would be great. Most likely some restructuring will be needed though. If you want to predict a customer's behaviour for example, then each of your customers must be described in a single row of data. This condensed view on the level of customer is needed so that a predictive rule can be found that assigns predictions to each customer. Chances are that currently this information is spread across multiple objects and rows.
Such restructuring can be done using the "Data Manager" component in SAP Predictive Analytics. Data is restructured on the fly without needing a permanent duplication. The interface is graphical to support efficiency. Scripting is possible also if desired.
Joining the Calculation Views is straight-forward.

You will appreciate "Data Manager" most when having to aggregate multiple rows to achieve the level of granularity need for the prediction. So sticking to our example, you will need to turn the multiple rows of a customer into a single row that is probably much wider.
A customer's sales history could be turned from thousands of rows / transactions into one line with columns such as

Creating these aggregates by hand, ie with SQL syntax, would be possible, but not scalable. Very quickly you can have hundreds if not thousands of variables. You could create a similar revenue analysis for the last 4 years and just looking at quarterly aggregation alone creates 16 columns. These can be created individually for each of your product segments. Having only 10 segments, would lead to 160 columns. Think of all the other information that could be helpful. Don't exclude anything on personal gut feel.
Also multiple aggregation types can be used at the same time. It could be helpful to know what was the maximum revenue per quarter, or the minimum, or how many transactions occured each quarter. Other aggegration types are possible of course. Go as broad as possible to keep the chance that some of these variables will be helpful. Later on, the automated predictive framework can identify and select which variables are actually needed.
These aggregates are created graphically in Data Manager. Again, this is purely semantic. There is no data transfer or duplication.

Now that the data is structured accordingly, let's create our predictive model! Using the Automated Mode of SAP Predictive Analytics, this is like taking a photo with a digital camera. Focus on the picture you want to take and press the shutter. Here you can focus on the business question in mind, provide the view of your data and let the predictive framework do it's work to find the best possible model.
If you are not a Data Scientist, this automation opens up the world of Predictive Analytics / Machine Learning for you. If you are a Data Scientist, this automation can take care of the recurring tasks, saving you a tremendous amount of time. So your back is covered and you can explore and experiment with new use cases.

You will know that the model is trained directly in SAP HANA, reducing complexity and avoiding the usual caveats of data extraction (data consistency, delay, possibility of errors, security...).
When the model has been found, some overall statistics are presented to you. I will not explain the details here, but the overall quality is represented in two easy to understand measures:
If you really want to know more about these statistics and what happens in the background, please have a look at this blog: How does Automated Analytics do it? The magic behind creating predictive models automatically

The model is ready to go into production. However, you may also be interested in the inner workings of the model. Very often these can reveal interesting insights. The default representation is easy to understand and can be shared and discussed with a larger audience. A specialist user has more options available to investigate the predictive model.

We can use this model immediately to create predictions. Or for long-term productive use, have it maintained by the Predictive Factory. The Factory can create predictions when needed for your processes.

These new forecasts can be written directly into SAP HANA. You can choose how previous forecasts should be handled at this point. They can either be overwritten so that only the latest forecast is kept, or you can keep all historic forecasts to build up an overview of how the forecasts have changed over time.

It can also retrain the predictive model as and when required. As the underlying data changes, any predictive model will deteriorate over time. Therefore models need to be consistently monitored and retrained. The Predictive Factory takes care of this, also collecting a history of how the quality of the model has been changing over time.

Now that the predictions are kept in SAP HANA, it is easy for SAP BW to pick up these forecasts and join them with existing content.

This example uses an Open ODS View:

We have seen how SAP BW can be enriched with predictions, leveraging existing logic and content. Any application can now access this information to improve decisions. This could be an automated process that has improved visibility for automated decisions. Or, to name a second example, it could be a Dashboard, which is now showing both the past as well as predictions in a single view.
The next blog in this series is looking at the typical steps of a project.
- Introduction
- Technical Integration (this page)
- Steps of a Project
Technical Integration
In the previous blog we explained how SAP Predictive Analytics adds value to your SAP BW. In this document we look at the technical side of things.
There are two different options available on creating forecasts.
- They can be created in real-time.
- Or the forecasts can be calculated on regular intervals through automated scheduling.
This blogs describes the scheduling concept. Forecasts are produced on a regular basis and written into SAP HANA. This article is focusing on the technical workflow, assuming for example that you have already identified a clear business case for a specific prediction.
Technical prerequisites for this scenario are:
- SAP BW must run on SAP HANA. You will see that data is accessed through Calculation Views in SAP HANA. If your SAP BW is running on another database, then this option is obviously not be available.
- The predictive models are automatically re-trained and applied by a server component, which requires an additional server installation (SAP Predictive Analytics Server / SAP Predictive Analytics Factory). It is easiest to have both installed together on a Windows Server.
- Predictive models can be trained either in the web interface of the Predictive Factory or in the locally installed SAP Predictive Analytics Desktop. In this example we are using the Desktop installation.
- For a detailed list of the supported technical environments, please see the Product Availability Matrix (PAM) for SAP Predictive Analytics. The latest version of the PAM can be found on the SAP Predictive Analytics Community. Currently SAP Predictive Analytics 3.2 is supported on SAP HANA 1.0 SPS12 revision 122.04+ and SAP HANA 2.0.
Optional components:
- Strictly speaking it is optional, but to get the full value of SAP Predictive Analytics you really ought to install the Automated Predictive Library (APL) on SAP HANA. These are the algorithms that will train the predictive models directly in SAP HANA. Without the APL the data would be temporarily extracted by SAP Predictive Analytics.
Data Preparation
To save time and effort we want to leverage the existing logic of your SAP BW system. This is achieved by exposing the SAP BW objects as SAP HANA Calculation Views, using the SAP BW functionality you might already be familiar with. In the properties of an Advanced DataStore Object for example, just select the option "External SAP HANA View".
Many different SAP BW objects can be exposed as SAP HANA View. SAP NetWeaver 7.5 SPS09 for instance allows to generate SAP HANA Views for the following objects: SAP HANA-optimized InfoCube, DataStore object (classic), DataStore object (advanced), InfoObject, query as InfoProvider, CompositeProvider, local CompositeProvider in BW Workspace, Open ODS view as PartProvider of a CompositeProviders and query.
On activation you will see the corresponding Calculation View in SAP HANA's "Content" structure.
At this point we can connect with SAP Predictive Analytics to the data. If your data is already structured for the predictive purposes, that would be great. Most likely some restructuring will be needed though. If you want to predict a customer's behaviour for example, then each of your customers must be described in a single row of data. This condensed view on the level of customer is needed so that a predictive rule can be found that assigns predictions to each customer. Chances are that currently this information is spread across multiple objects and rows.
Such restructuring can be done using the "Data Manager" component in SAP Predictive Analytics. Data is restructured on the fly without needing a permanent duplication. The interface is graphical to support efficiency. Scripting is possible also if desired.
Joining the Calculation Views is straight-forward.
You will appreciate "Data Manager" most when having to aggregate multiple rows to achieve the level of granularity need for the prediction. So sticking to our example, you will need to turn the multiple rows of a customer into a single row that is probably much wider.
A customer's sales history could be turned from thousands of rows / transactions into one line with columns such as
- revenue previous quarter
- revenue two quarters ago
- change of revenue between quarters in Euro
- change of revenue between quarters in Percent
- ...
Creating these aggregates by hand, ie with SQL syntax, would be possible, but not scalable. Very quickly you can have hundreds if not thousands of variables. You could create a similar revenue analysis for the last 4 years and just looking at quarterly aggregation alone creates 16 columns. These can be created individually for each of your product segments. Having only 10 segments, would lead to 160 columns. Think of all the other information that could be helpful. Don't exclude anything on personal gut feel.
Also multiple aggregation types can be used at the same time. It could be helpful to know what was the maximum revenue per quarter, or the minimum, or how many transactions occured each quarter. Other aggegration types are possible of course. Go as broad as possible to keep the chance that some of these variables will be helpful. Later on, the automated predictive framework can identify and select which variables are actually needed.
These aggregates are created graphically in Data Manager. Again, this is purely semantic. There is no data transfer or duplication.
Train Model
Now that the data is structured accordingly, let's create our predictive model! Using the Automated Mode of SAP Predictive Analytics, this is like taking a photo with a digital camera. Focus on the picture you want to take and press the shutter. Here you can focus on the business question in mind, provide the view of your data and let the predictive framework do it's work to find the best possible model.
If you are not a Data Scientist, this automation opens up the world of Predictive Analytics / Machine Learning for you. If you are a Data Scientist, this automation can take care of the recurring tasks, saving you a tremendous amount of time. So your back is covered and you can explore and experiment with new use cases.
You will know that the model is trained directly in SAP HANA, reducing complexity and avoiding the usual caveats of data extraction (data consistency, delay, possibility of errors, security...).
When the model has been found, some overall statistics are presented to you. I will not explain the details here, but the overall quality is represented in two easy to understand measures:
- Predictive Power
- Predictive Confidence
If you really want to know more about these statistics and what happens in the background, please have a look at this blog: How does Automated Analytics do it? The magic behind creating predictive models automatically
The model is ready to go into production. However, you may also be interested in the inner workings of the model. Very often these can reveal interesting insights. The default representation is easy to understand and can be shared and discussed with a larger audience. A specialist user has more options available to investigate the predictive model.
Apply Model
We can use this model immediately to create predictions. Or for long-term productive use, have it maintained by the Predictive Factory. The Factory can create predictions when needed for your processes.
These new forecasts can be written directly into SAP HANA. You can choose how previous forecasts should be handled at this point. They can either be overwritten so that only the latest forecast is kept, or you can keep all historic forecasts to build up an overview of how the forecasts have changed over time.
Maintain
It can also retrain the predictive model as and when required. As the underlying data changes, any predictive model will deteriorate over time. Therefore models need to be consistently monitored and retrained. The Predictive Factory takes care of this, also collecting a history of how the quality of the model has been changing over time.
Combine with SAP BW Content
Now that the predictions are kept in SAP HANA, it is easy for SAP BW to pick up these forecasts and join them with existing content.
This example uses an Open ODS View:
We have seen how SAP BW can be enriched with predictions, leveraging existing logic and content. Any application can now access this information to improve decisions. This could be an automated process that has improved visibility for automated decisions. Or, to name a second example, it could be a Dashboard, which is now showing both the past as well as predictions in a single view.
The next blog in this series is looking at the typical steps of a project.
- SAP Managed Tags:
- Machine Learning,
- SAP Predictive Analytics,
- SAP BW/4HANA
You must be a registered user to add a comment. If you've already registered, sign in. Otherwise, register and sign in.
Labels in this area
-
ABAP CDS Views - CDC (Change Data Capture)
2 -
AI
1 -
Analyze Workload Data
1 -
BTP
1 -
Business and IT Integration
2 -
Business application stu
1 -
Business Technology Platform
1 -
Business Trends
1,658 -
Business Trends
92 -
CAP
1 -
cf
1 -
Cloud Foundry
1 -
Confluent
1 -
Customer COE Basics and Fundamentals
1 -
Customer COE Latest and Greatest
3 -
Customer Data Browser app
1 -
Data Analysis Tool
1 -
data migration
1 -
data transfer
1 -
Datasphere
2 -
Event Information
1,400 -
Event Information
66 -
Expert
1 -
Expert Insights
177 -
Expert Insights
298 -
General
1 -
Google cloud
1 -
Google Next'24
1 -
Kafka
1 -
Life at SAP
780 -
Life at SAP
13 -
Migrate your Data App
1 -
MTA
1 -
Network Performance Analysis
1 -
NodeJS
1 -
PDF
1 -
POC
1 -
Product Updates
4,577 -
Product Updates
344 -
Replication Flow
1 -
RisewithSAP
1 -
SAP BTP
1 -
SAP BTP Cloud Foundry
1 -
SAP Cloud ALM
1 -
SAP Cloud Application Programming Model
1 -
SAP Datasphere
2 -
SAP S4HANA Cloud
1 -
SAP S4HANA Migration Cockpit
1 -
Technology Updates
6,873 -
Technology Updates
421 -
Workload Fluctuations
1
Related Content
- Demystifying the Common Super Domain for SAP Mobile Start in Technology Blogs by SAP
- Exploring Integration Options in SAP Datasphere with the focus on using SAP extractors - Part II in Technology Blogs by SAP
- IoT - Ultimate Data Cyber Security - with Enterprise Blockchain and SAP BTP 🚀 in Technology Blogs by Members
- Hack2Build on Business AI – Highlighted Use Cases in Technology Blogs by SAP
- SAP Partners unleash Business AI potential at global Hack2Build in Technology Blogs by SAP
Top kudoed authors
| User | Count |
|---|---|
| 39 | |
| 25 | |
| 17 | |
| 13 | |
| 7 | |
| 7 | |
| 7 | |
| 7 | |
| 6 | |
| 6 |